
For scalpers: How does the Expansion Entry Scalping Solution perform in live markets?
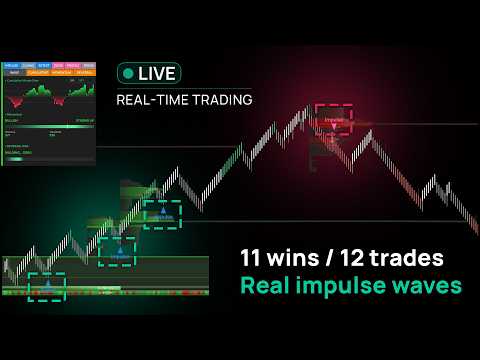
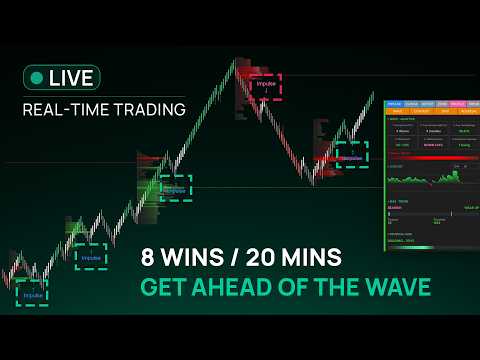
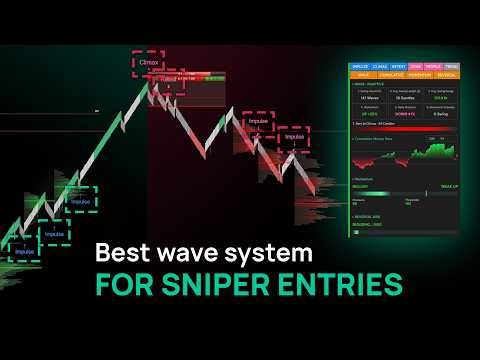
See it in action across all four live trading sessions →
Description
Poseidon Trident –E takes a Wave-based approach to reading Renko charts, turning consecutive bars into measurable units of market movement. Each Wave can be compared with recent behavior to put its length, range, and strength into context, while changes in Wave behavior reveal how the move is developing.
Key takeaways
- Reads Renko wave by wave: Consecutive bars grouped into measurable Waves, making their length and range easier to assess.
- Measures strength against the market itself: The Wave Saturation State compares each Wave with recent Wave behavior, so “strong” is defined by current conditions rather than a fixed bar count.
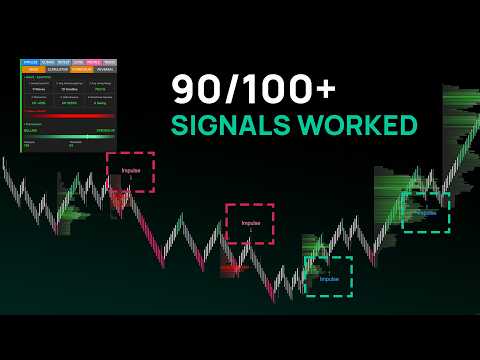
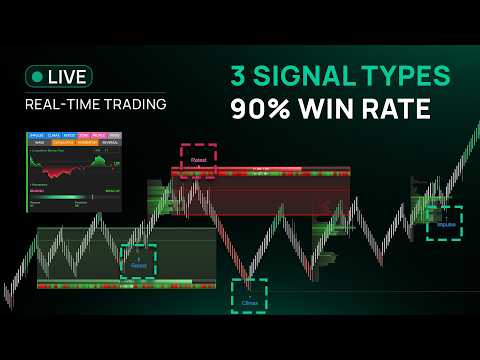
- 3 signal types, 3 market conditions: Impulse for expansion, Climax for extension, Retest for compression and breakout.
- 9 layers of market information: The Wave Dashboard shows market behavior, directional pressure and how a move is building, all from the same Wave.
See market strength through Renko Waves
A Wave intelligence engine for Renko charts that shows how strength develops, when a move becomes extended, and when continuation or exhaustion may be emerging – without counting bars, adjusting thresholds, or combining separate indicators.
Why read Renko by Waves
Traders already read Renko in runs of bars. Waves make that reading measurable.
A run of rising bars, a pullback, a stretch of sideways bricks: these are what most Renko traders look at.
Usually, the judgment is made by eye. Bars are counted by hand, “strong” is a feeling or a fixed number that stays the same while the market changes, and whether a move is early or late often becomes clear only afterward.
Grouping consecutive bars into Waves gives each run a defined length and range, so it can be:
- Measured: Each Wave has a length in bars and a range in ticks, replacing manual counting.
- Compared: The current Wave is checked against recent Waves, not against a fixed number.
- Classified: Expansion, pullback, compression and exhaustion are identified as they form.
Poseidon Trident –E does the grouping and comparison automatically and displays the result on the chart.
Measure strength by what’s normal for the market
What sets Poseidon Trident –E apart is how it measures Wave strength.
Instead of judging a Wave by a fixed number of bars or a predefined threshold, it uses Wave Saturation State, a relative measure derived from our proprietary statistical algorithm. It evaluates each Wave against the market conditions it is developing in.
A Wave of a given size can be a major push in a quiet session and routine movement in a faster one. Wave Saturation State puts that movement into context, so “strong” is defined by current market behavior rather than a number chosen in advance.
What it does:
- Analyzes recently completed Waves
- Establishes the typical range of movement for the current market
- Classifies the live Wave into one of four states as it develops
4 states of Wave strength
| State | Meaning | Used By |
|---|---|---|
| Weak | Wave is short relative to the typical range | Compression / Accumulation Zone |
| Normal | Wave remains within the typical range | Baseline reference |
| Strong | Wave extends beyond the typical range | Impulse Signal |
| Excessive | Wave extends far beyond the typical range | Climax Signal |
Built to adapt to market conditions
The reference range updates as recent Wave behavior changes. This allows Wave strength to be evaluated relative to the market it is actually developing in, without requiring a fixed bar-count threshold to be manually retuned as conditions change.
Turn Wave strength into trading signals
Wave Saturation State provides the context for 3 distinct signal types, each focused on a different way the market can move: continuation, exhaustion, or retest.
Impulse Signal
Strong Wave → Short Pullback → Strong Continuation
When a Wave pushes beyond its usual range, strength is easy to see and hard to trade. Enter on the big bar and you are often joining a move that has already done most of its work. Wait for it to become obvious and the continuation may have gone.
Impulse Signal looks at the pause in between. After a strong Wave, it waits for a short reset and signals when the move resumes with strength. The entry comes from the reset inside the move, not from the largest bar, so price tends to react soon after the signal instead of needing time to develop. That is why we call it a Sniper Entry.
Climax Signal
Extended Wave → Reaction → Climax
A move that keeps going will eventually feel “too far”, and that feeling is where many reversal attempts begin too early: sell, get stopped, sell again, get stopped again.
Climax Signal replaces the feeling with a measurement. It tracks how far the current Wave has extended compared with recent Wave behavior, then waits for price to react before signaling. It is not an overbought/oversold reading, and it does not treat a strong move as a reversal on its own.
Retest Signal
Compression → Breakout → Return → Reaction
When Up and Down Waves stay short over and over, neither side has control and price compresses into an Accumulation Zone. These areas rarely look attractive while they form, but once price breaks away, the zone becomes a meaningful reference.
The breakout itself is not always the best place to act. Retest waits for price to leave the zone, come back to it, and react in the breakout direction. The breakout gives you direction, and the retest gives you a place to act on it.
9 layers of information behind every Wave
Beyond its signals, Poseidon Trident –E provides 9 layers of information to help assess the structure, pressure, development, and risk behind each Wave.
Wave behavior
- Swing Count: Shows how many recent Waves are used to establish the current market reference.
- Avg. Swing Length: Shows the typical number of Renko bars in a Wave, providing context for the current Wave’s development.
- Avg. Swing Range: Shows the typical price range of a Wave in ticks, helping assess whether the current Wave is within or beyond its normal range.
Market pressure
- Momentum: Shows the directional strength currently driving the market.
- Delta Pressure: Compares Wave movement with the buying and selling pressure behind it.
- Cumulative Money Flow: Tracks the accumulation of buying and selling pressure as market movement develops.
Wave development
- Directional Impulses: Counts consecutive Strong Waves in the same direction, showing whether directional strength is building and being sustained.
- Bars to Climax: Shows how far the current Wave has progressed toward an unusually extended state.
Risk & remaining Room
- Reversal Risk: Assesses how exposed the current Wave structure is to a reversal, providing context for how much room may remain in the move.
Dedicated NinjaScript Signals
- Signal_Trend: 1 = bullish, -1 = bearish, 0 = no signal
- Signal_Trade: 3 = climax bullish, 2 = retest bullish, 1 = impulse bullish, -1 = impulse bearish, -2 = retest bearish, -3 = climax bearish, 0 = no signal
Product Media
These media materials may have been recorded/captured in favorable markets. Please review our “acceptable marketing practices”.
Videos
Software Changelog
- 12 Oct 2026 – The update issue in The Broken Zone was fixed.
- 28 Sep 2026 – The “Trend Enabled” feature was added.
- 14 Sep 2026 – The indicator was released (built new).
![[System] V-Elementra](https://renkokings.com/wp-content/uploads/V-Elementra-avatar-Renkokings.png)


![[System] Flazh Infinity](https://renkokings.com/wp-content/uploads/Flazh-Infinity-avatar.png)