Impulse
Ride strength after a short reset.
Read Renko Waves as they develop, and see strength building, exhaustion approaching, and opportunity taking shape without manually piecing together every bar.
Instead of constantly counting bars, adjusting thresholds, or combining different measures to judge whether a move is actually strong, you can let Poseidon Trident —E evaluate how that movement develops against an objective Wave Saturation State, statistically derived from recent Renko Wave behavior rather than from conventional technical indicators or fixed thresholds.

01
Strength is not static.
It develops with the Wave.
SYSTEM OVERVIEW
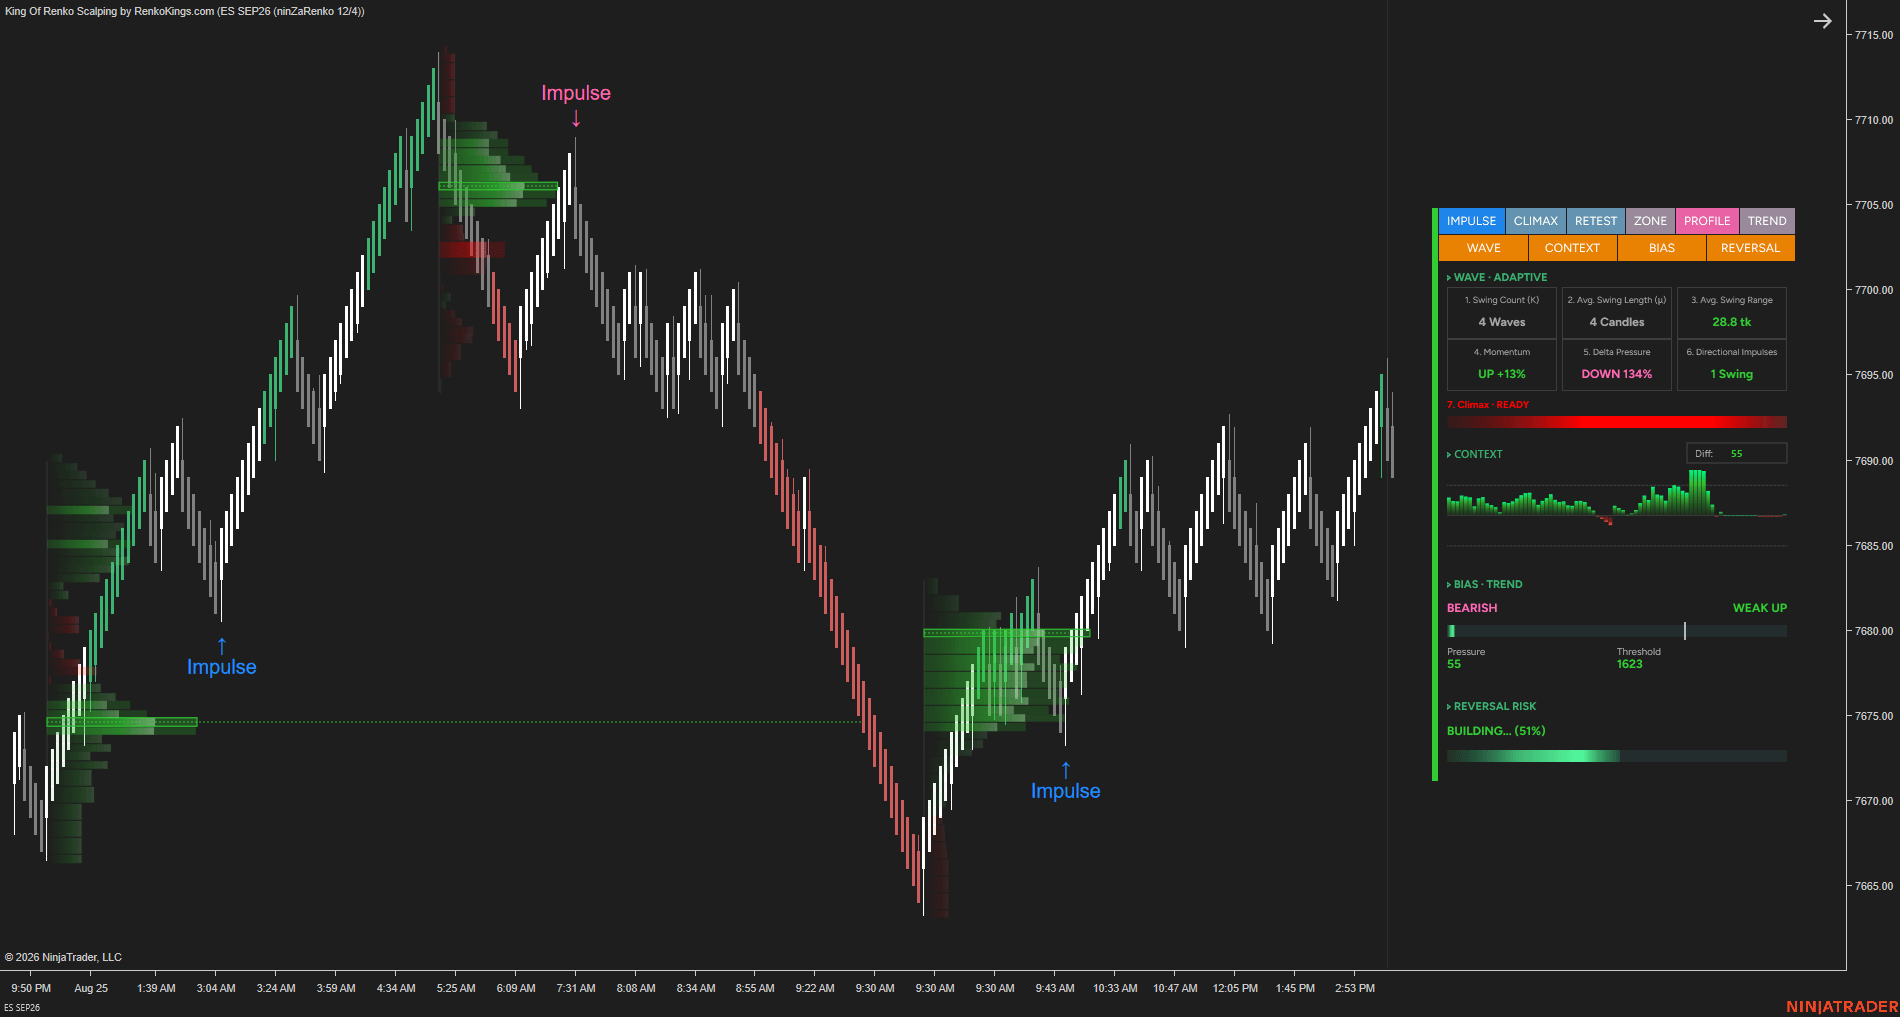
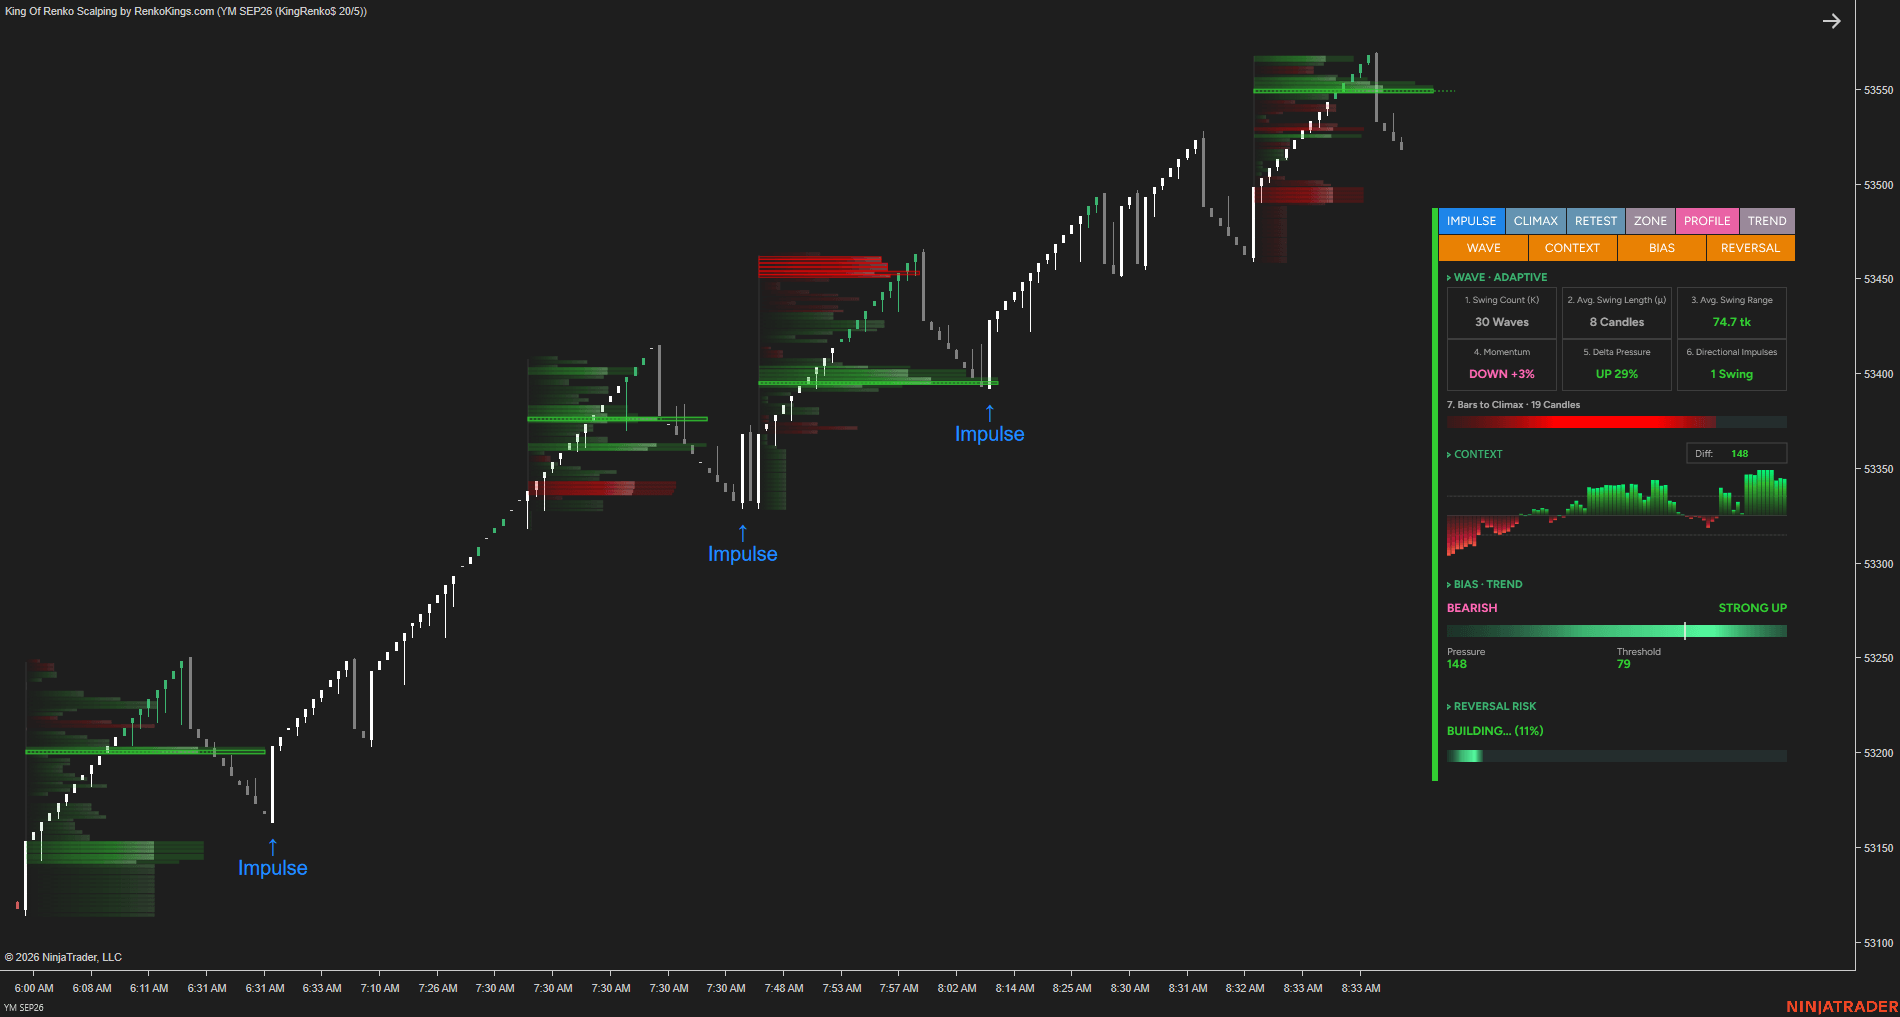
Access 95% of Wave Power in ONE trading system — see how Impulse, Climax, and Retest signals, the Wave Dashboard, and the Wave Saturation State work together inside Poseidon Trident —E.
A full walkthrough of the system before you dive into the signal-specific demos below.
For many traders, the appeal of Renko begins with one simple idea:
Remove the noise. See the movement.
And Renko does that remarkably well.
But after more than 100 real trading sessions, we began noticing something else.
The cleaner the chart became, the more there was to notice in the movement itself.
A move doesn’t simply go up.
And sometimes, after extending much further than usual, it starts to lose its character.
The important part wasn’t any single Renko bar. It was the way the bars were building together.
That led us to a different question:
What if Renko wasn’t meant to be read bar by bar, but Wave by Wave?
So we began grouping consecutive bars into Waves and studying what those Waves could tell us about the market.
The more we studied, the more convinced we became that Renko already contained much of the information we were looking for.
We didn’t need to make the chart more complicated. We needed to read what was already there differently.
That became the foundation of Poseidon Trident —E. We built it to bring this way of reading Renko Waves into everyday trading — so you can see not only where price is moving, but how that movement is developing.
We hope it helps you see Renko in a new way, too.
NINZA Team
02 / THE WAVE ENGINE
Traders often turn to different indicators to read different aspects of the market: a trend indicator for direction, an oscillator for momentum, another measure for strength. These tools can add perspective, but they are still derived from price, which can introduce a degree of lag.
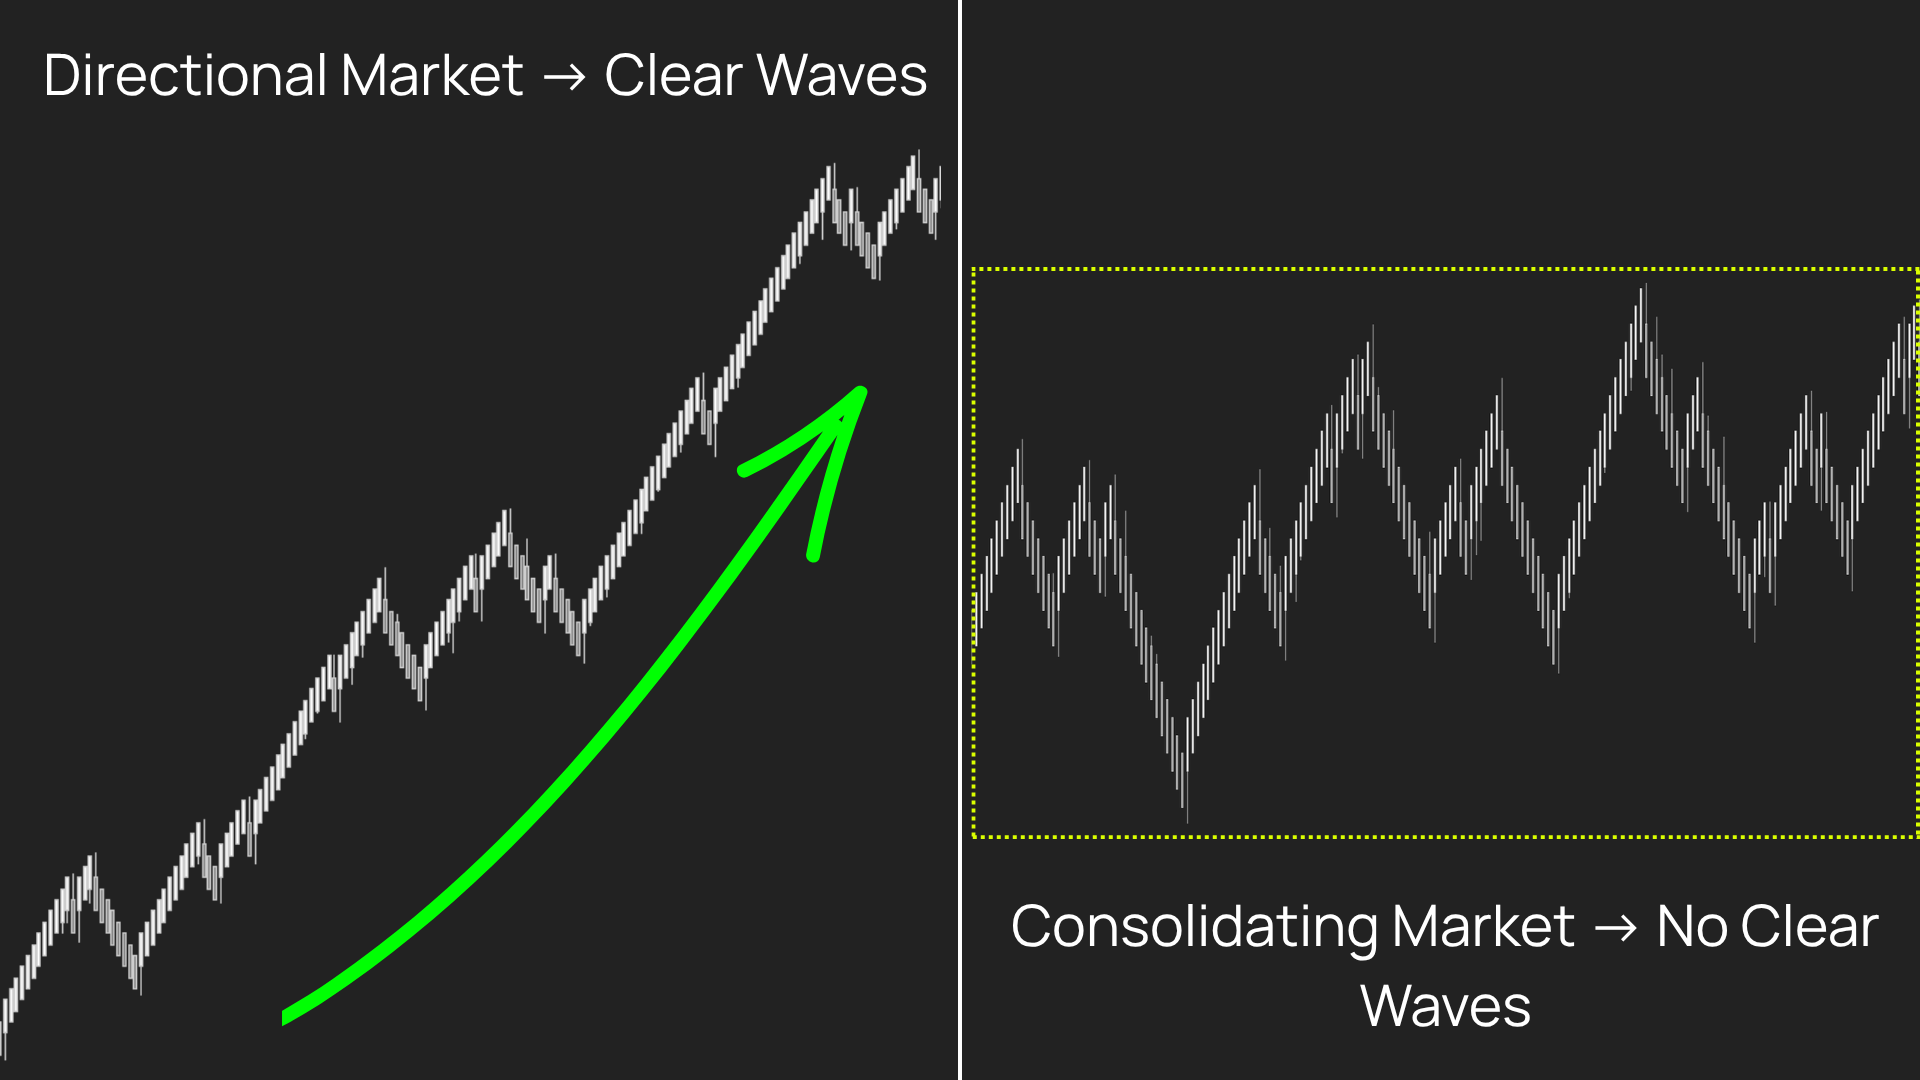
Meanwhile, the information was already on the chart. A Renko chart does not only show where price has moved. It shows how the movement is being built.
Once bars are viewed as Waves, individual movements become easier to distinguish: Expansion. Pullback. Compression. Continuation. Exhaustion.
Reading the chart this way means less effort interpreting isolated bars — and more attention on where the movement is actually going.
03 / THE REFERENCE POINT
How strong is strong? A Wave’s size means little on its own. A 10-bar Wave can be extraordinary in a low-volatility market and completely normal in a high-volatility one.
So instead of asking whether a Wave has reached a fixed number of bars, Poseidon Trident —E asks a different question:
How does this Wave compare with what is normal right now?
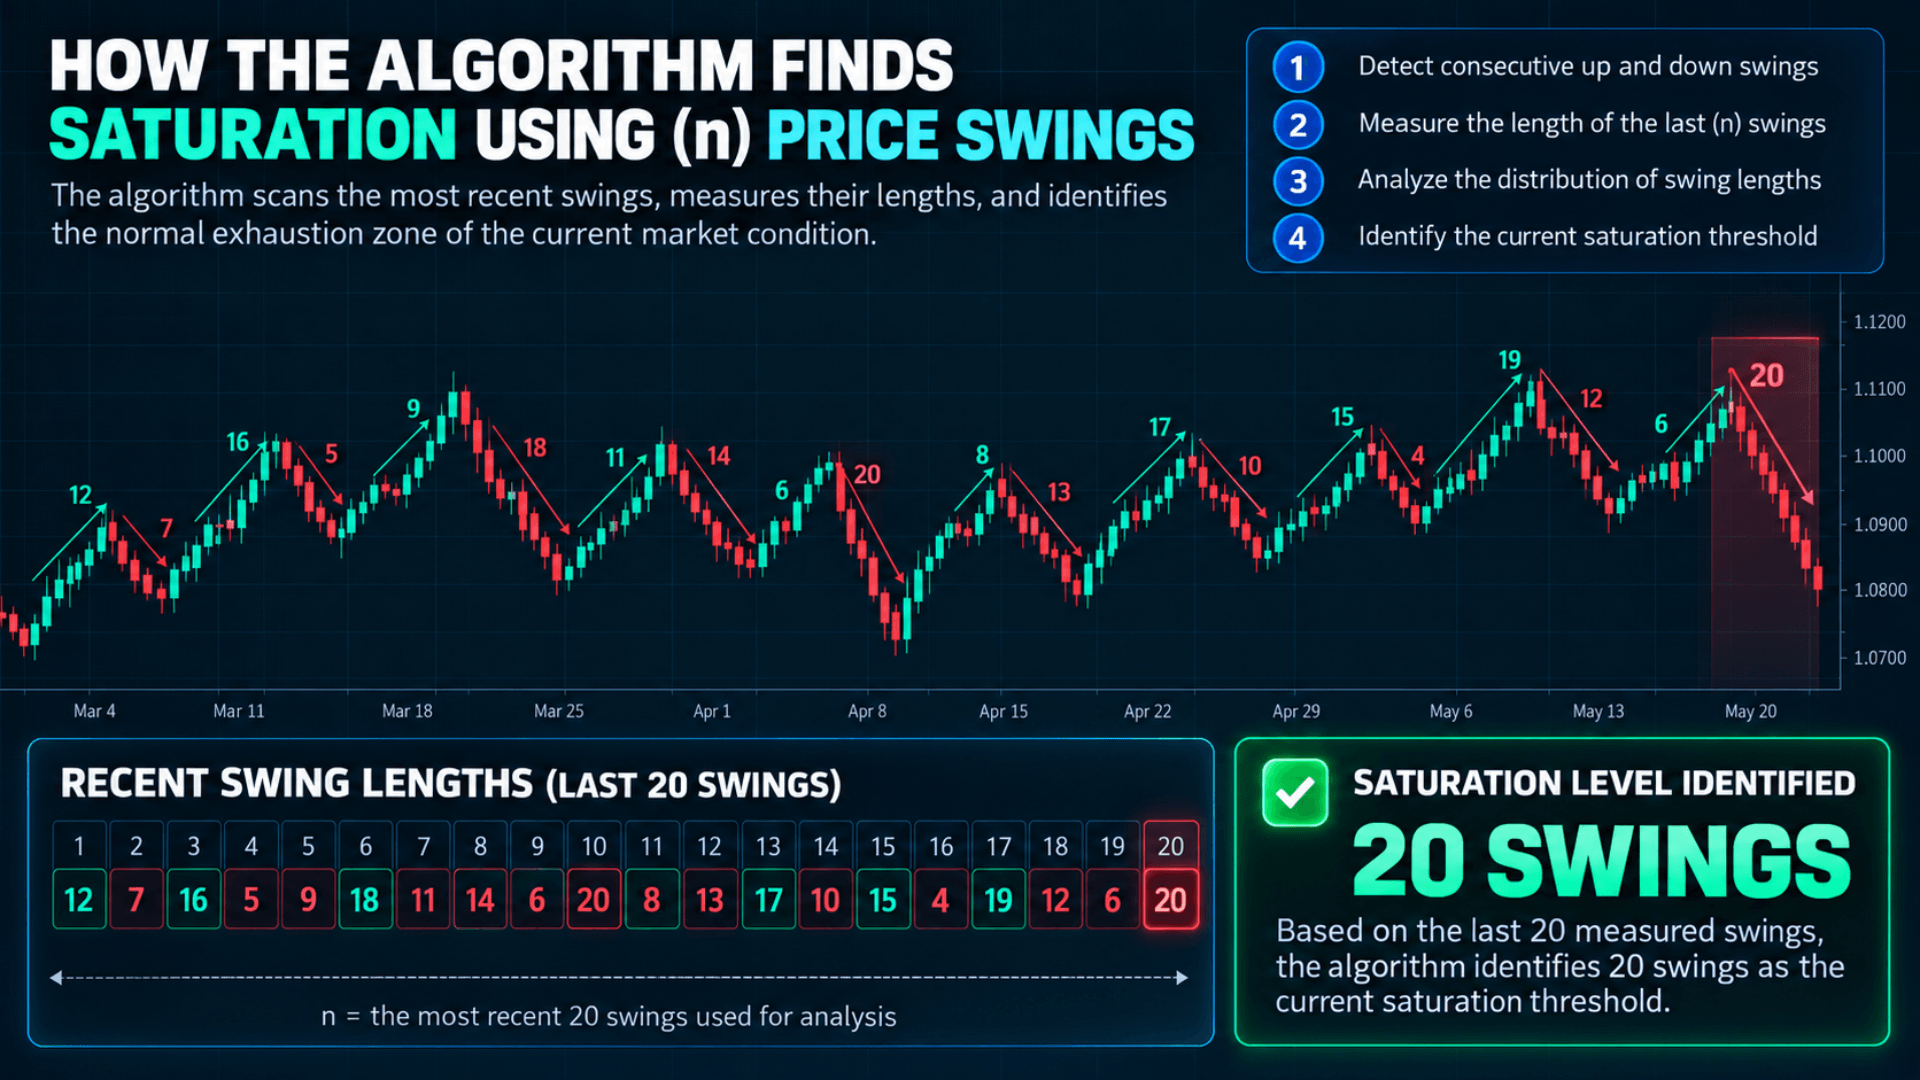
We developed a proprietary statistical algorithm that continuously analyzes recent Waves and establishes a market-defined range of normal movement. The current Wave can then be read in context:
We call this reference level the Wave Saturation State.
No fixed “strong Wave = X bars.” No need to keep changing thresholds as market behavior changes. The reference adapts as the market changes.
04 / THE TRIDENT
The Trident is more than a symbol. Its three points represent three distinct ways a trading opportunity can develop.

Ride strength after a short reset.
Recognize when strength becomes excessive.
Evaluate reaction after a breakout.
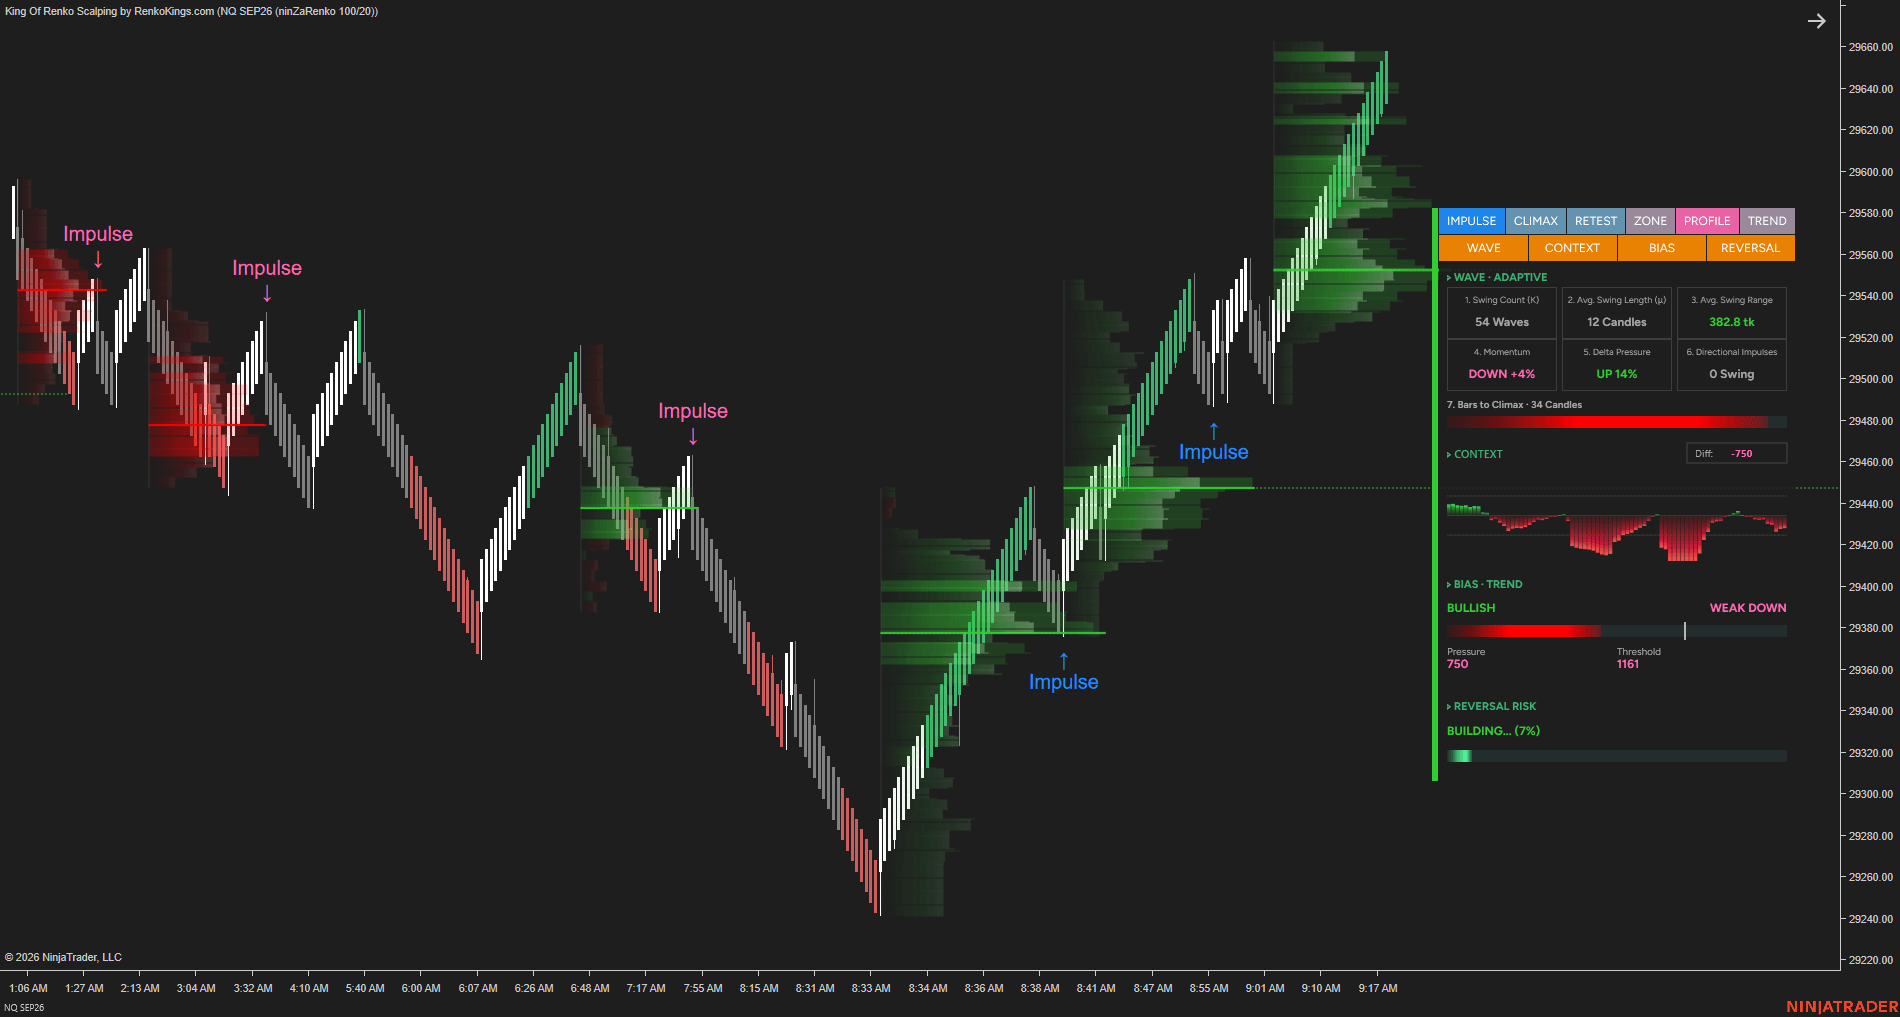
01 / IMPULSE
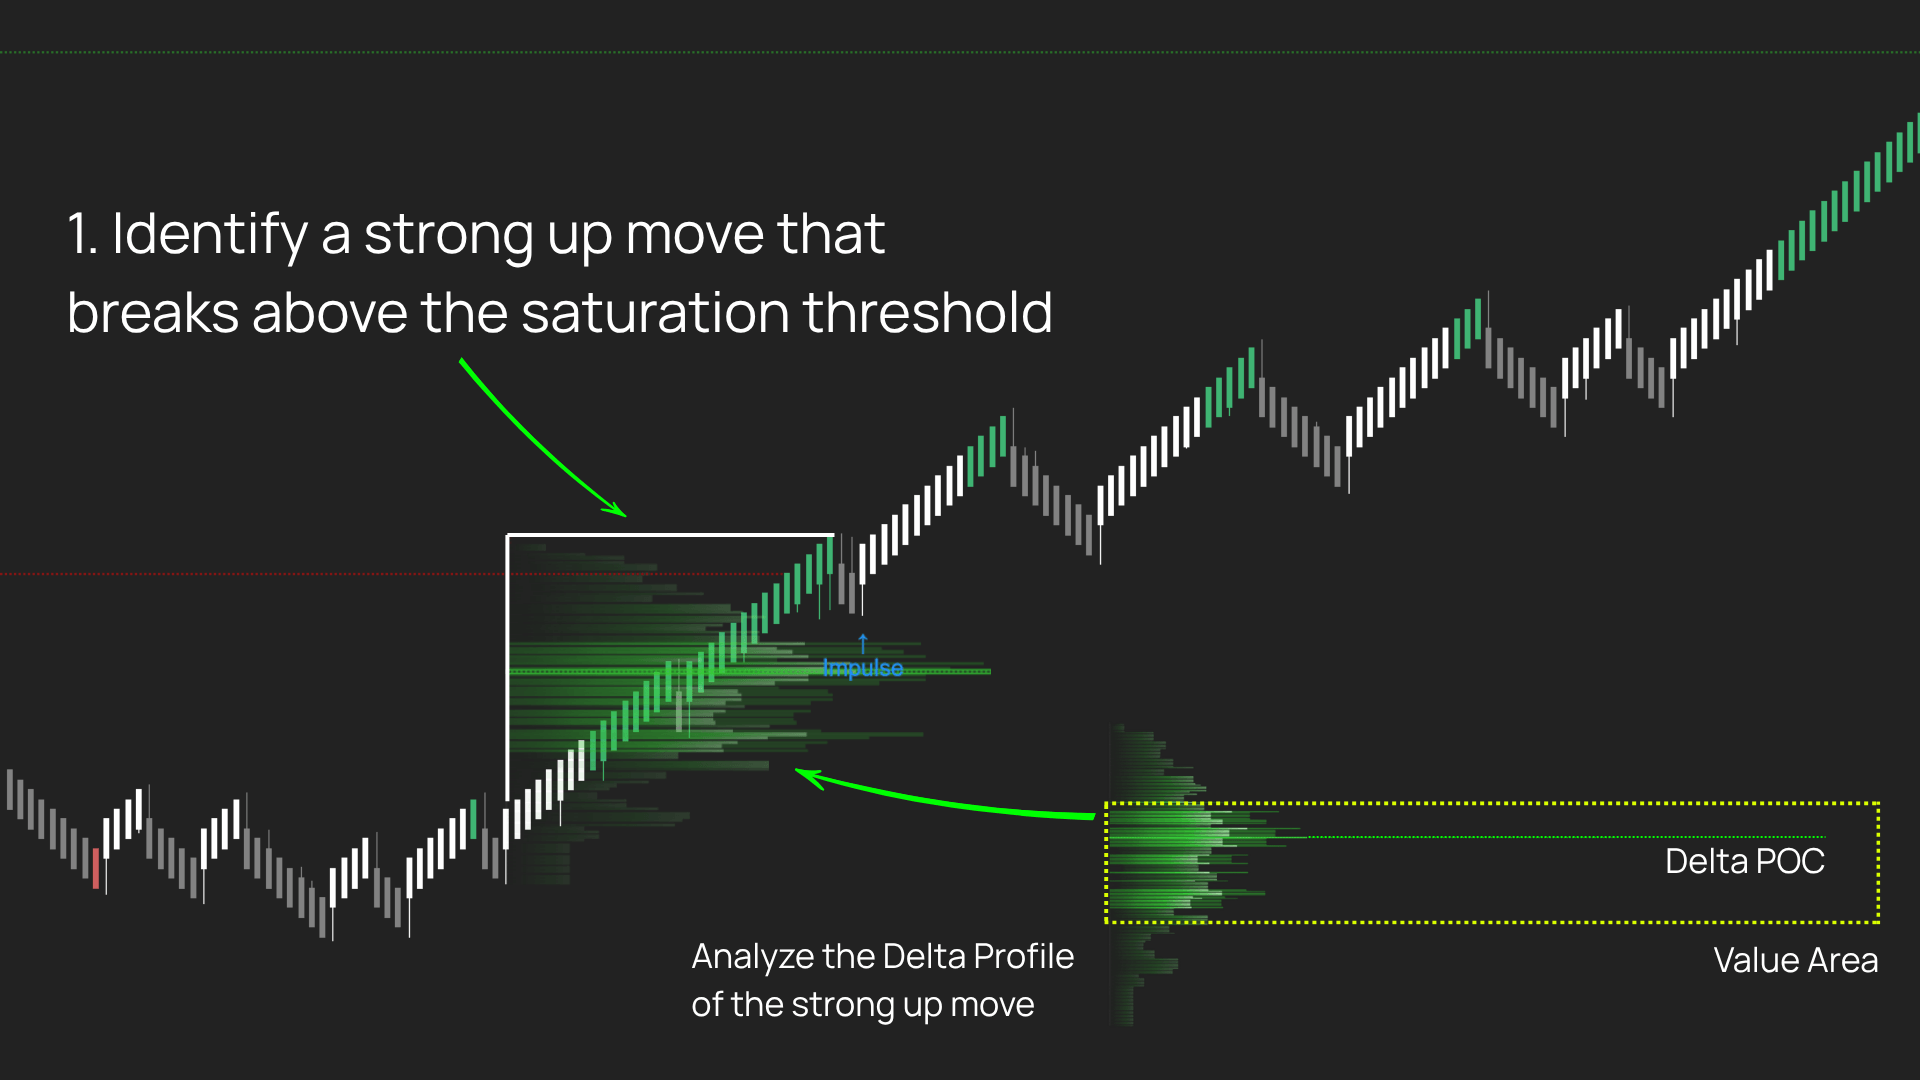
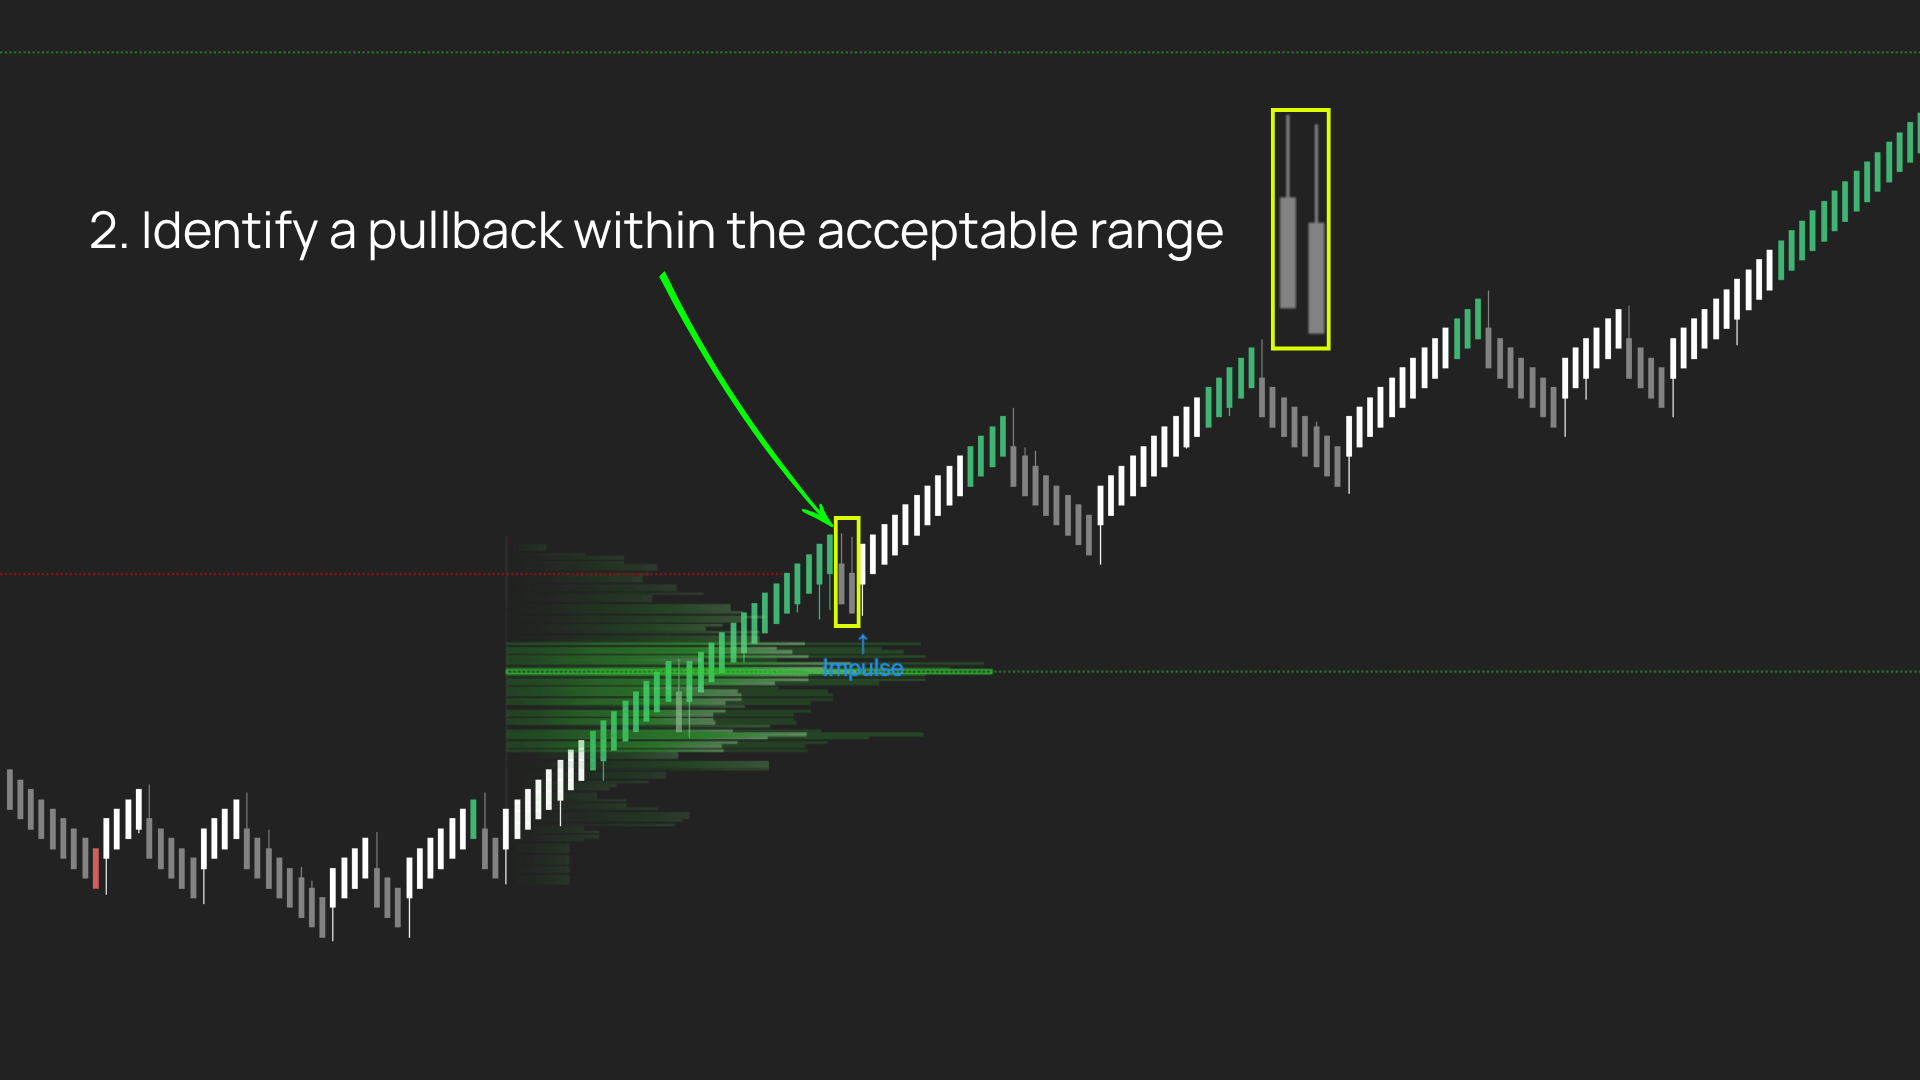
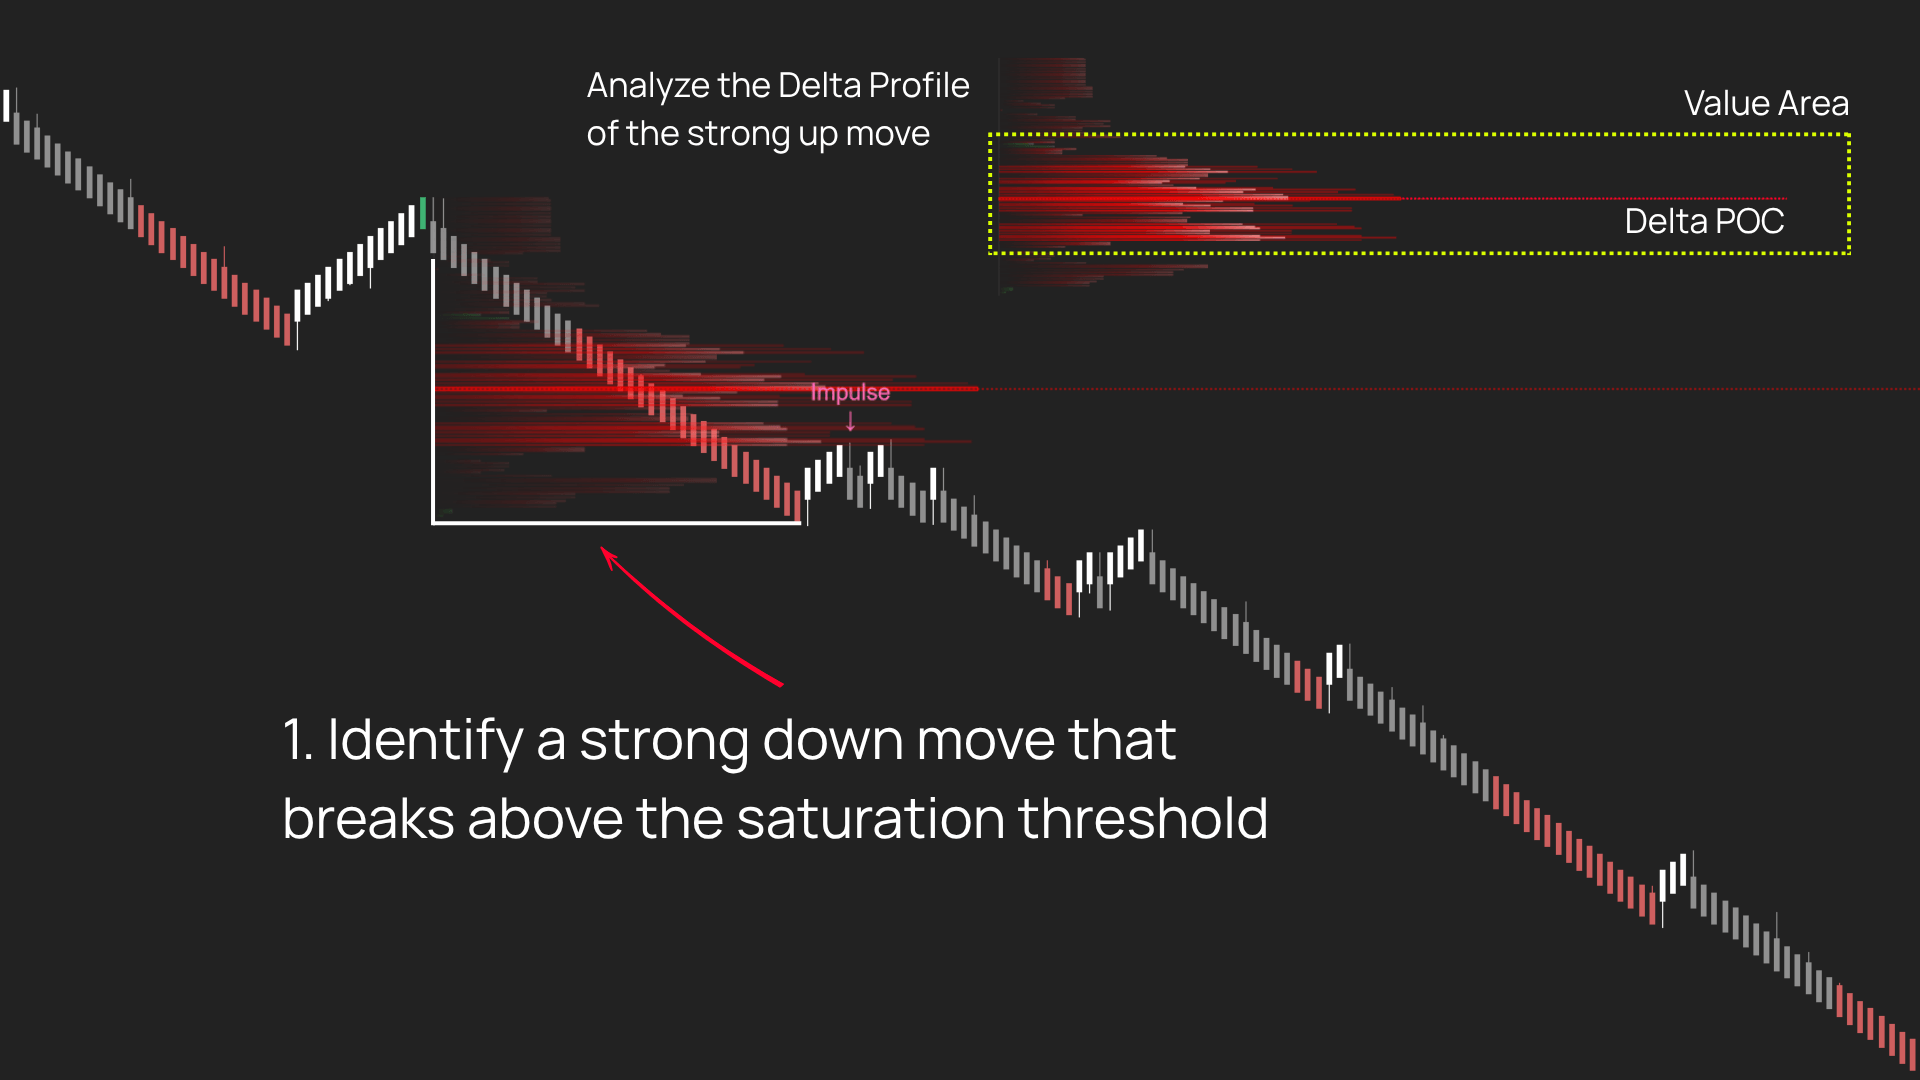
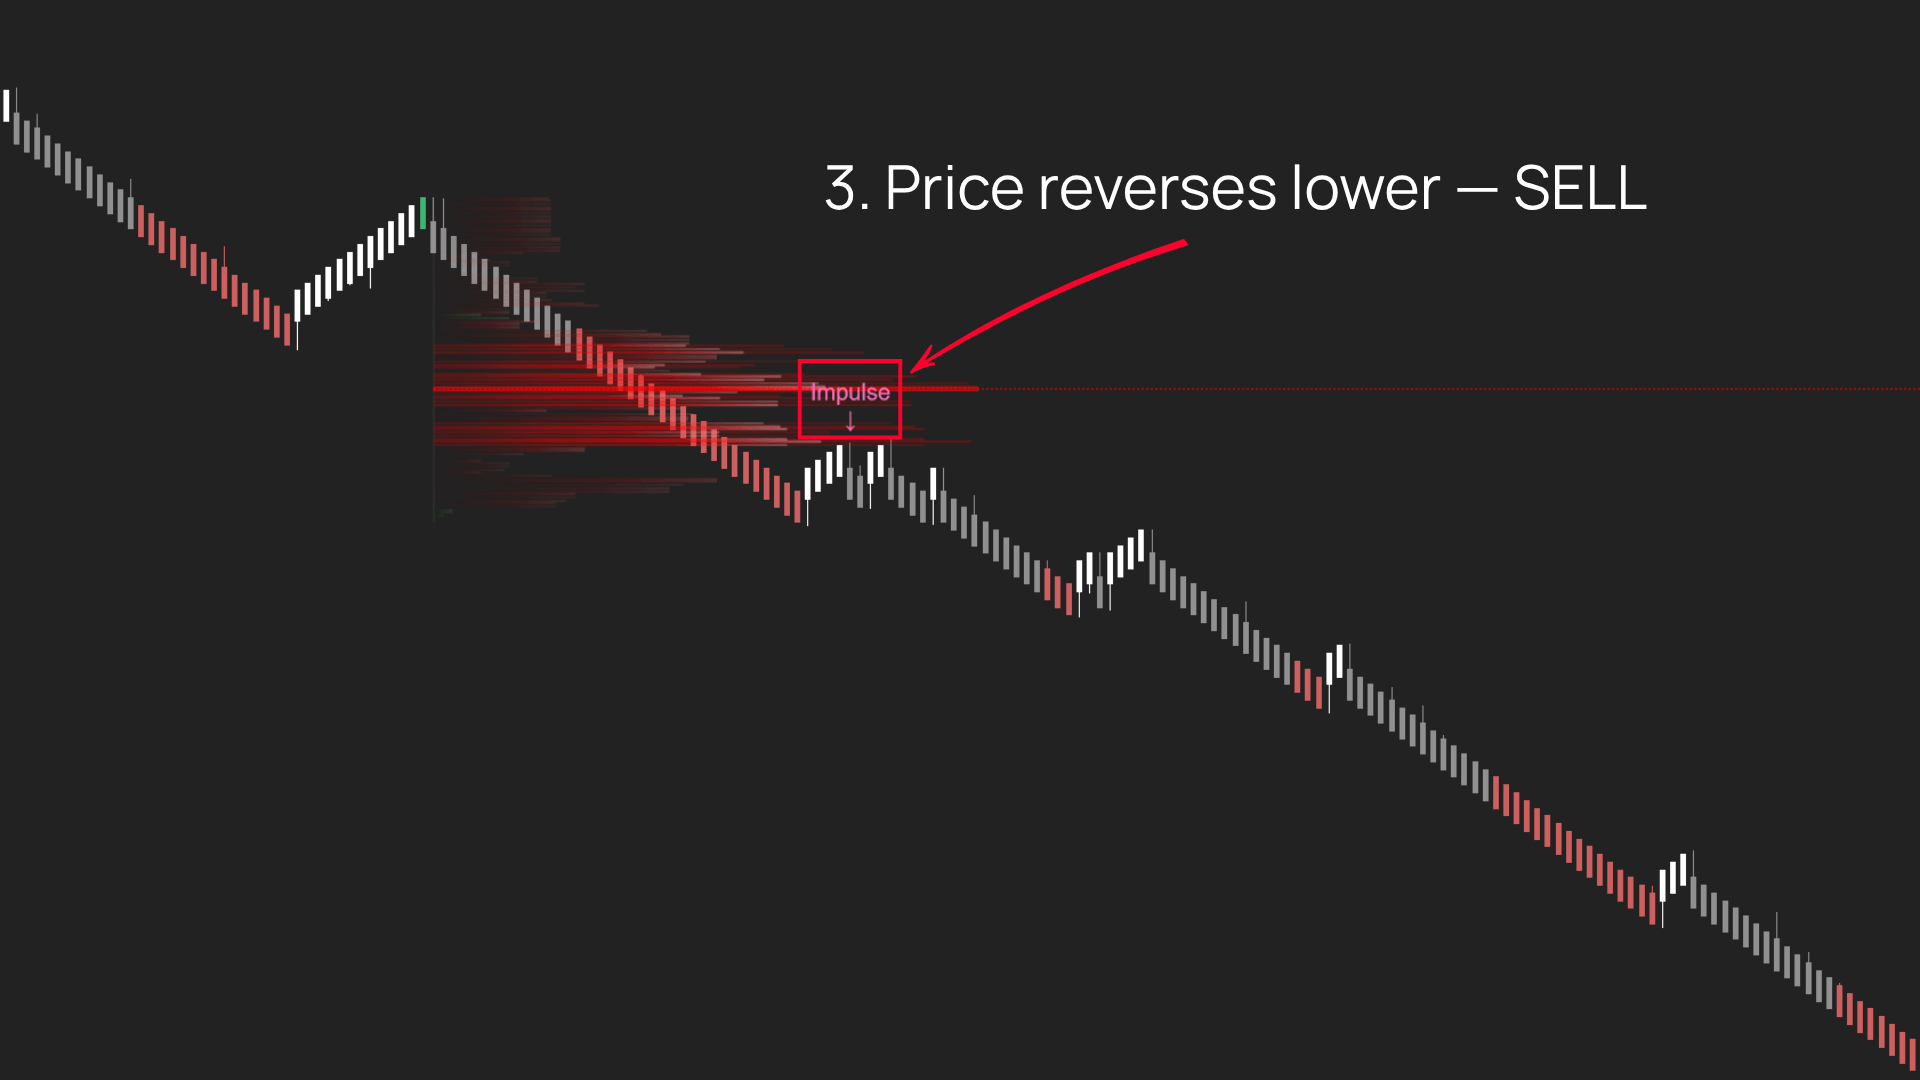
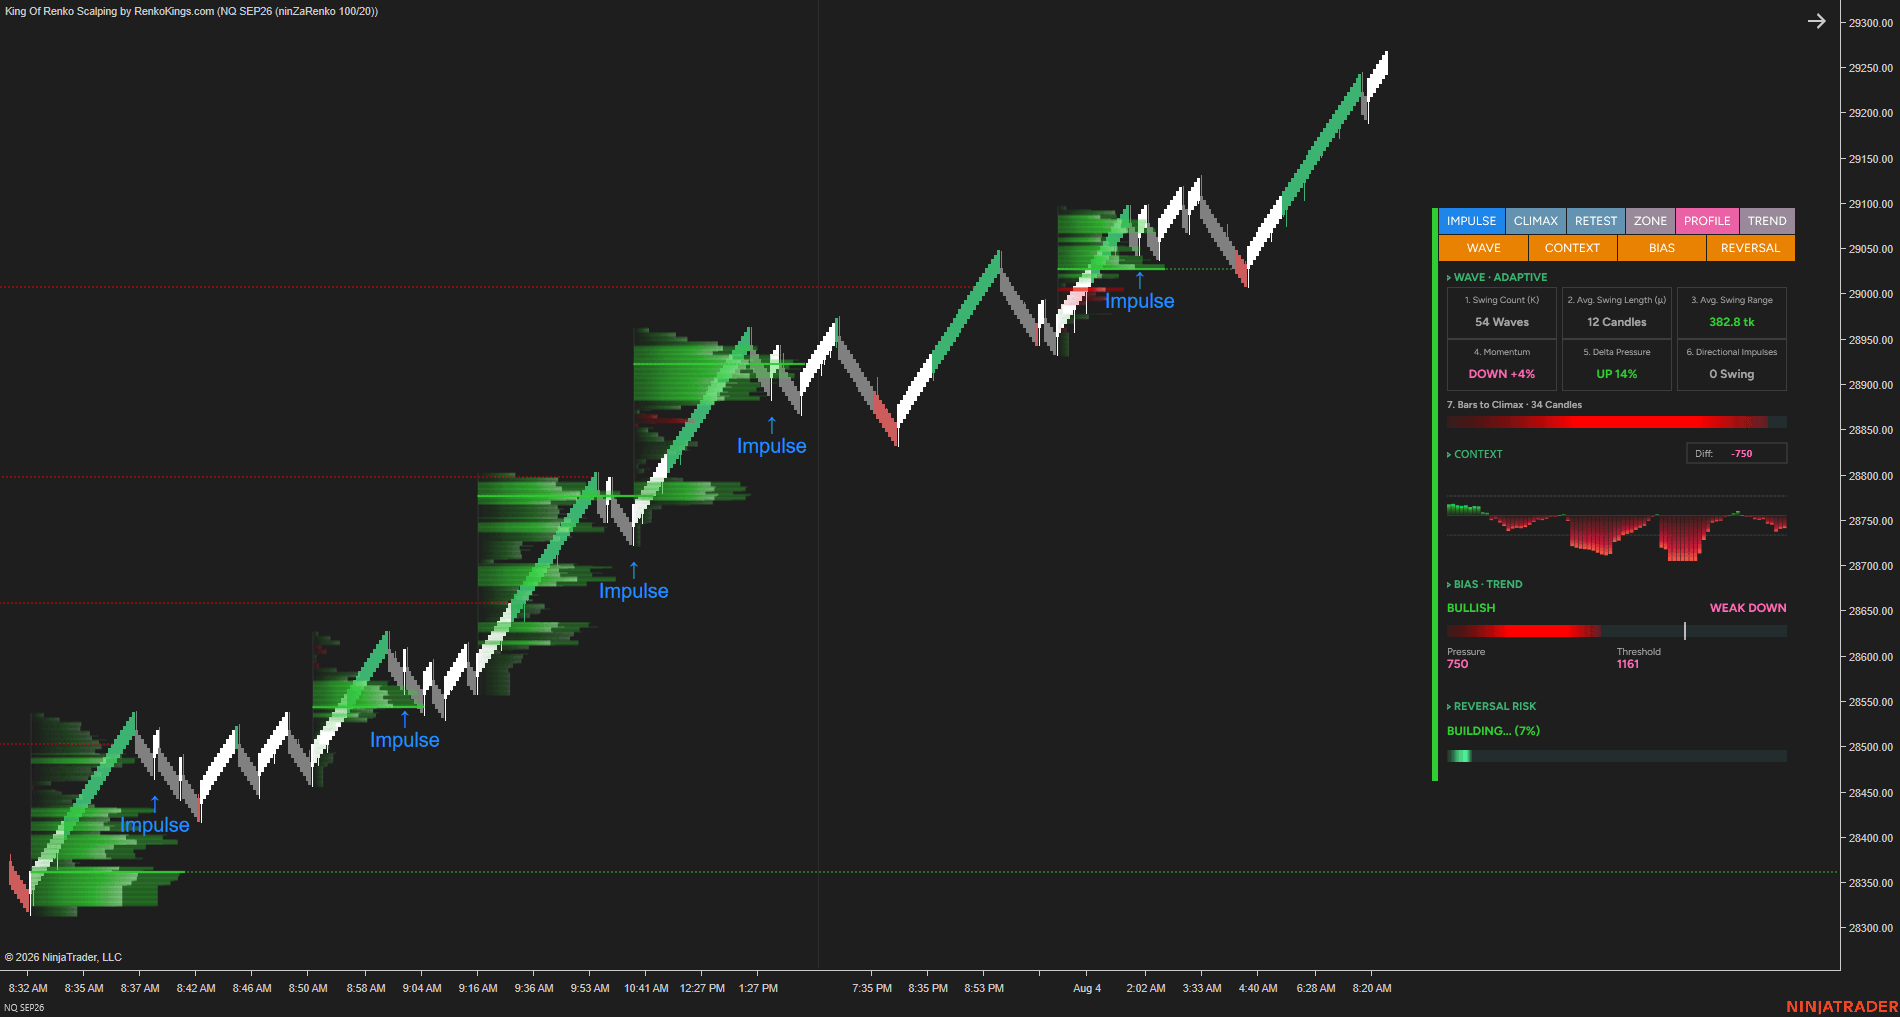
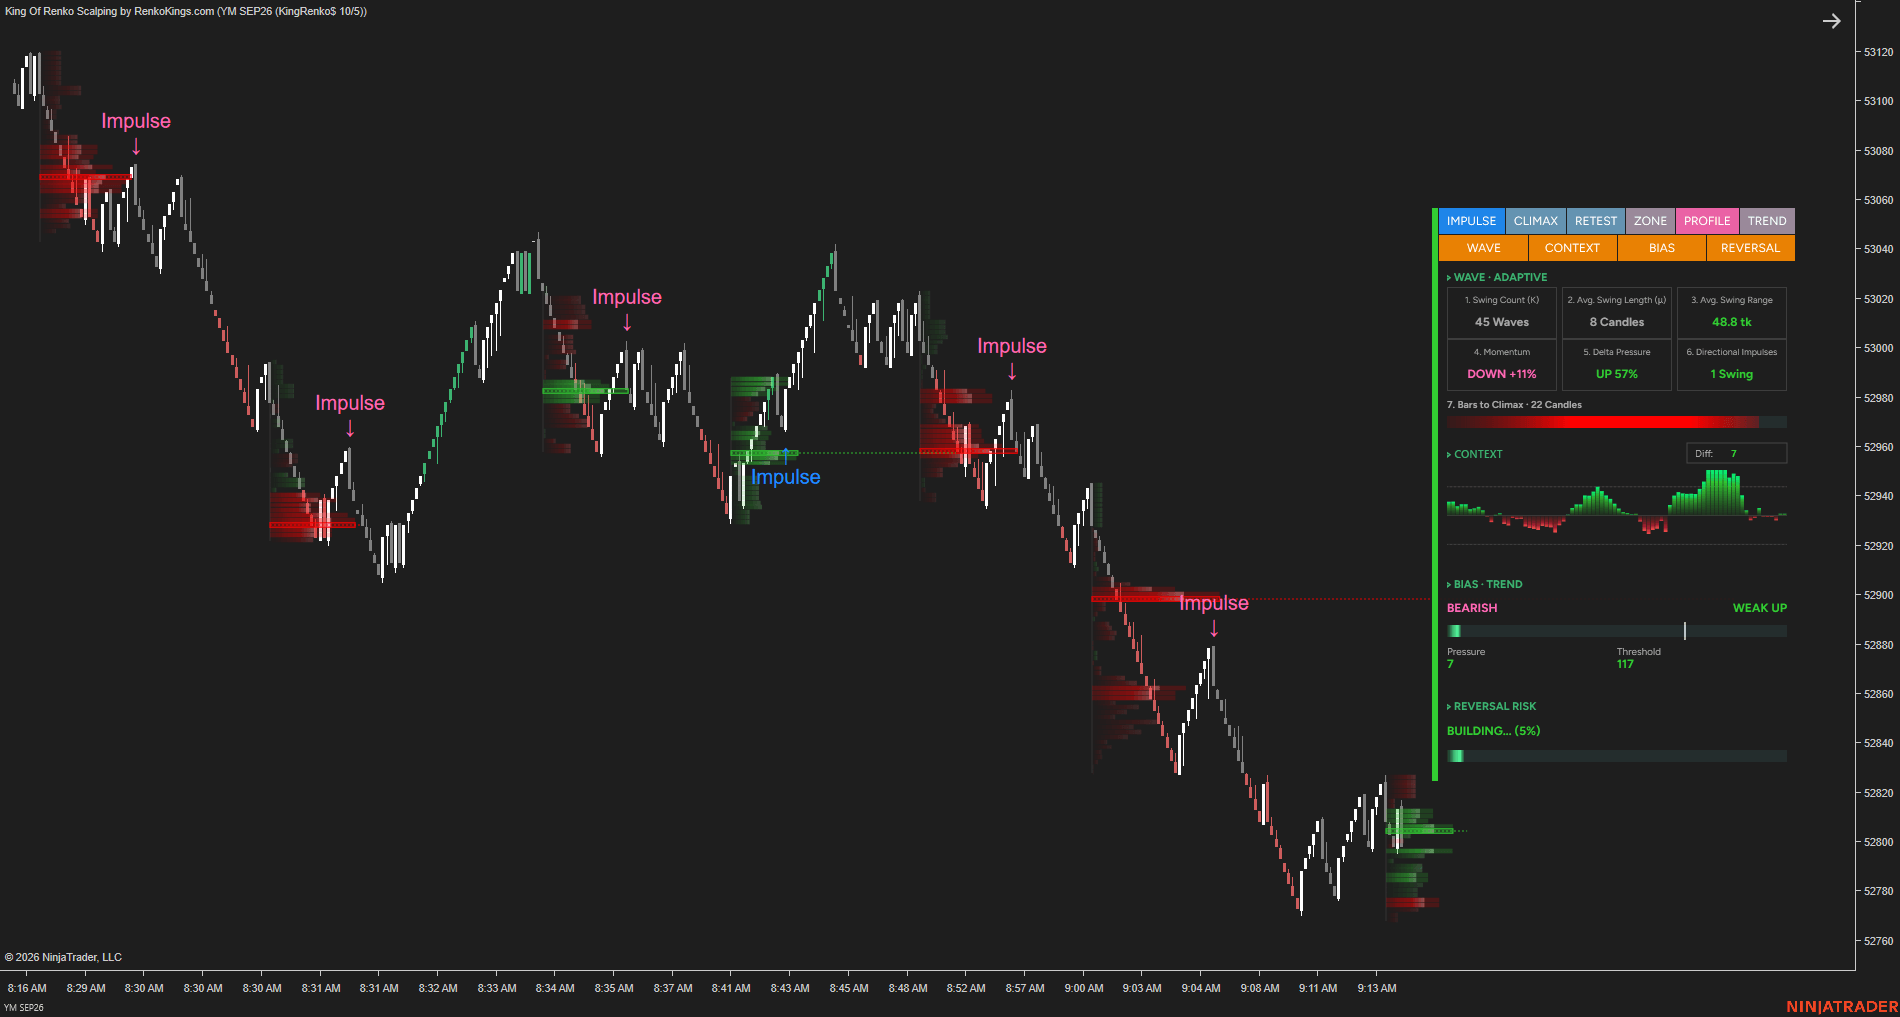
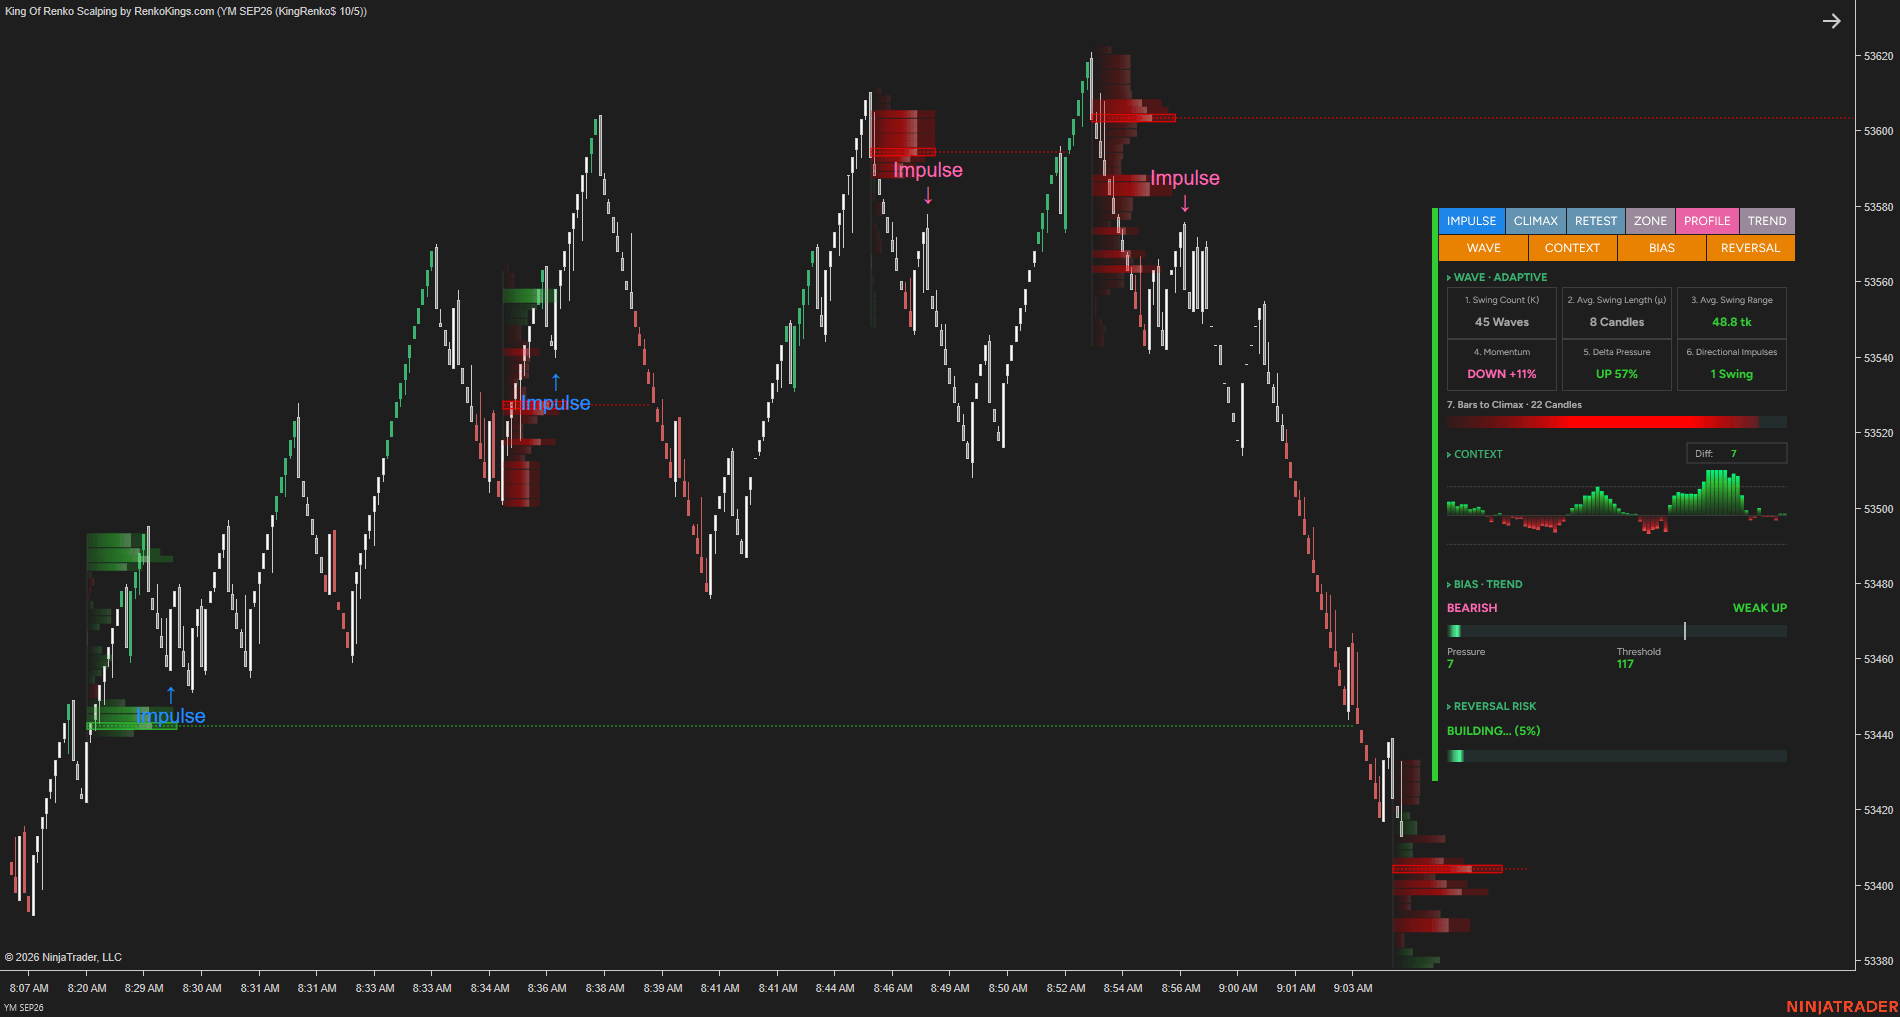
When an Up Wave or Down Wave expands beyond its normal range, directional pressure is taking control.
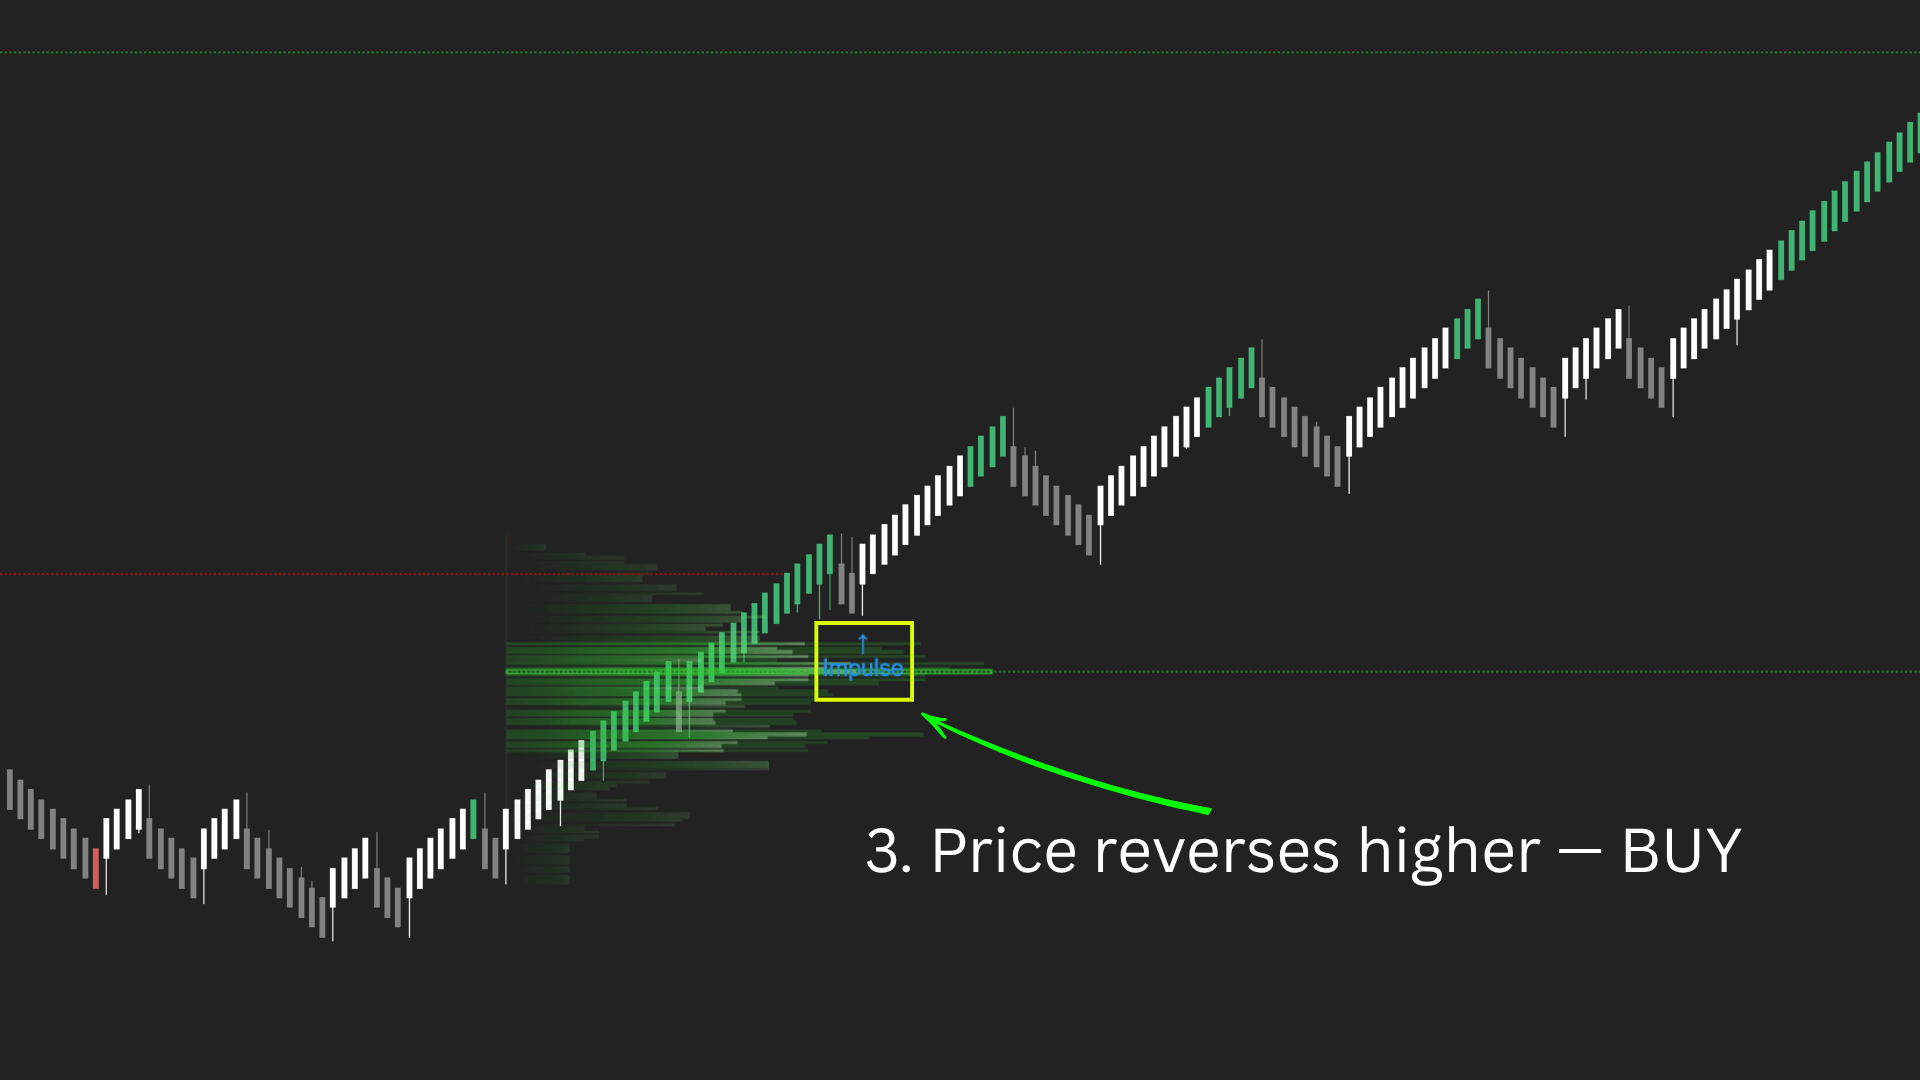
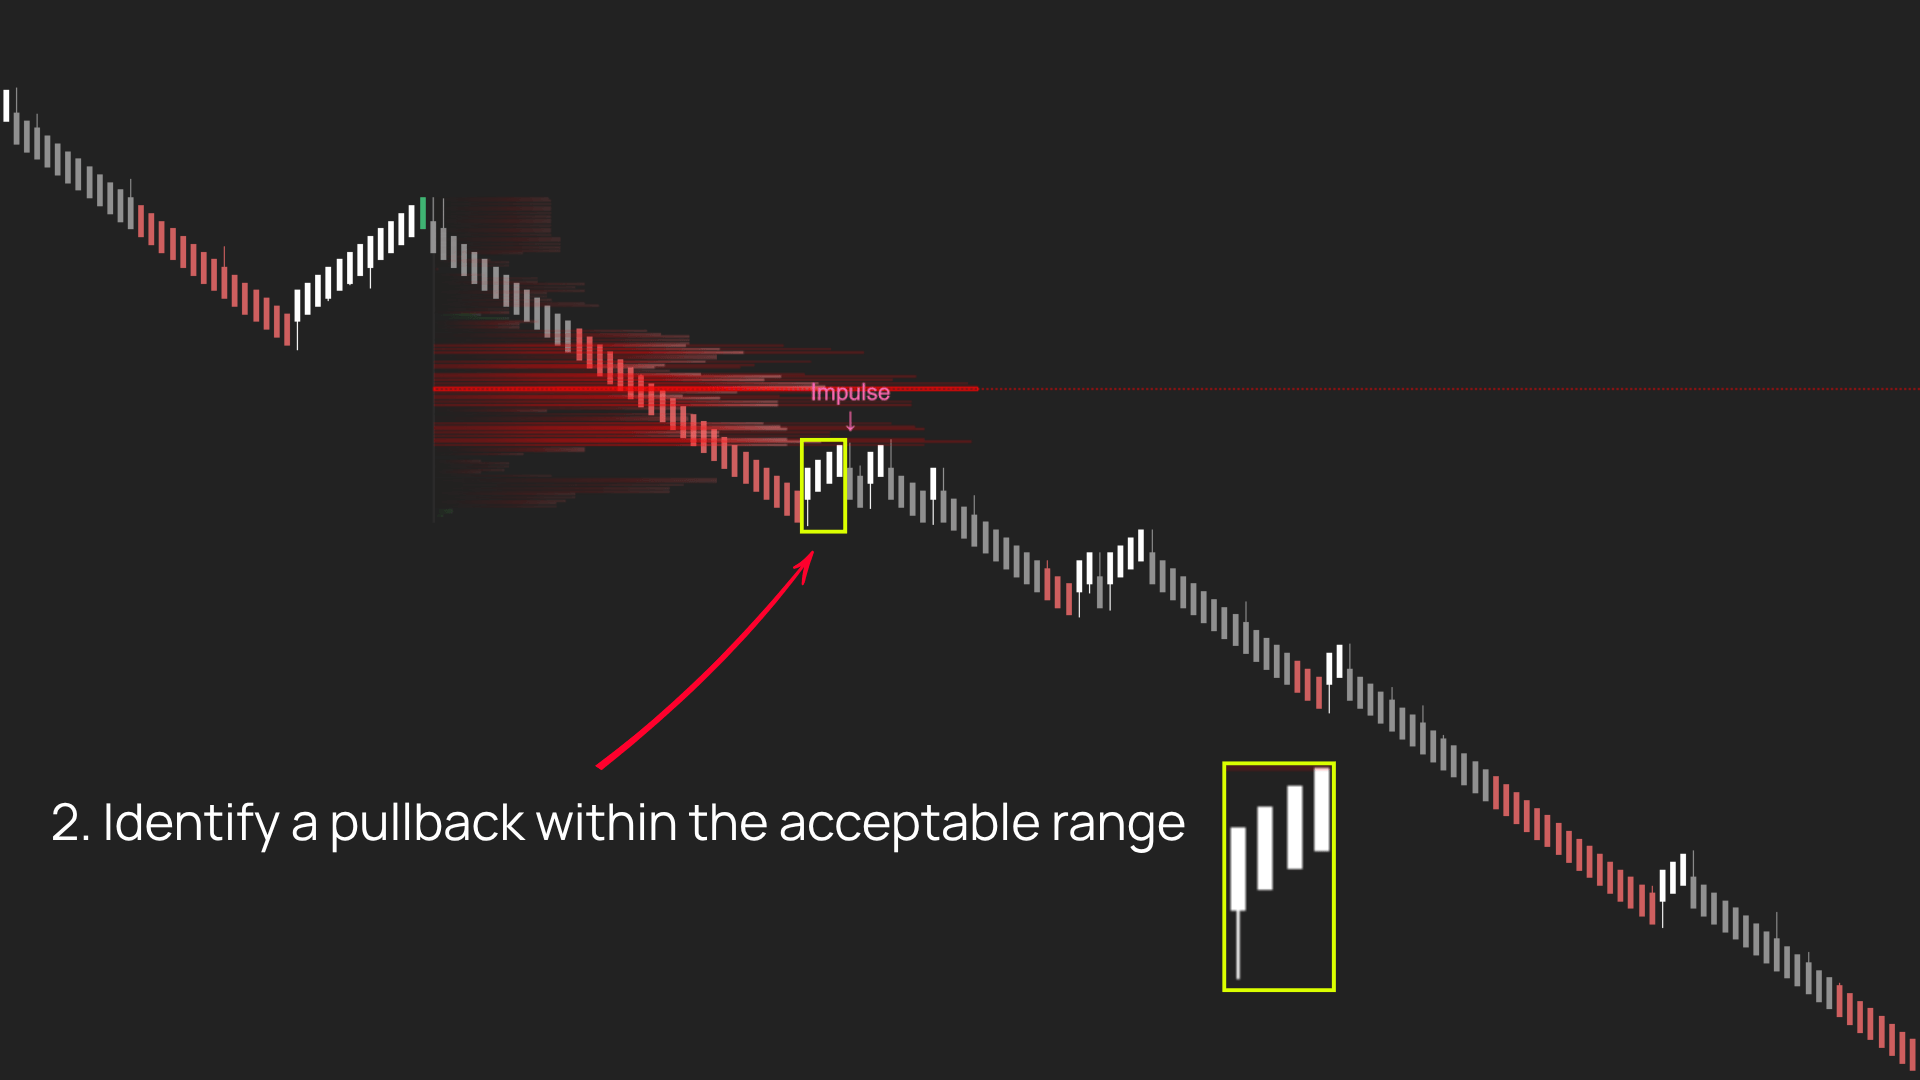
Poseidon Trident —E confirms directional strength, then looks for continuation after a short reset before generating an Impulse Signal.
We see Impulse Signal as a “Sniper Entry” — price often reacts quickly after the signal rather than requiring an extended period for the trade idea to develop.
Entering purely on expansion can mean joining a move after much of the movement has already happened.
Wait too long, however, and the continuation can be gone before the setup becomes obvious.
The opportunity is not the biggest bar. It’s the reset inside the move.
02 / CLIMAX
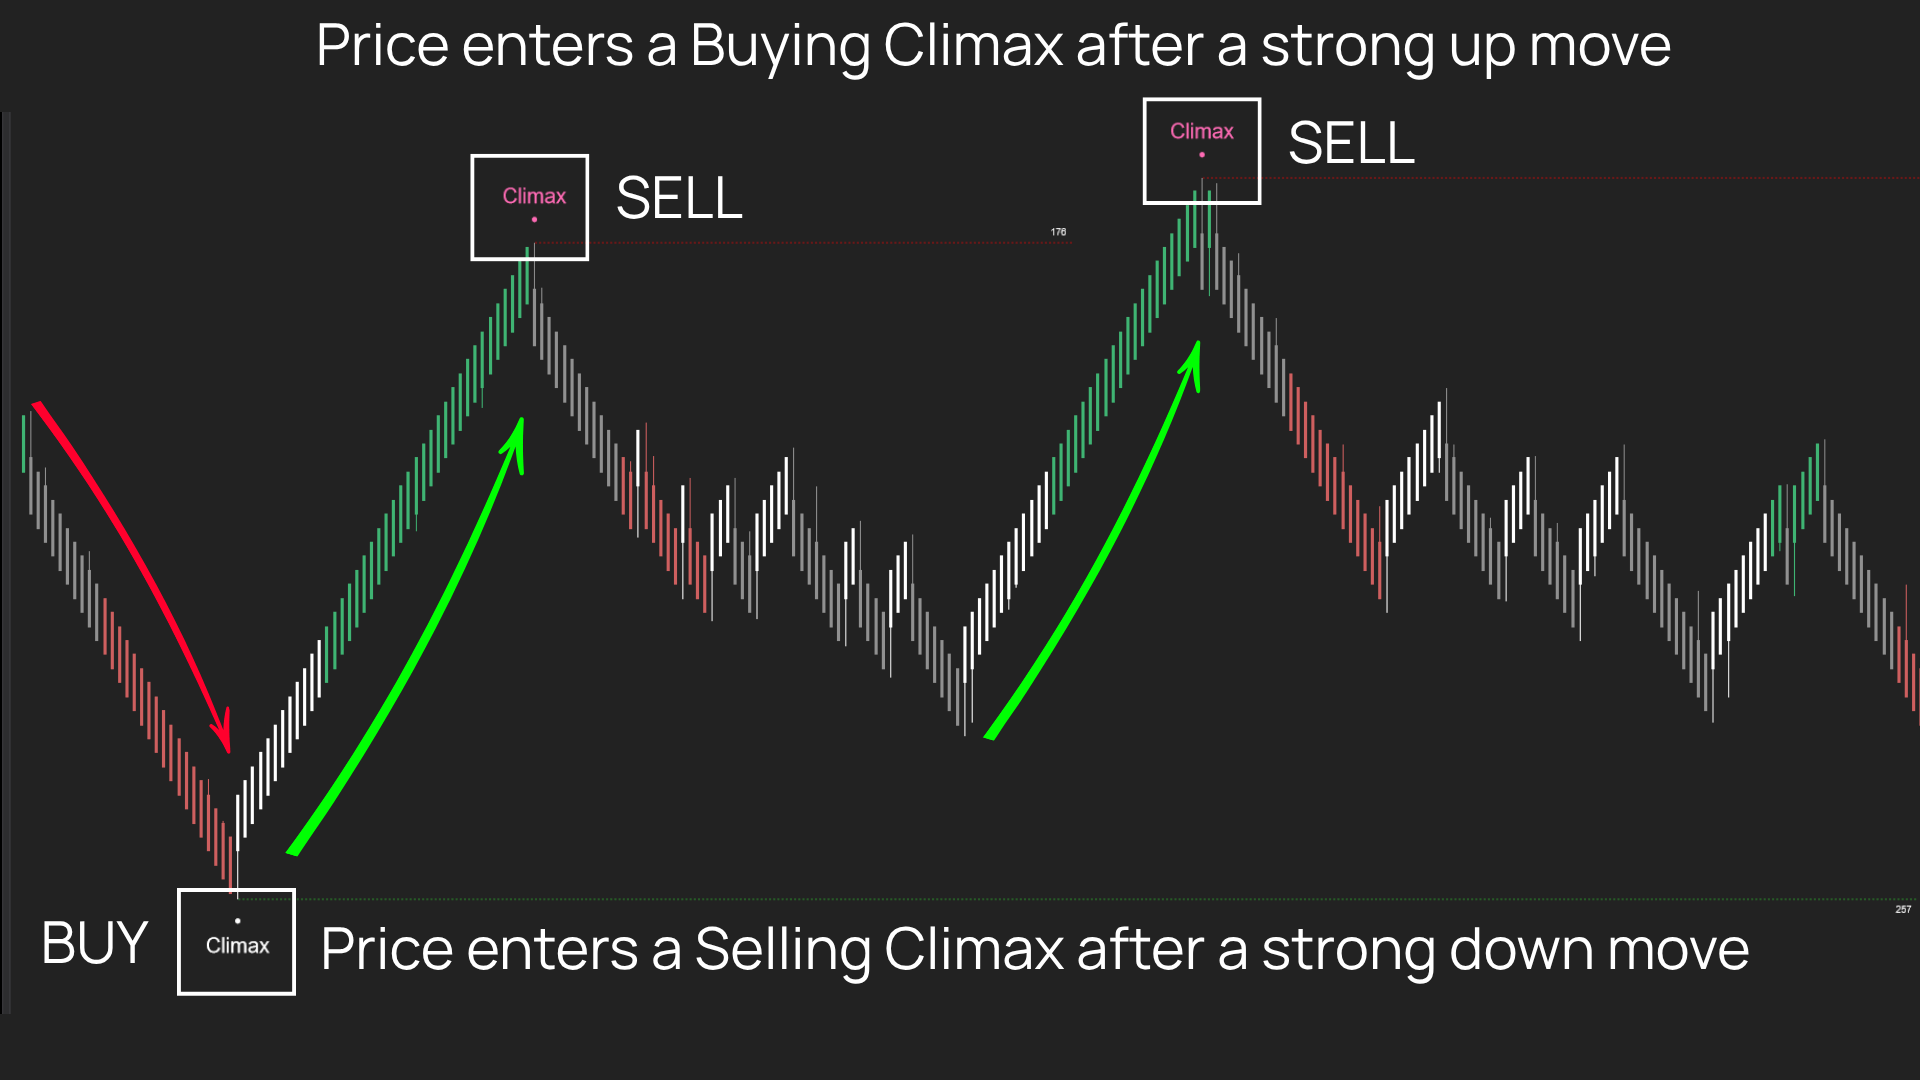
Strength can create an opportunity. But too much strength can change the opportunity entirely.
As a Wave extends far beyond its normal range, the risk of joining the move changes.
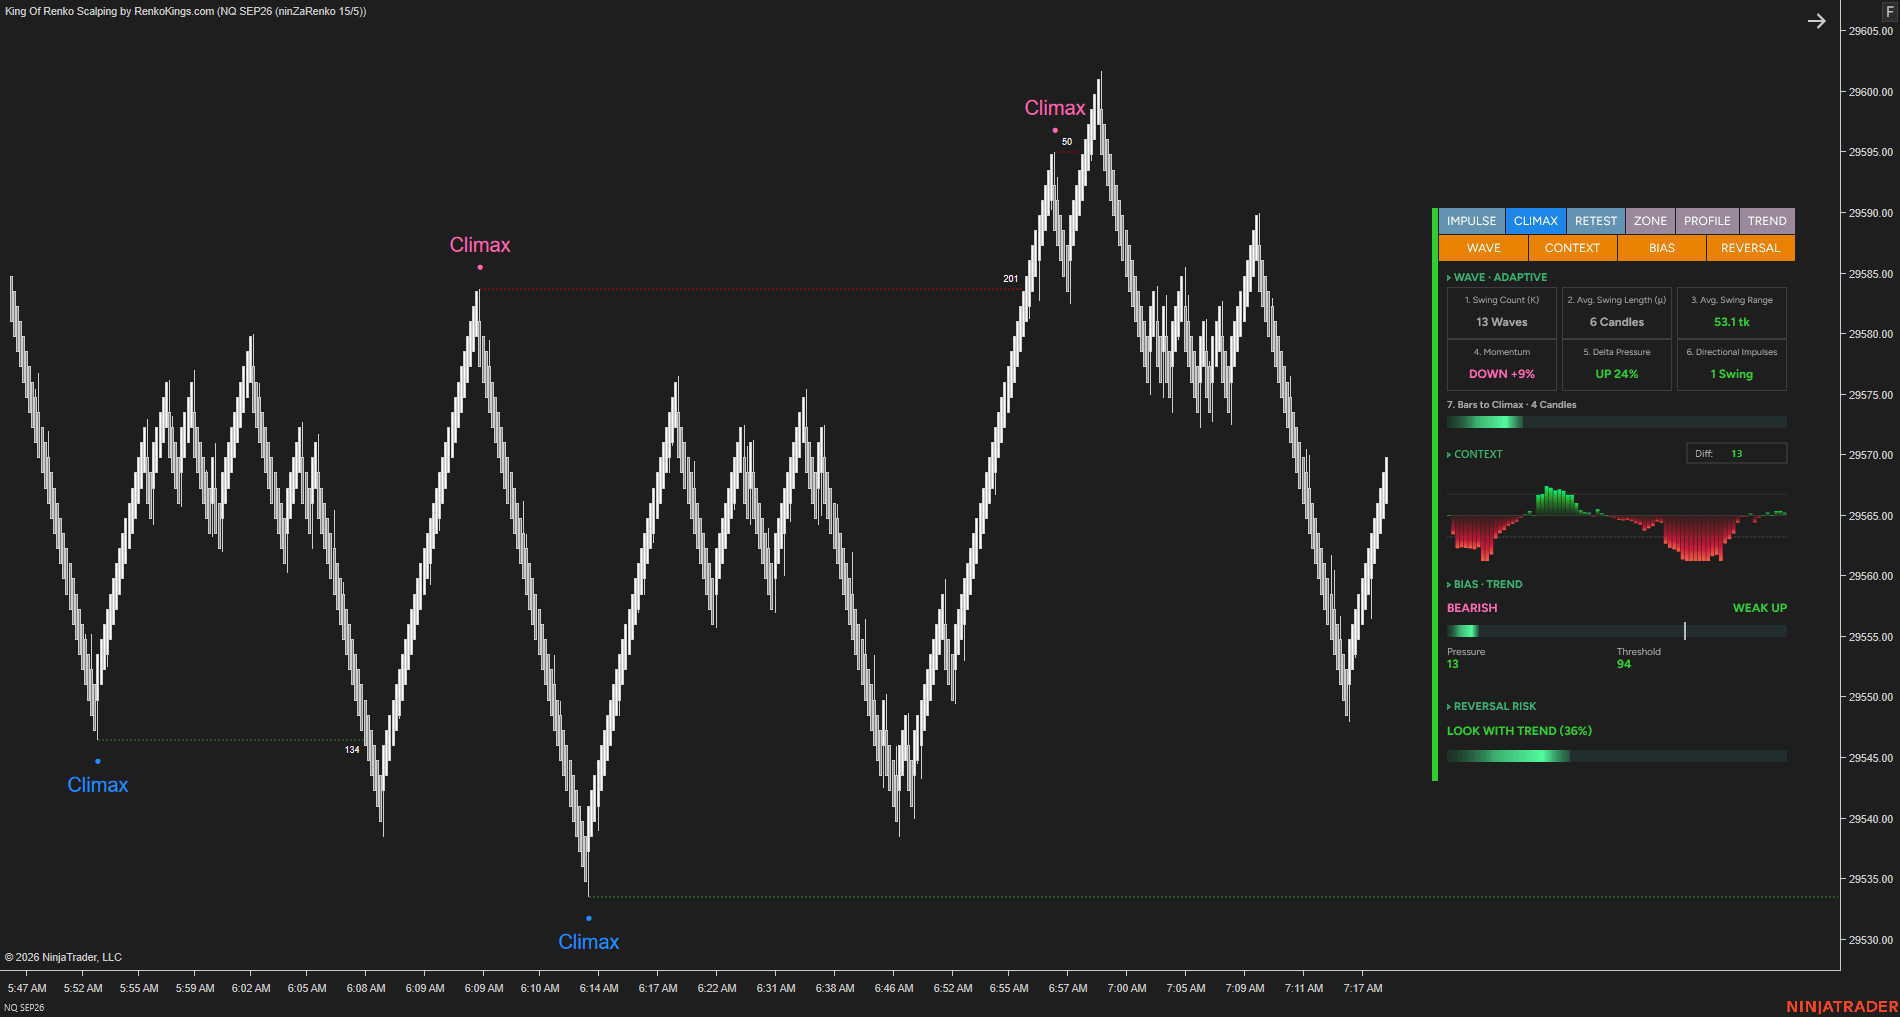
Poseidon Trident —E measures that extension against recent Wave behavior and looks for a reaction before generating a Climax Signal.
This is different from simply deciding that price looks “too high” or “too low” or relying on overbought/oversold conditions.
Without an objective benchmark for how far the current Wave has extended, it is easy to treat price as “too high” and attempt a reversal too early:
Sell → Stop → Sell again → Stop → Sell again—and finally catch the reversal.
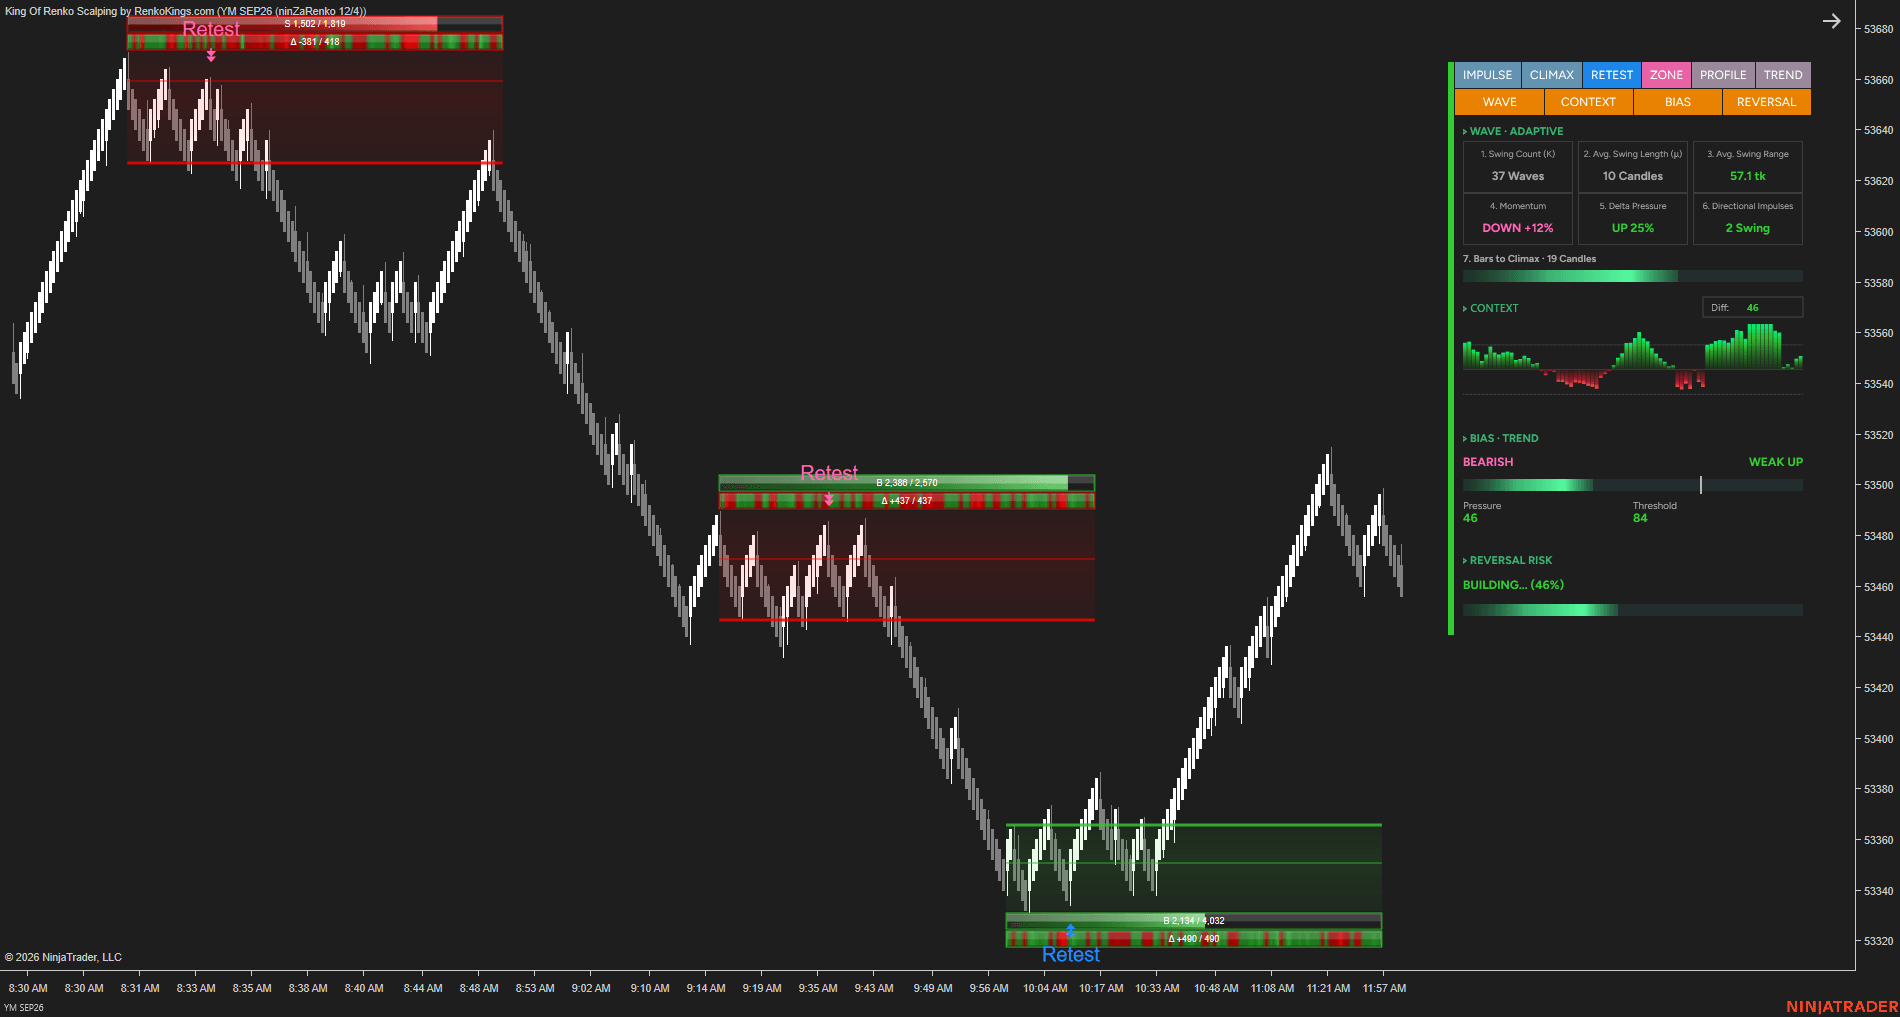
03 / RETEST
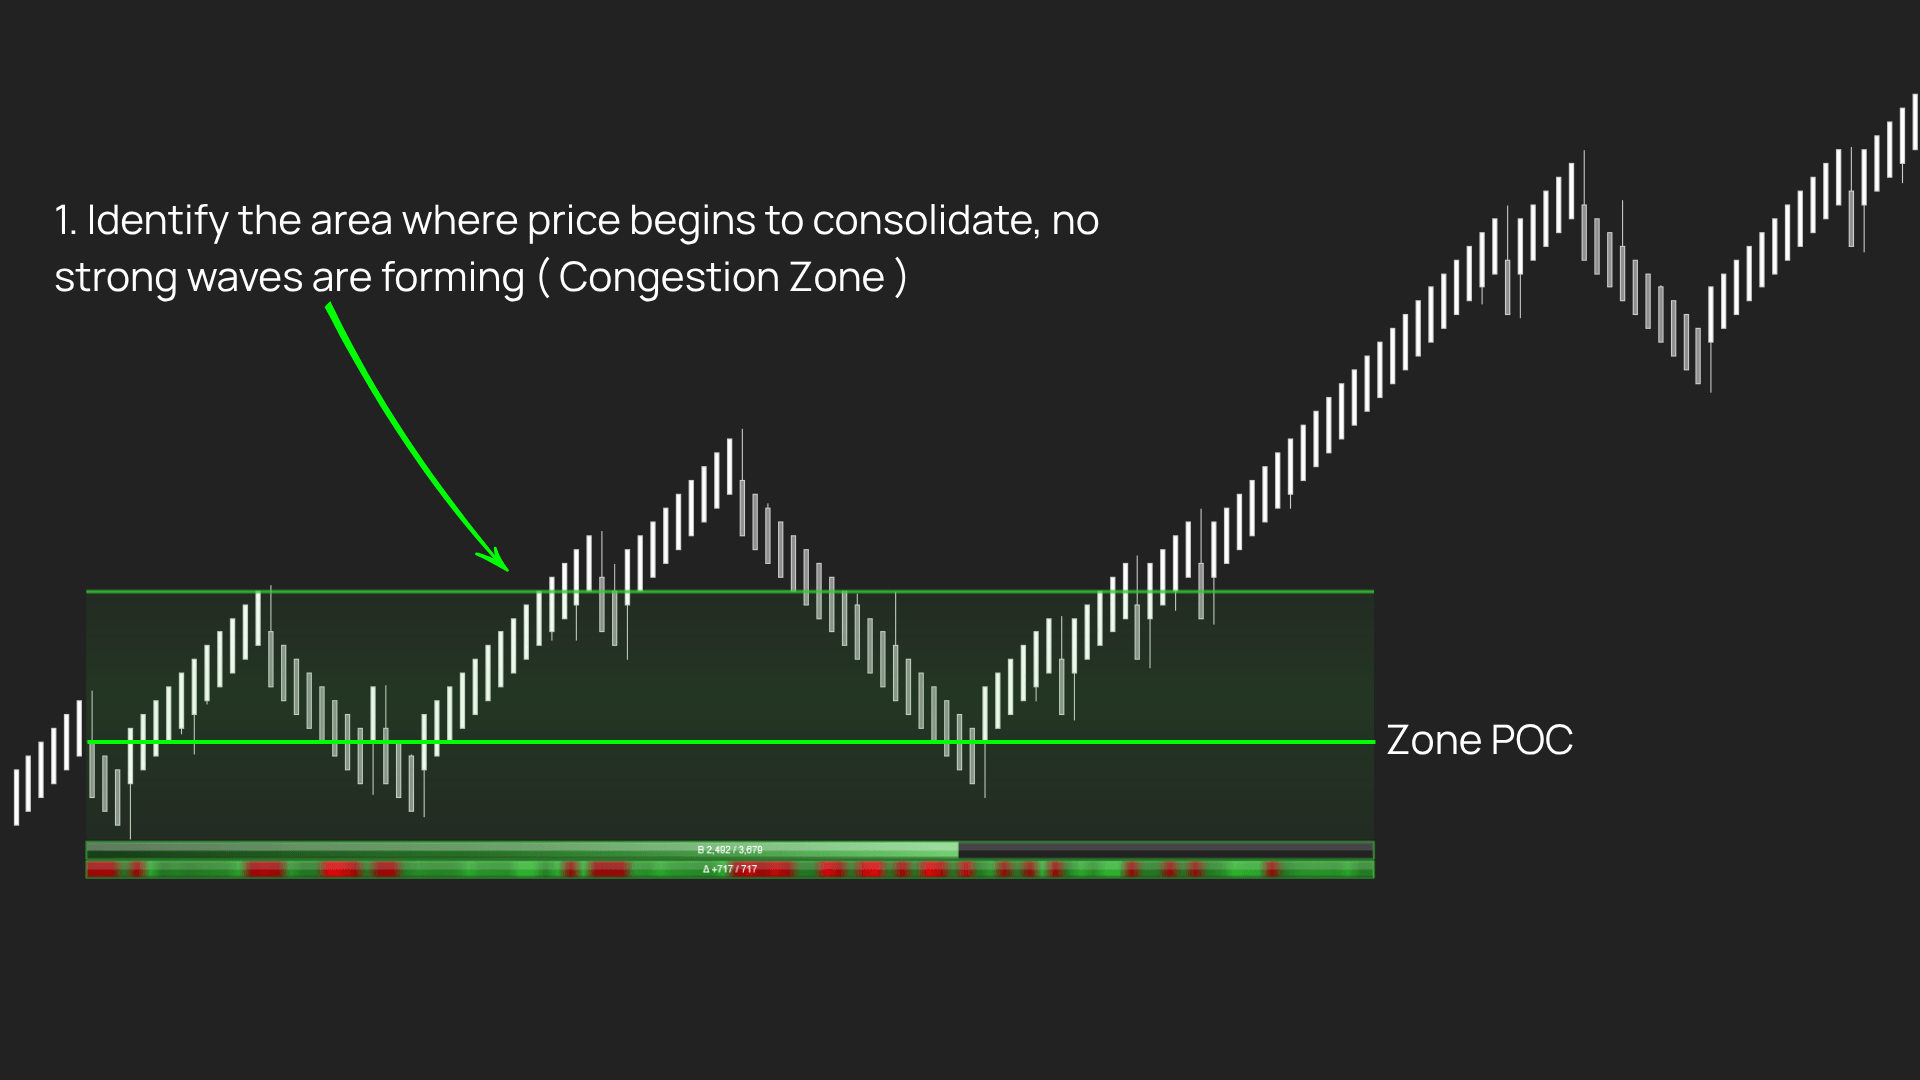
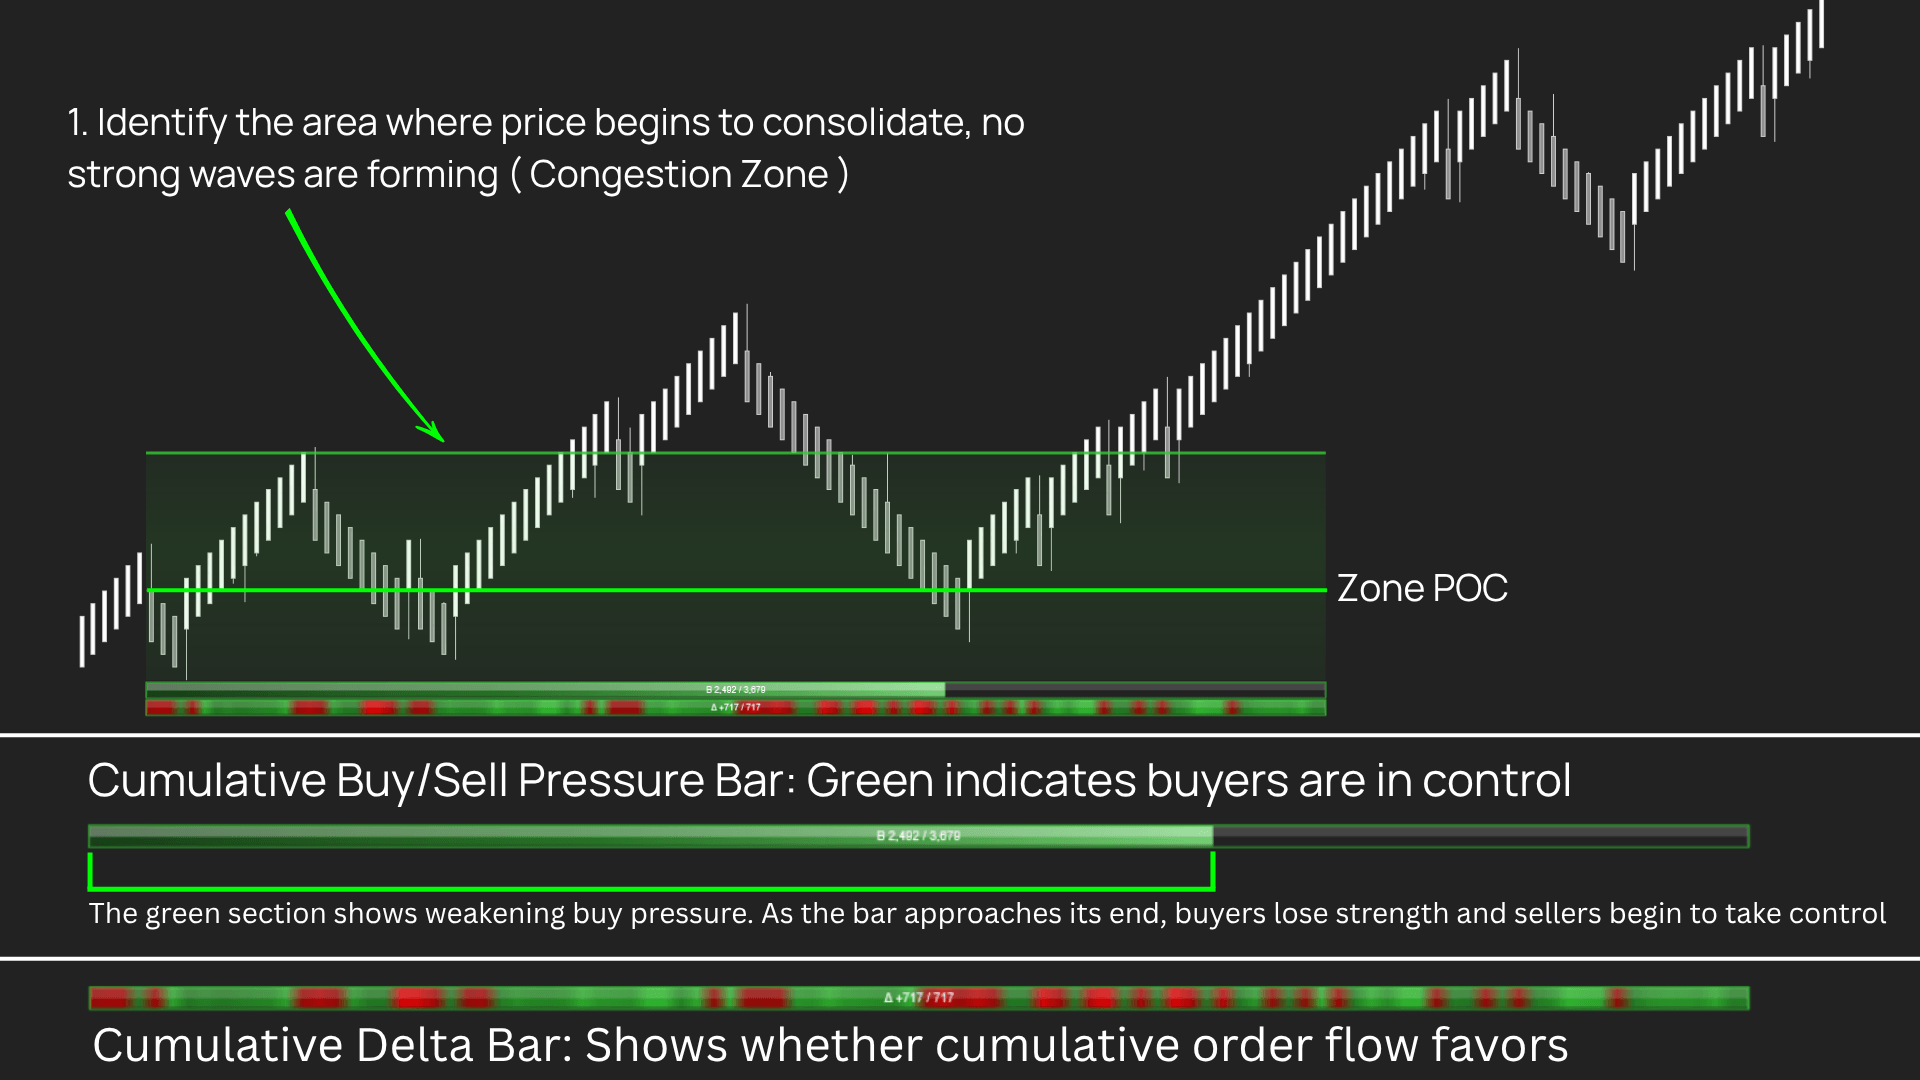
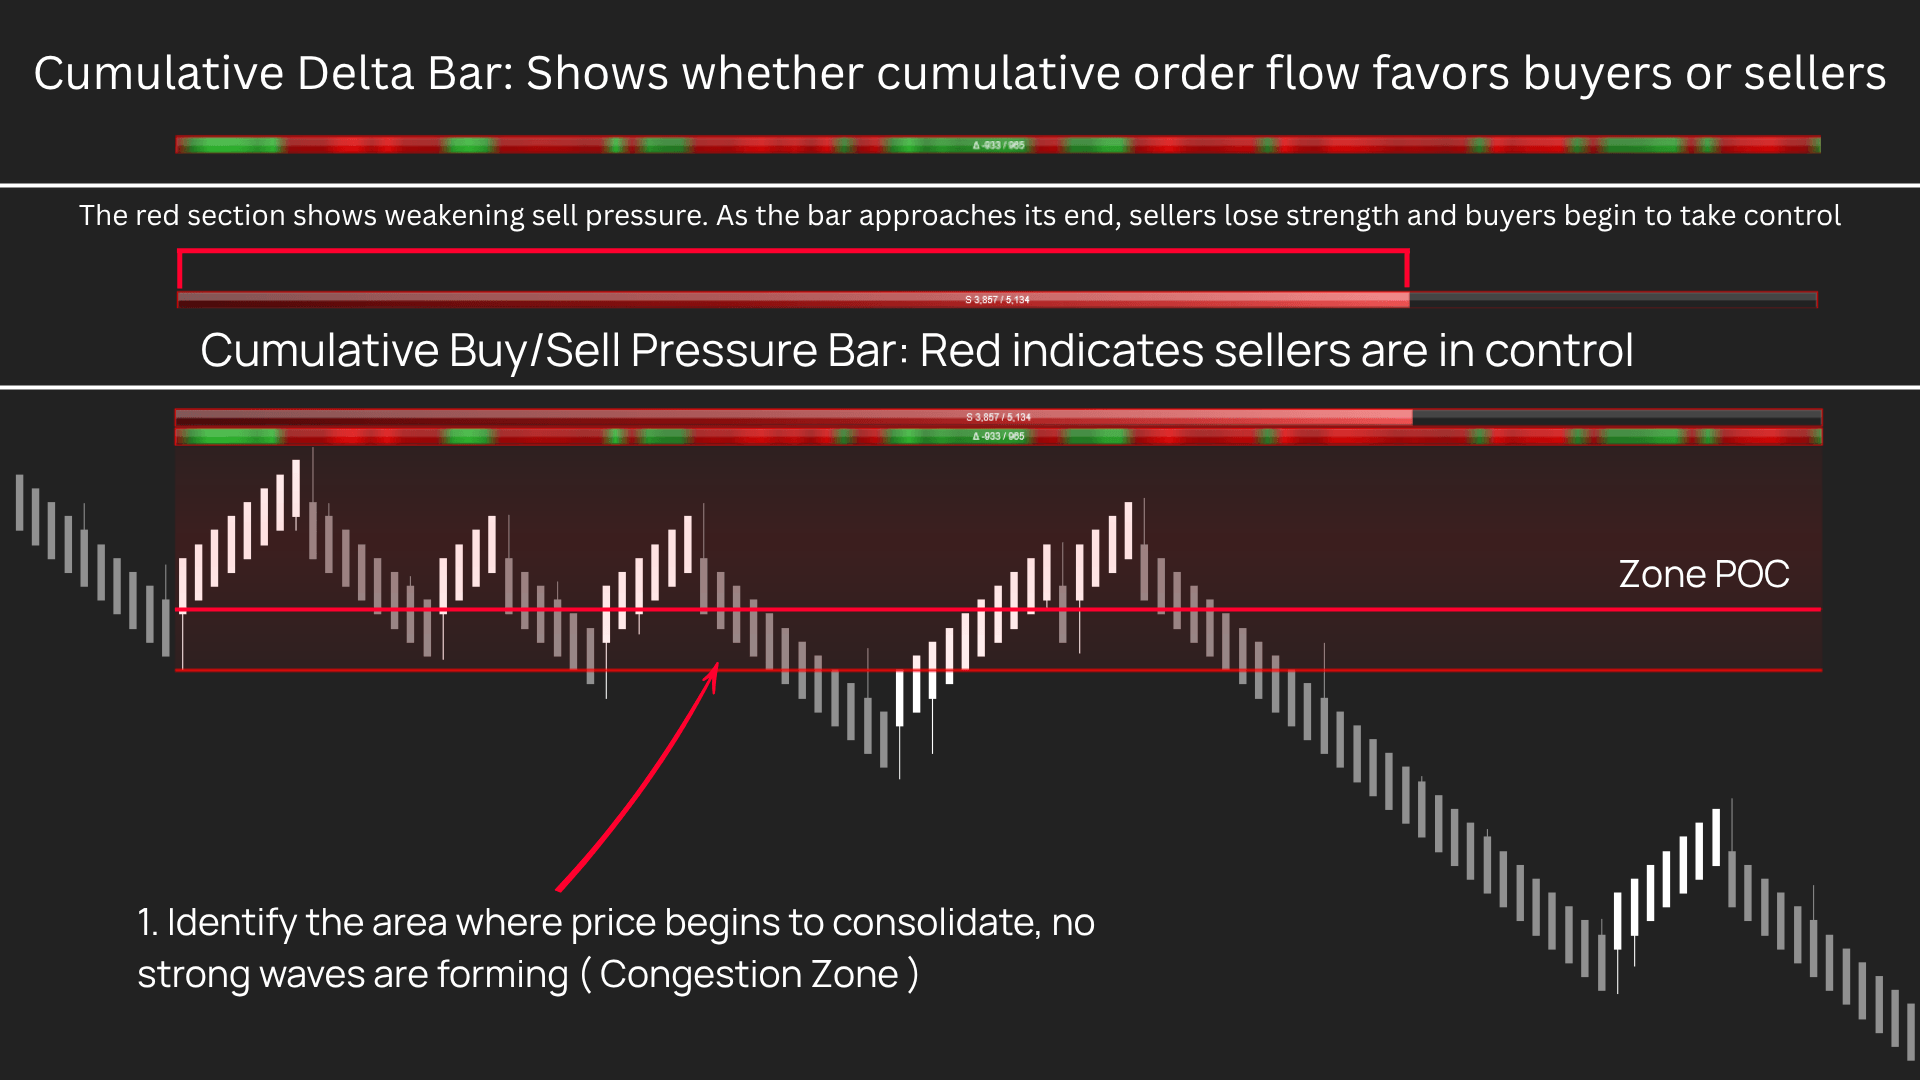
When Up Waves and Down Waves repeatedly remain short, neither side is moving price very far.
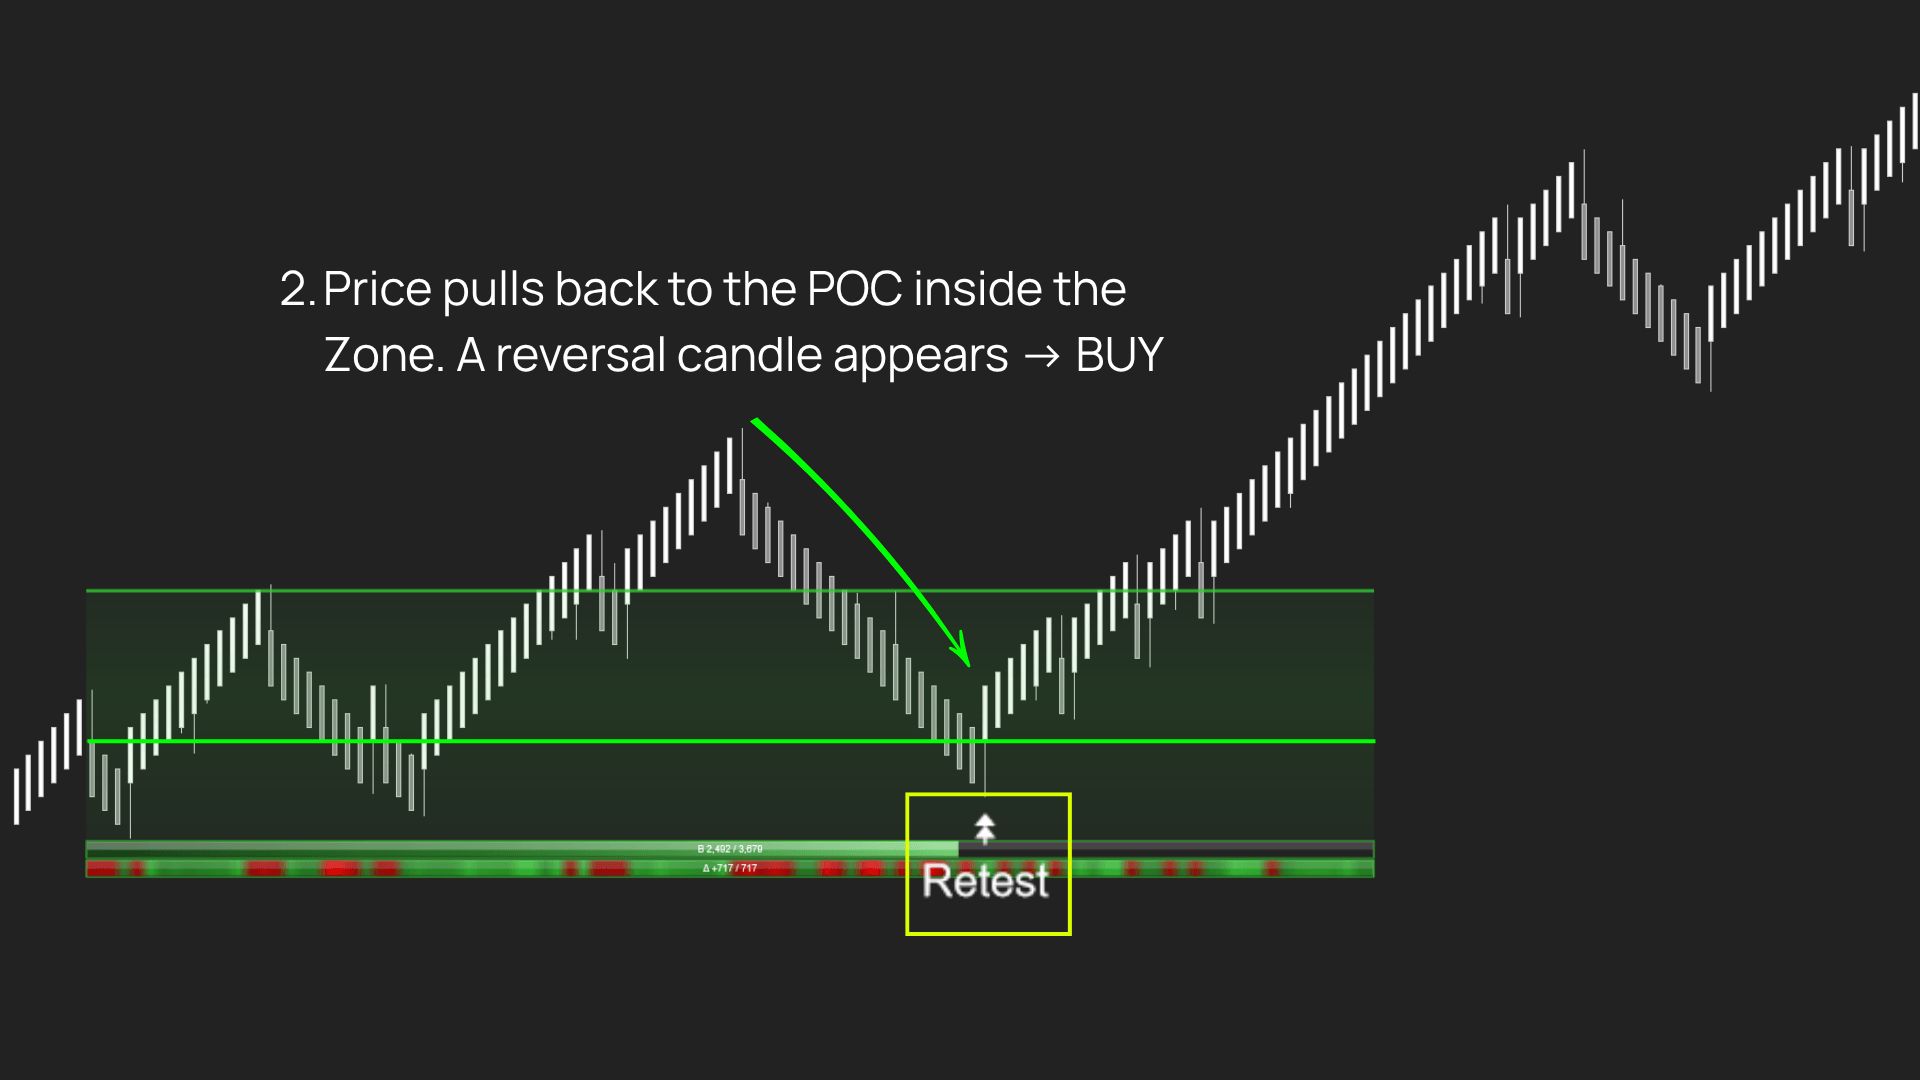
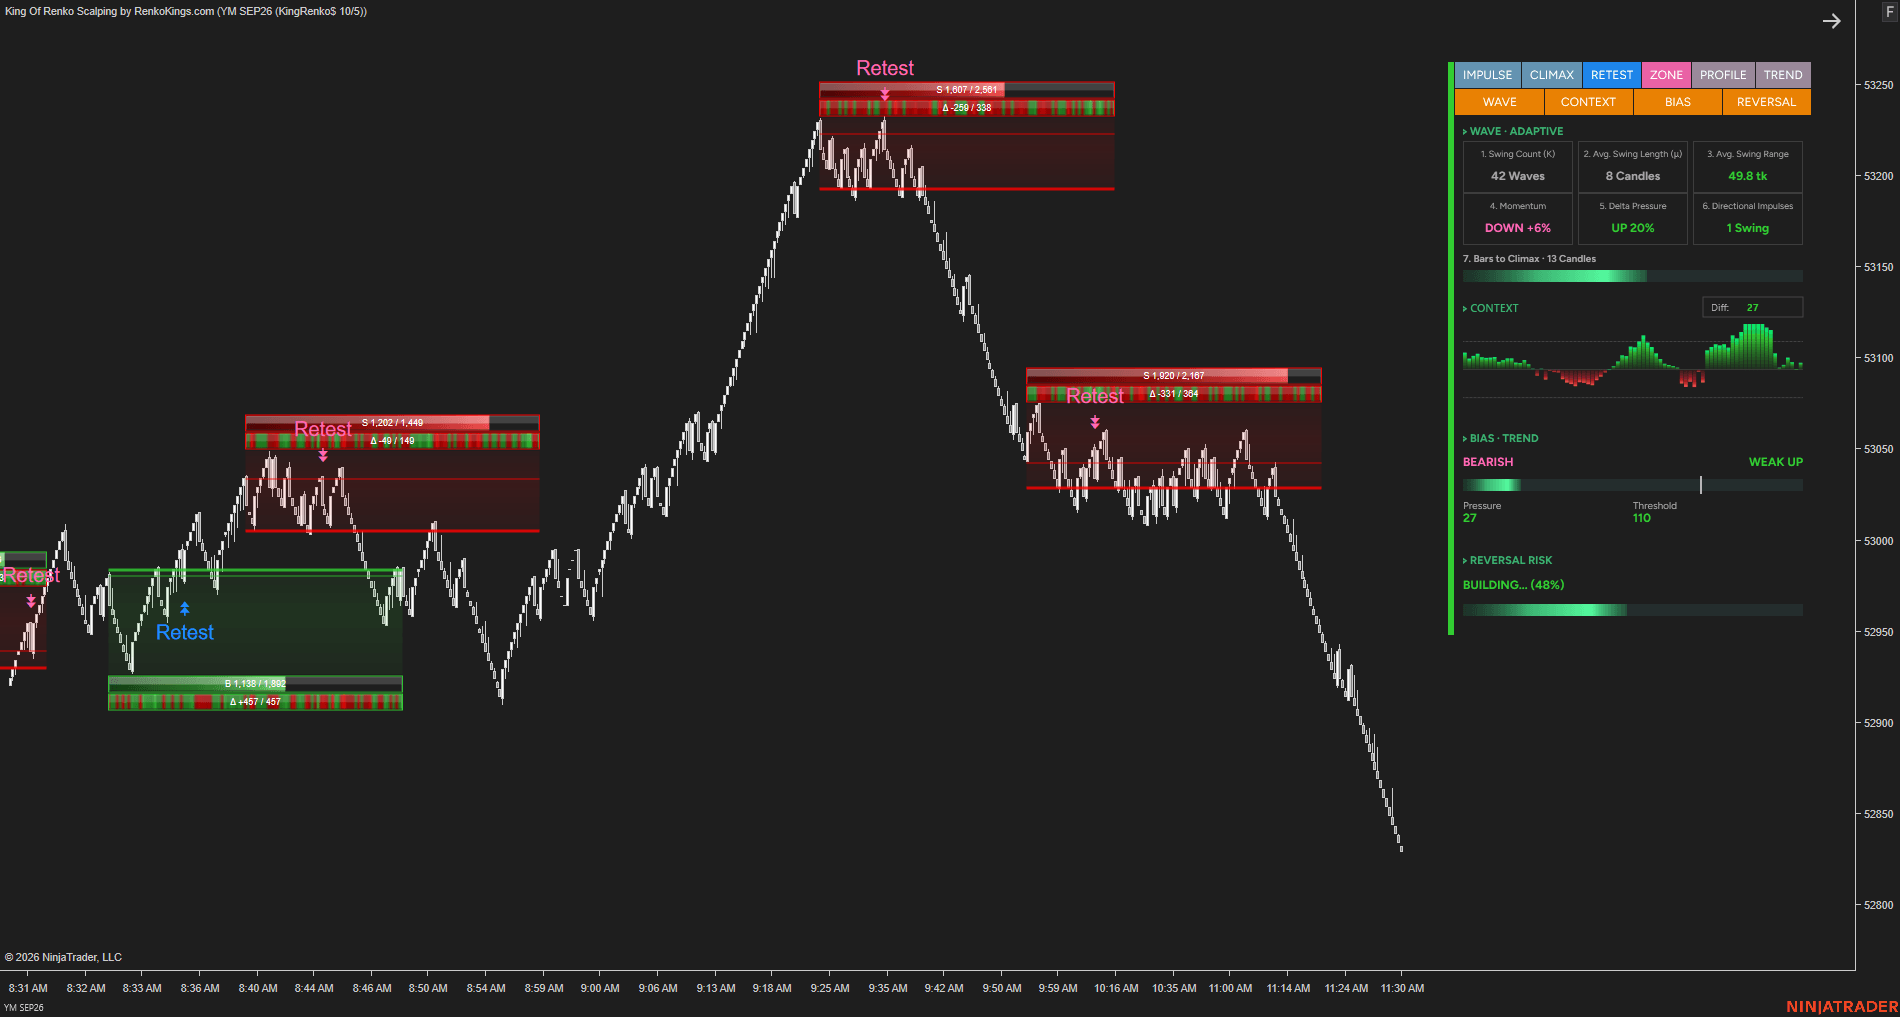
The market begins to compress into an Accumulation Zone.
These areas may not look attractive to trade at first. But once price breaks out, the same zone can become a meaningful reference for the next move.
The initial breakout, however, is not always the best place to act.
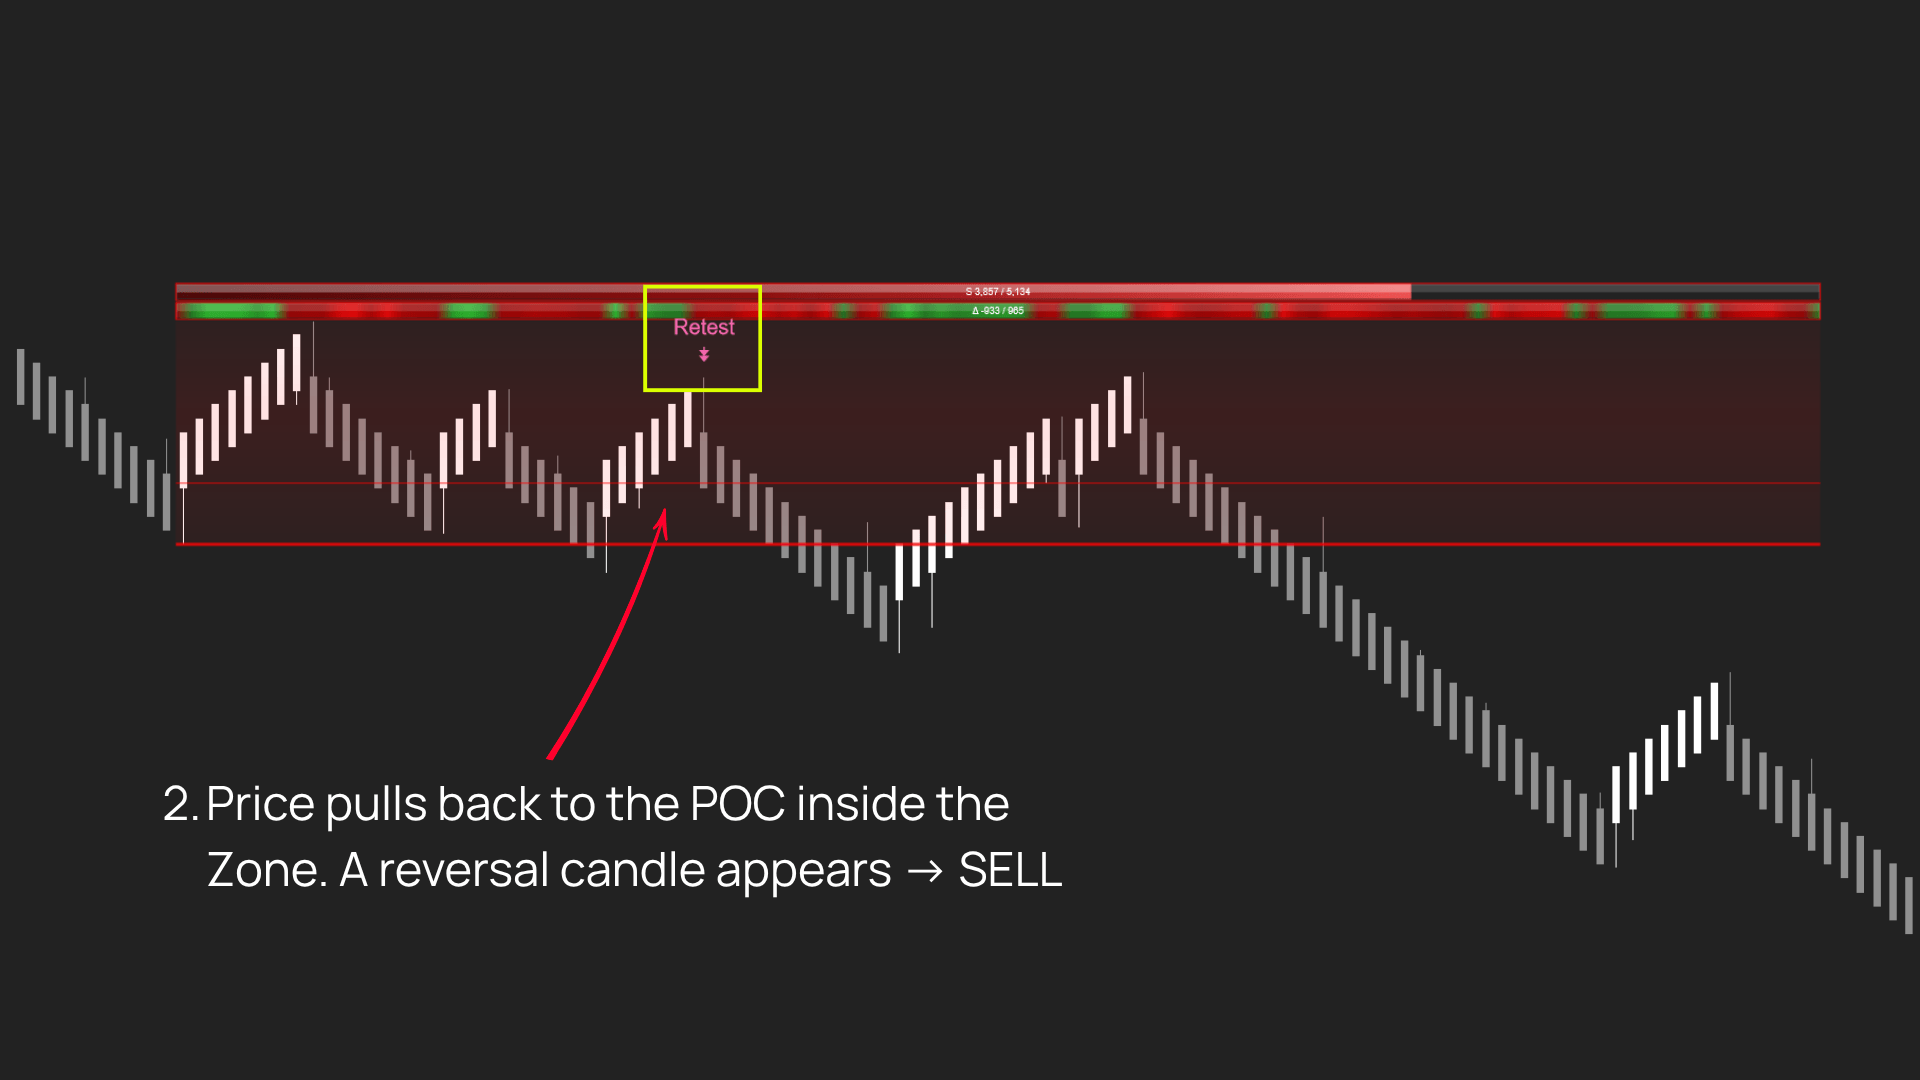
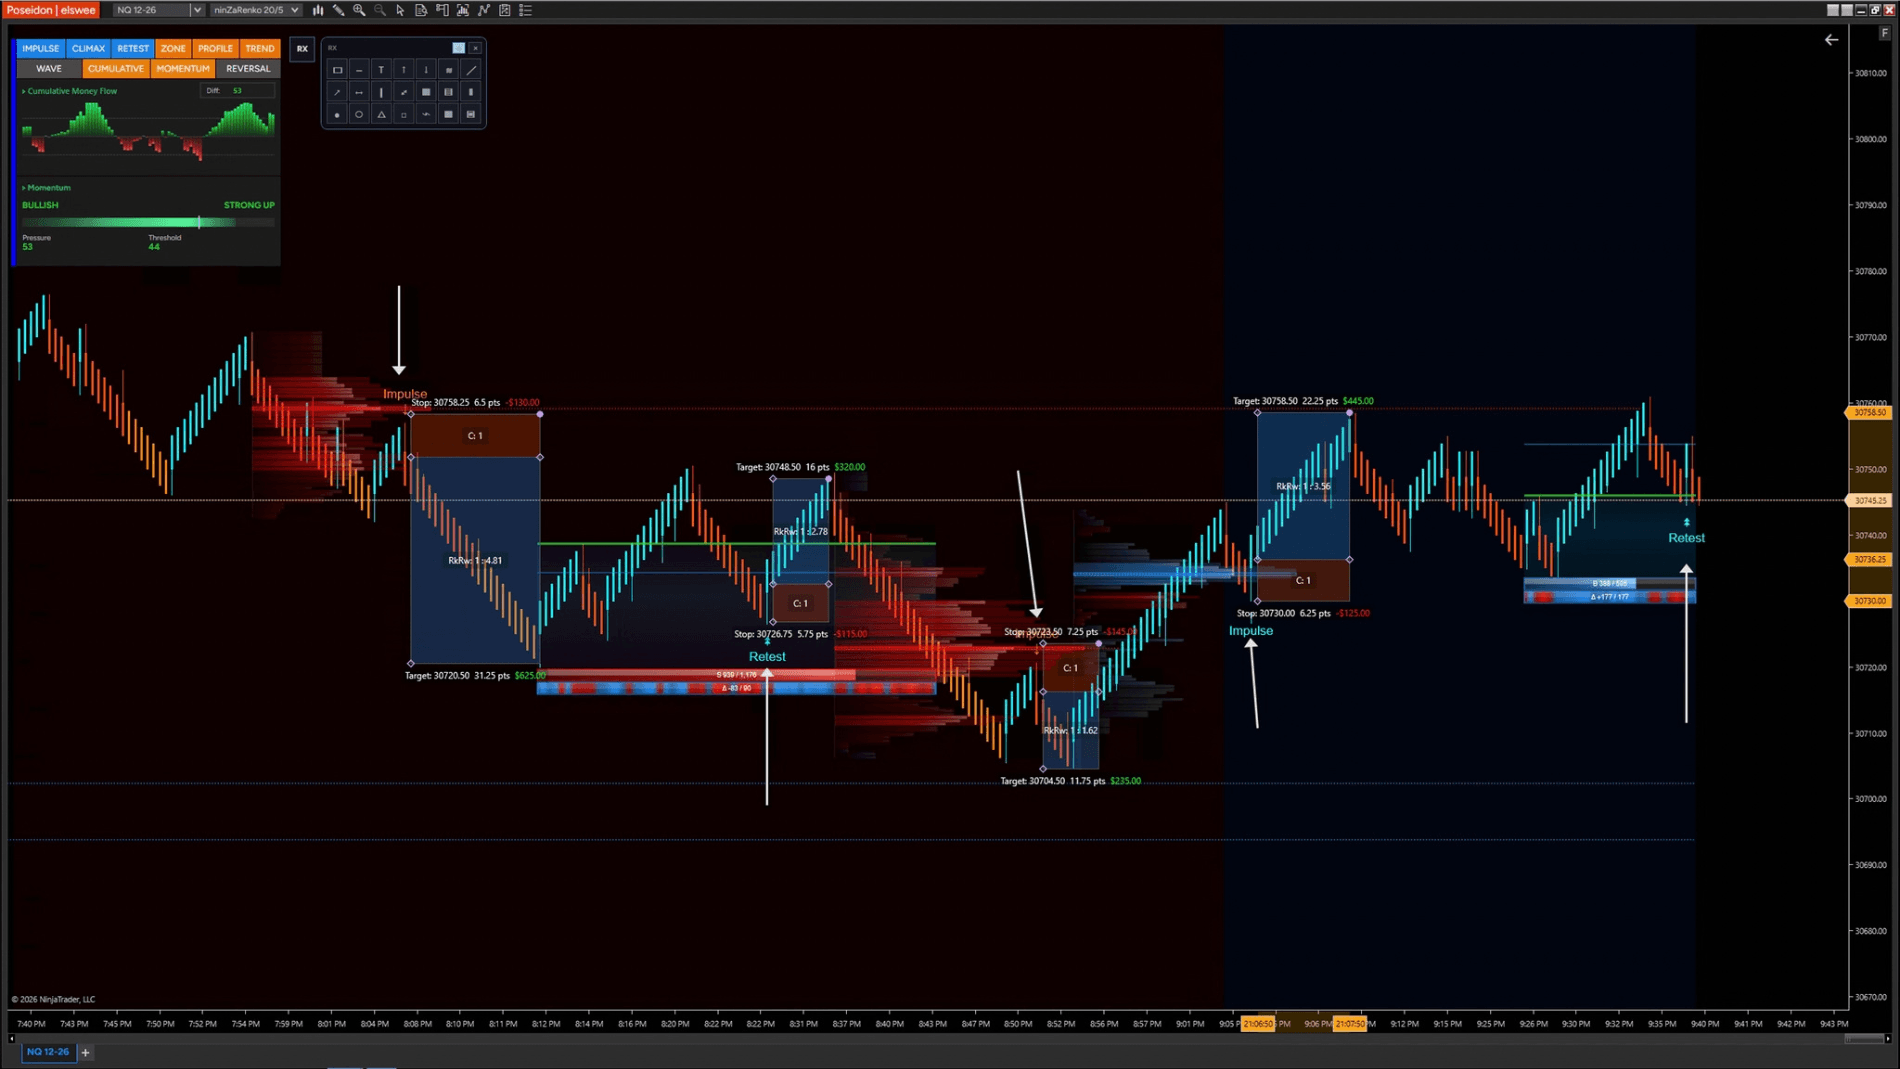
Poseidon Trident —E waits for price to break away, then return to the area that previously contained the market. If price reacts in the direction of the breakout Retest Signal identifies the opportunity.
The breakout gives you direction. The retest gives you a place to act on it.
05 / WAVE DASHBOARD
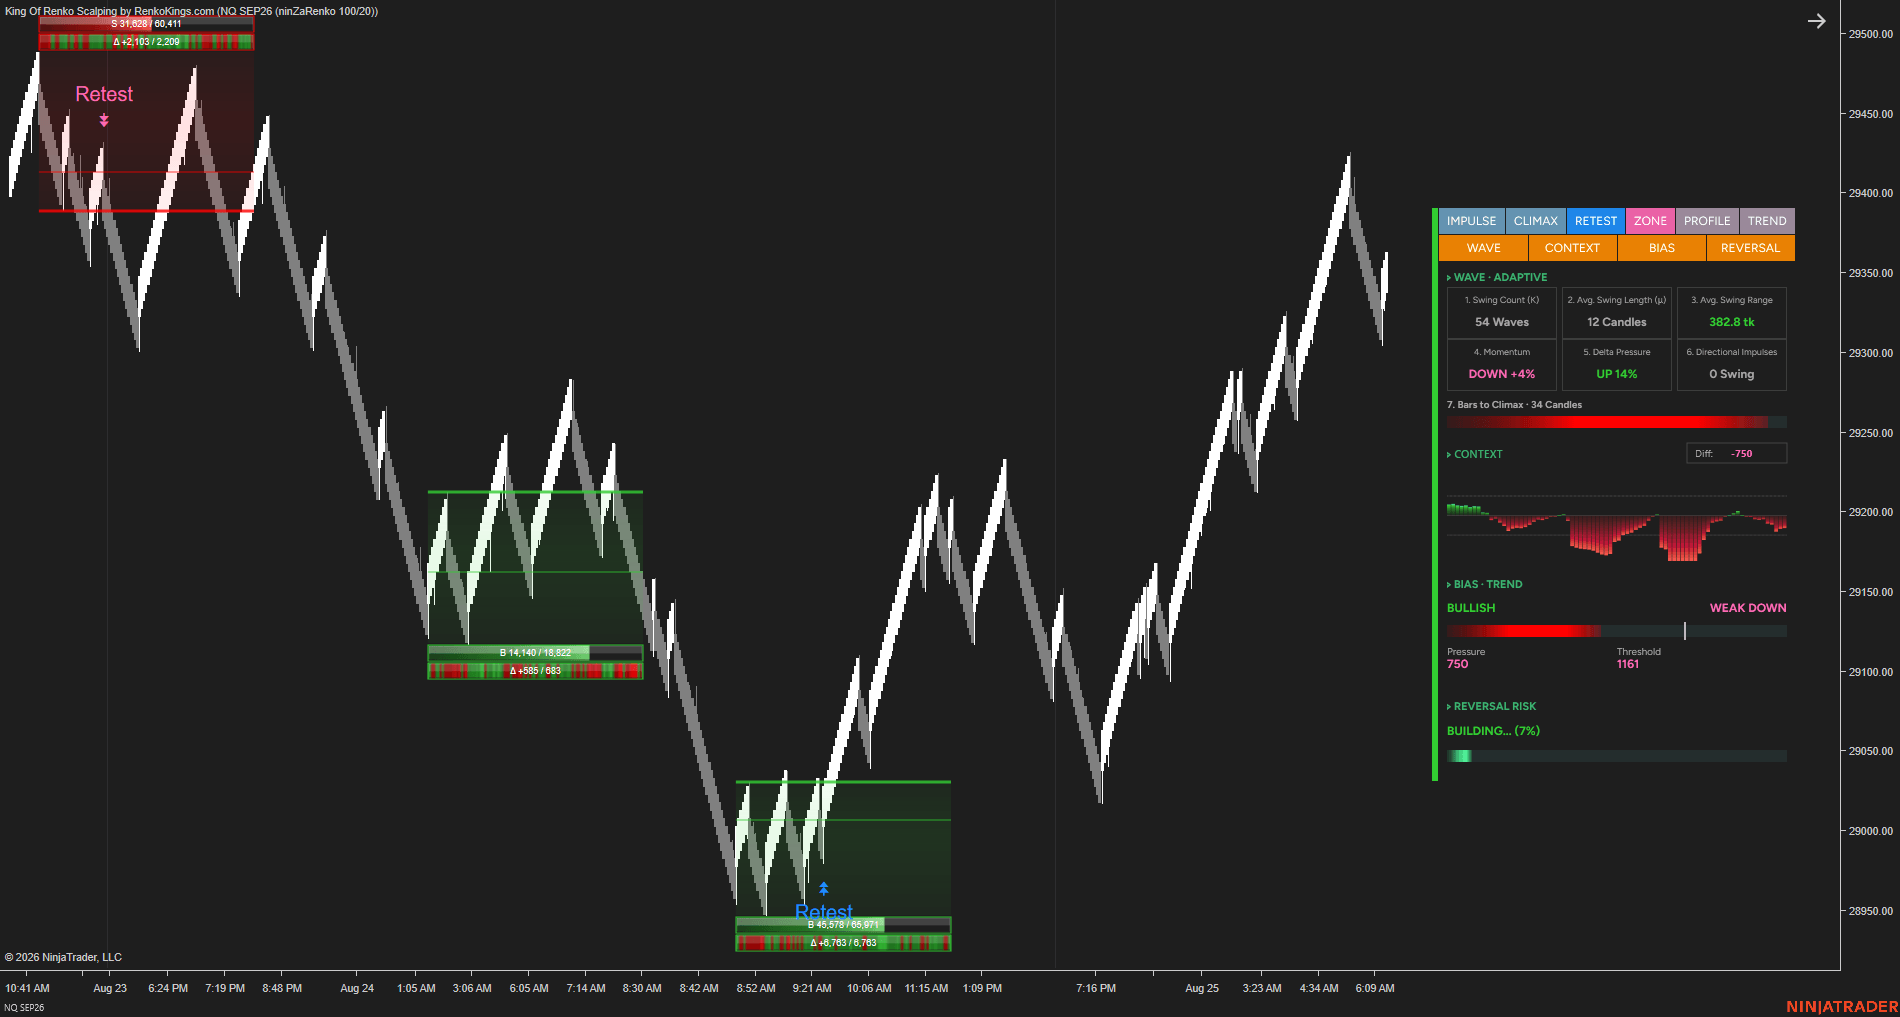
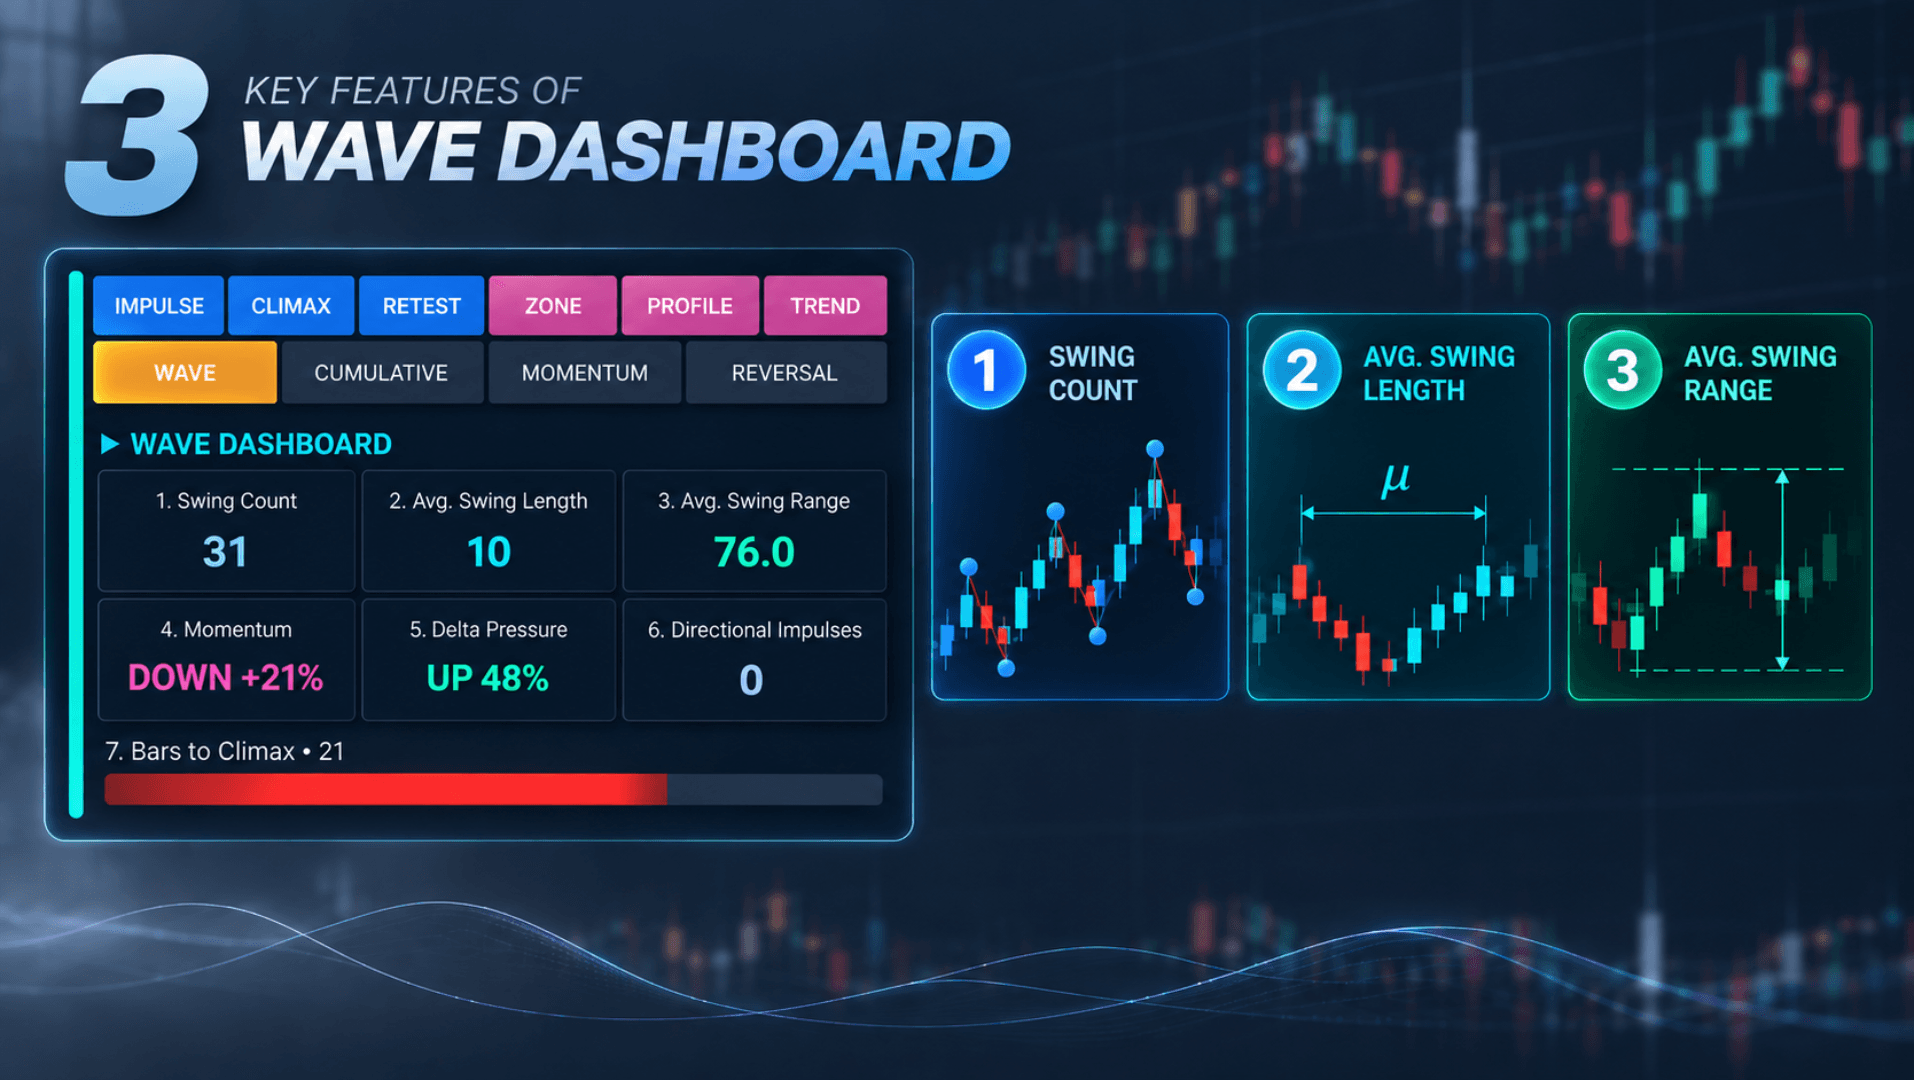
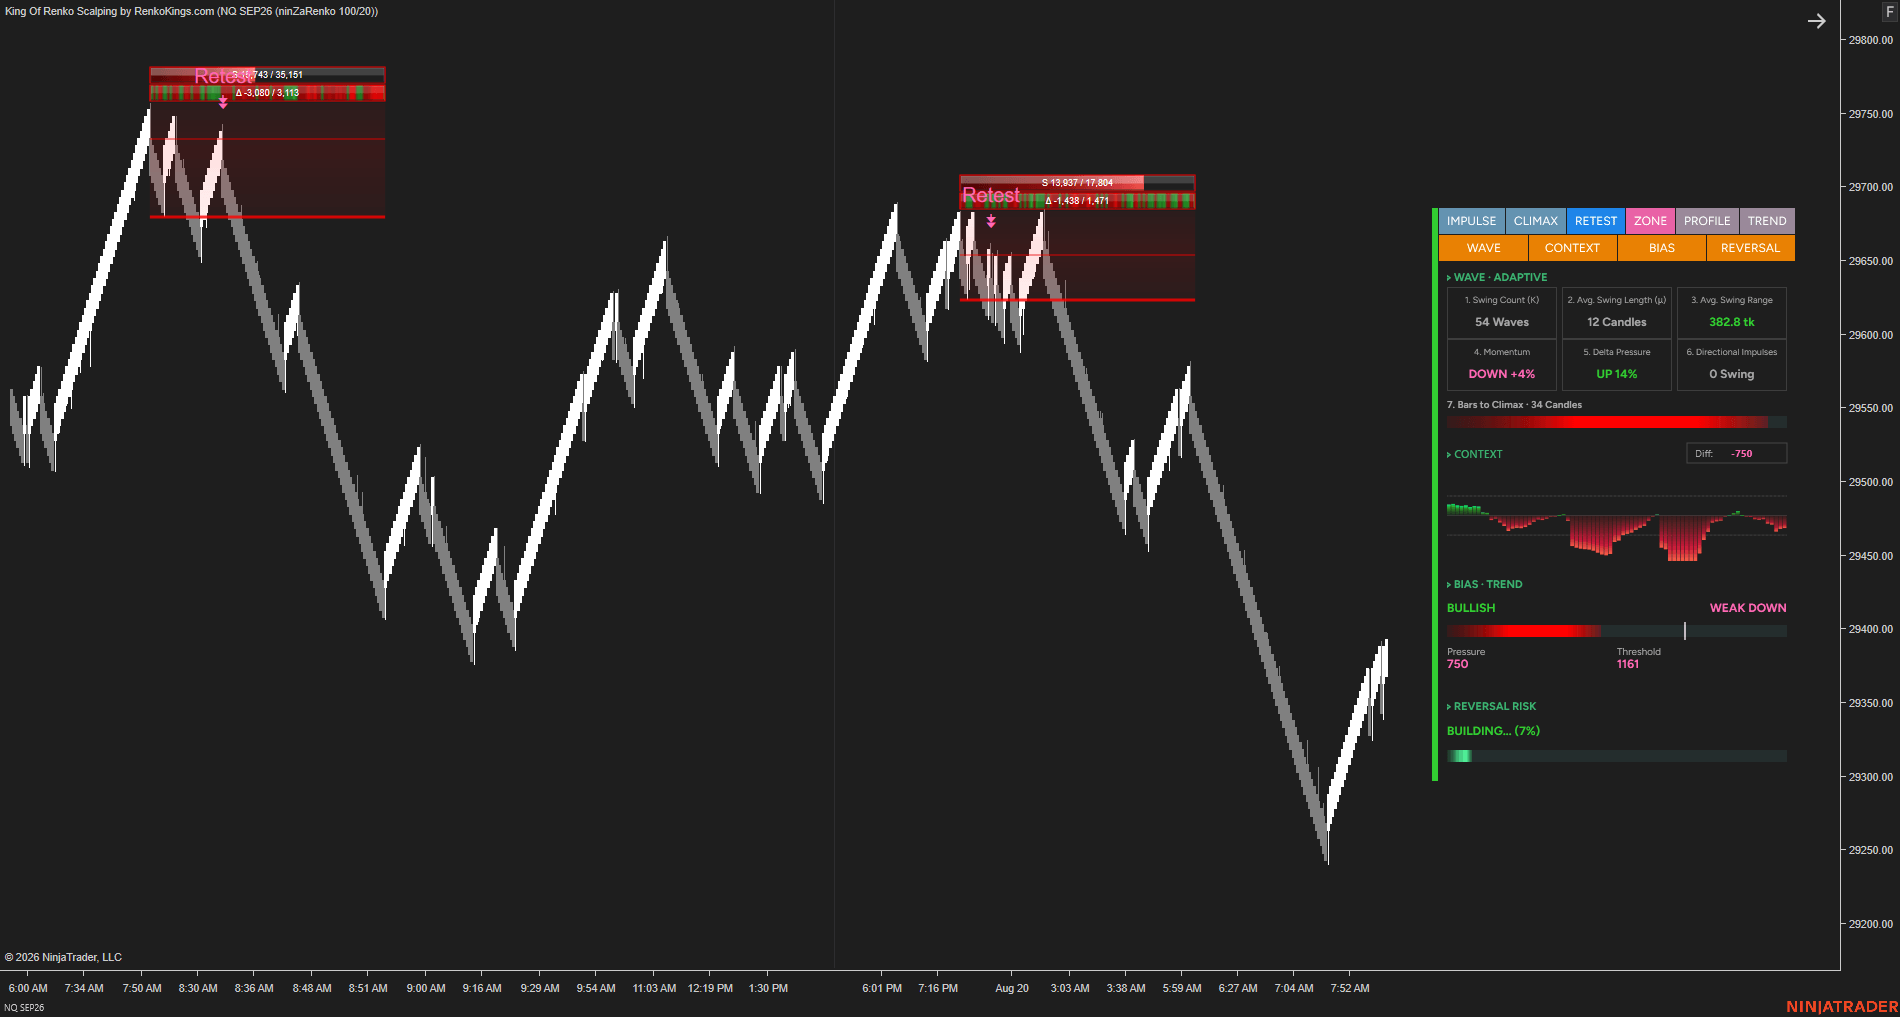
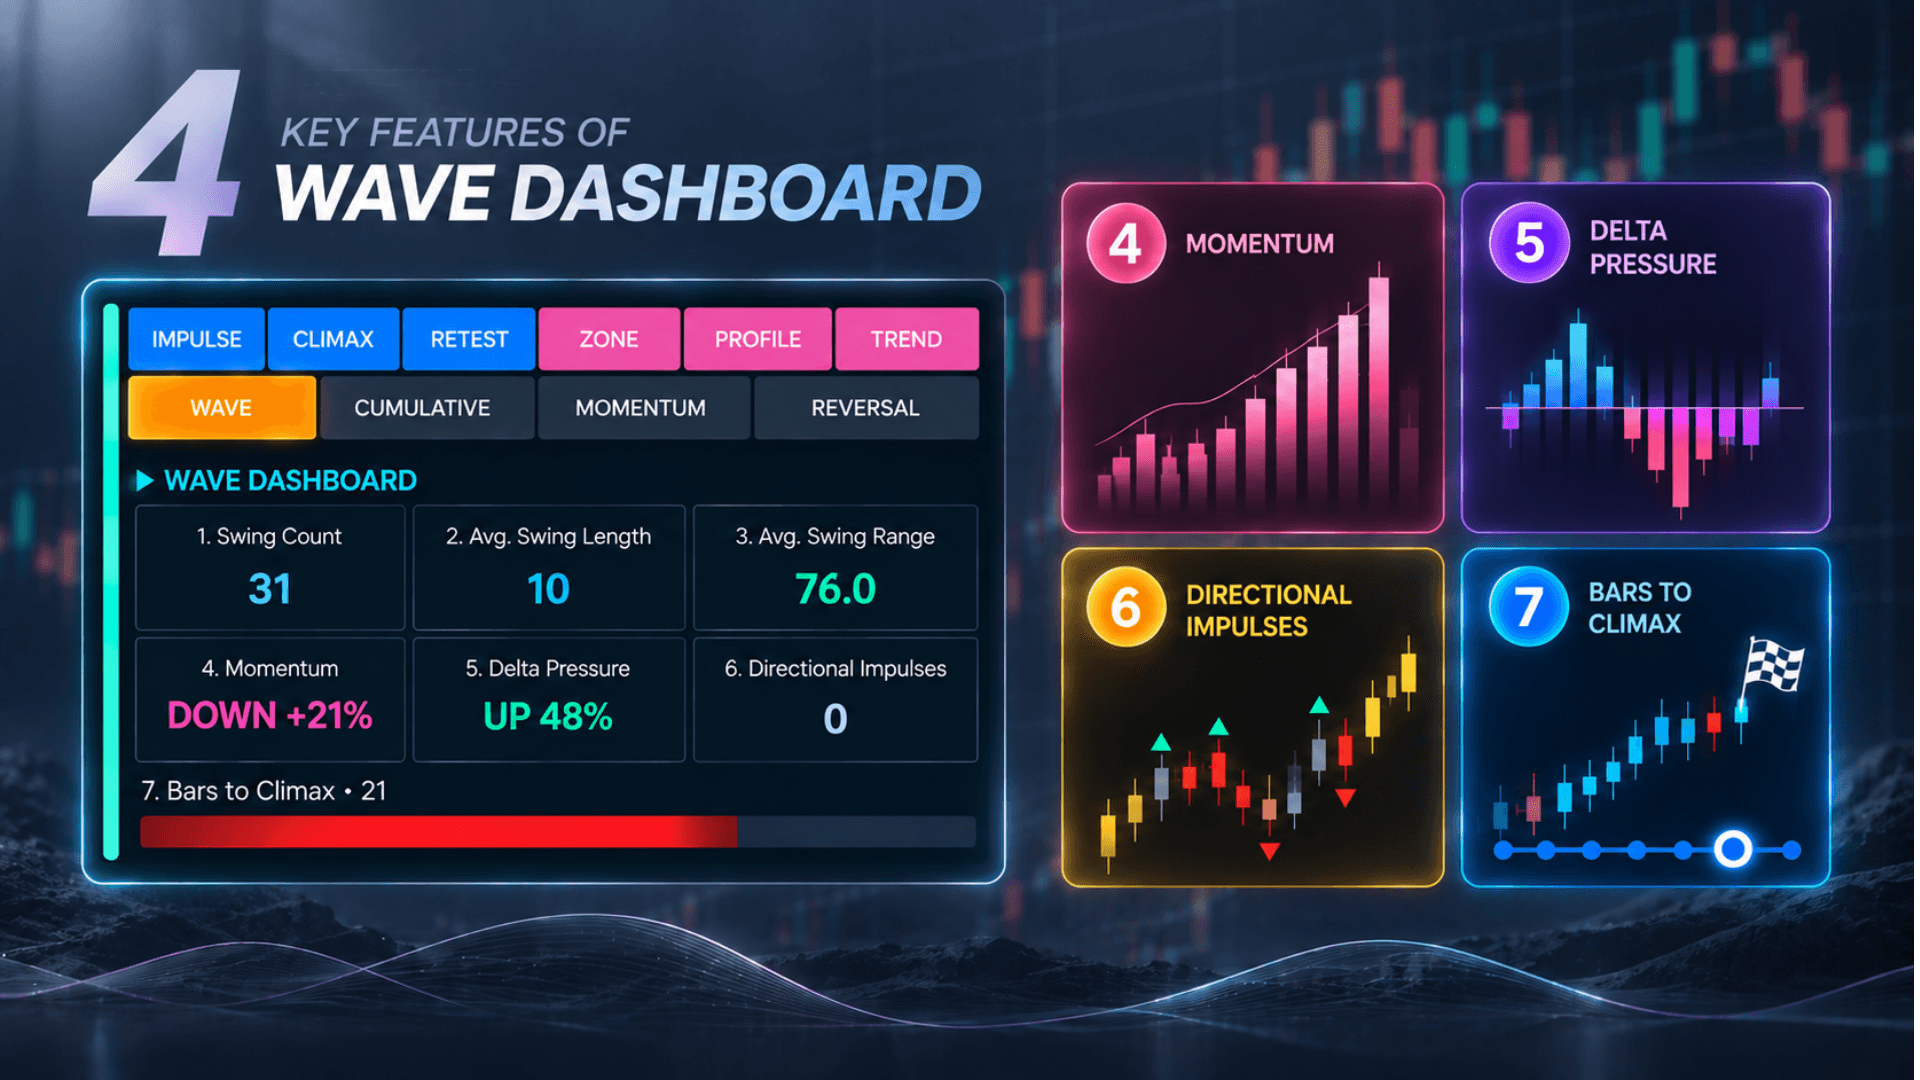
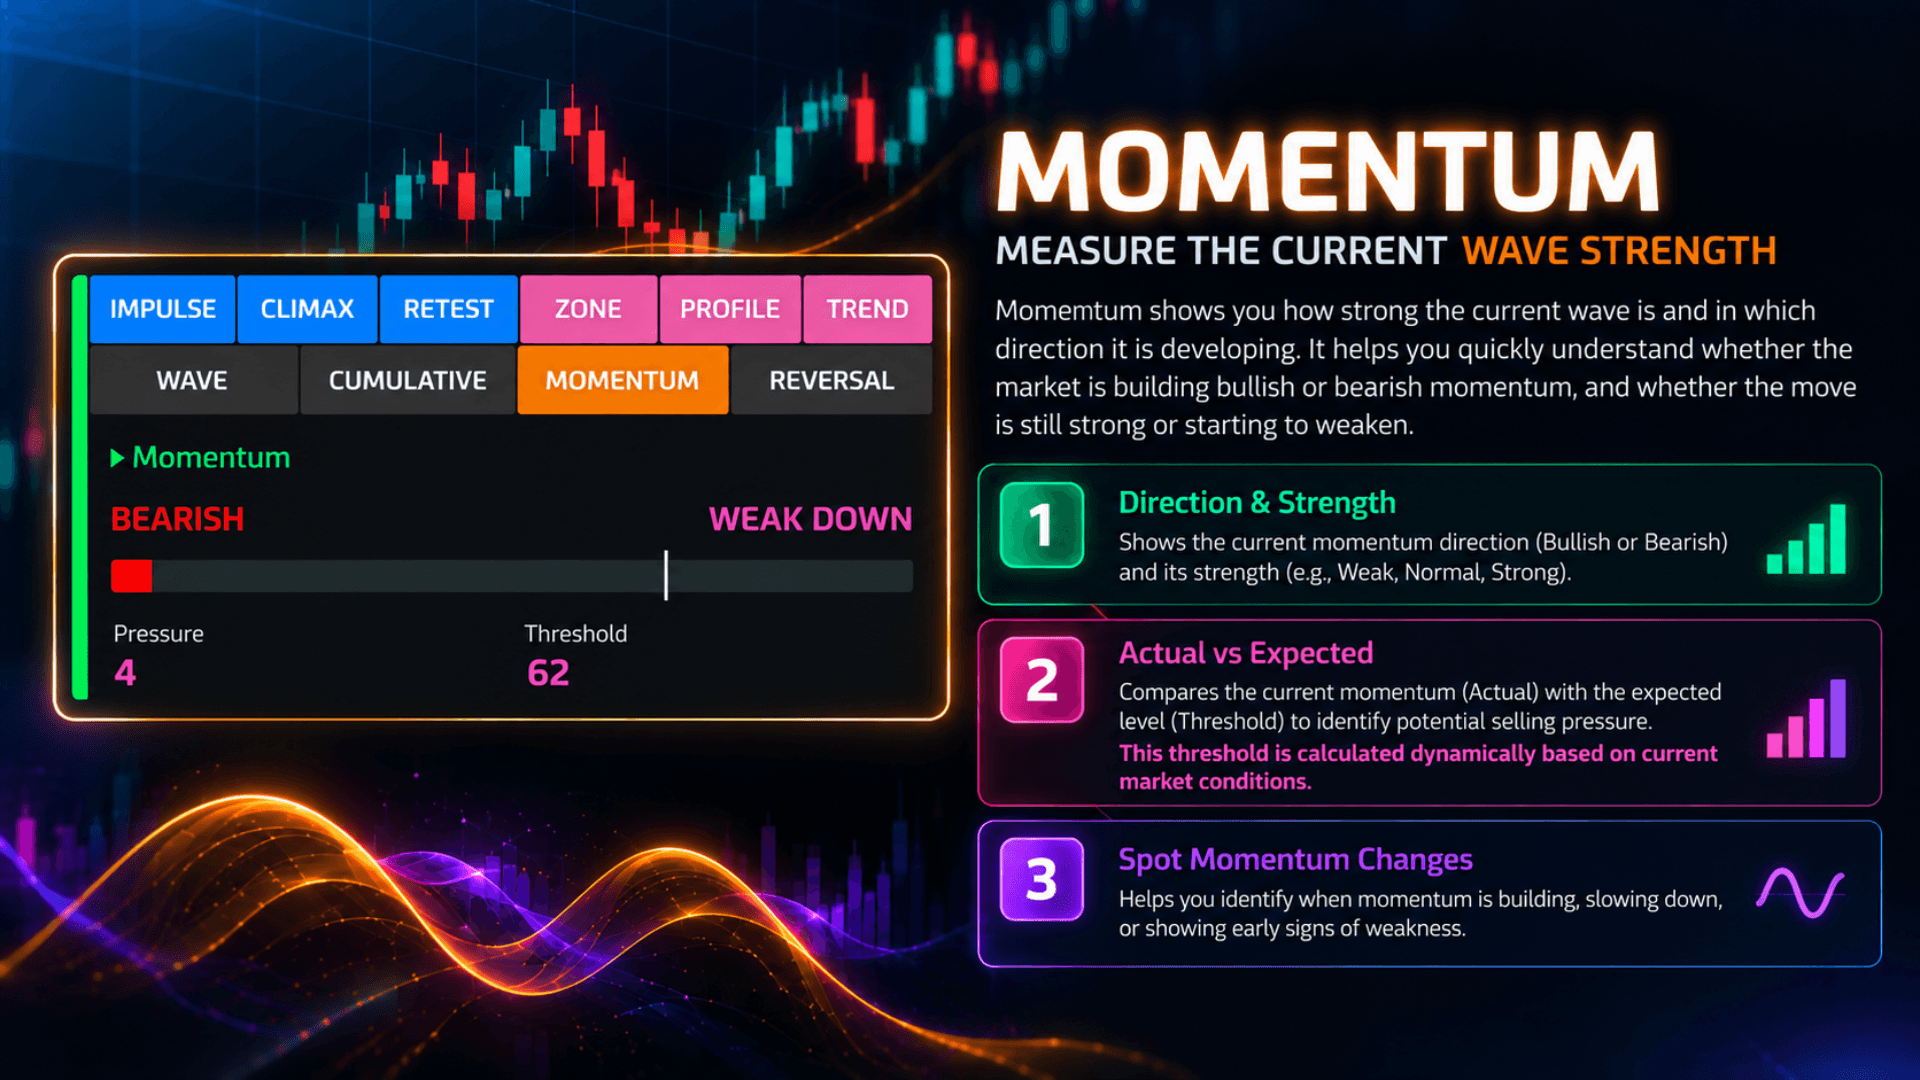
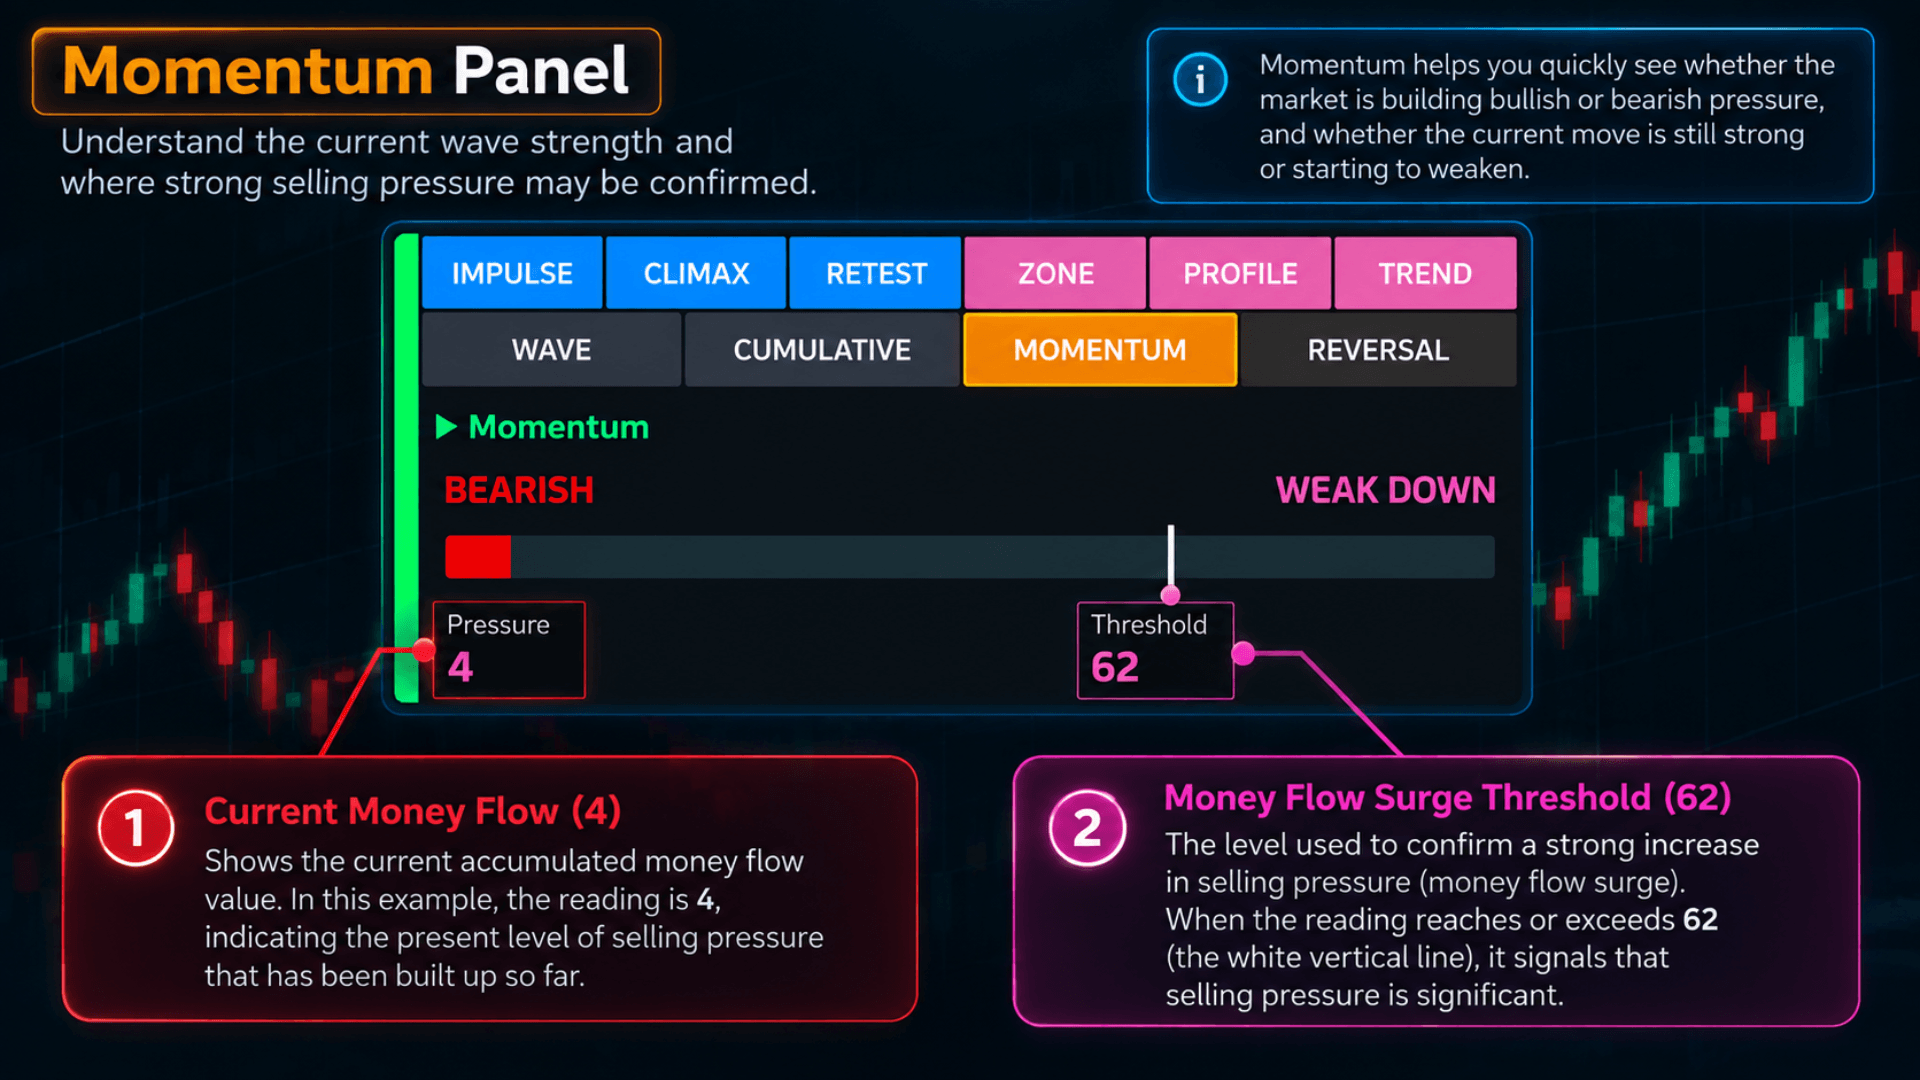
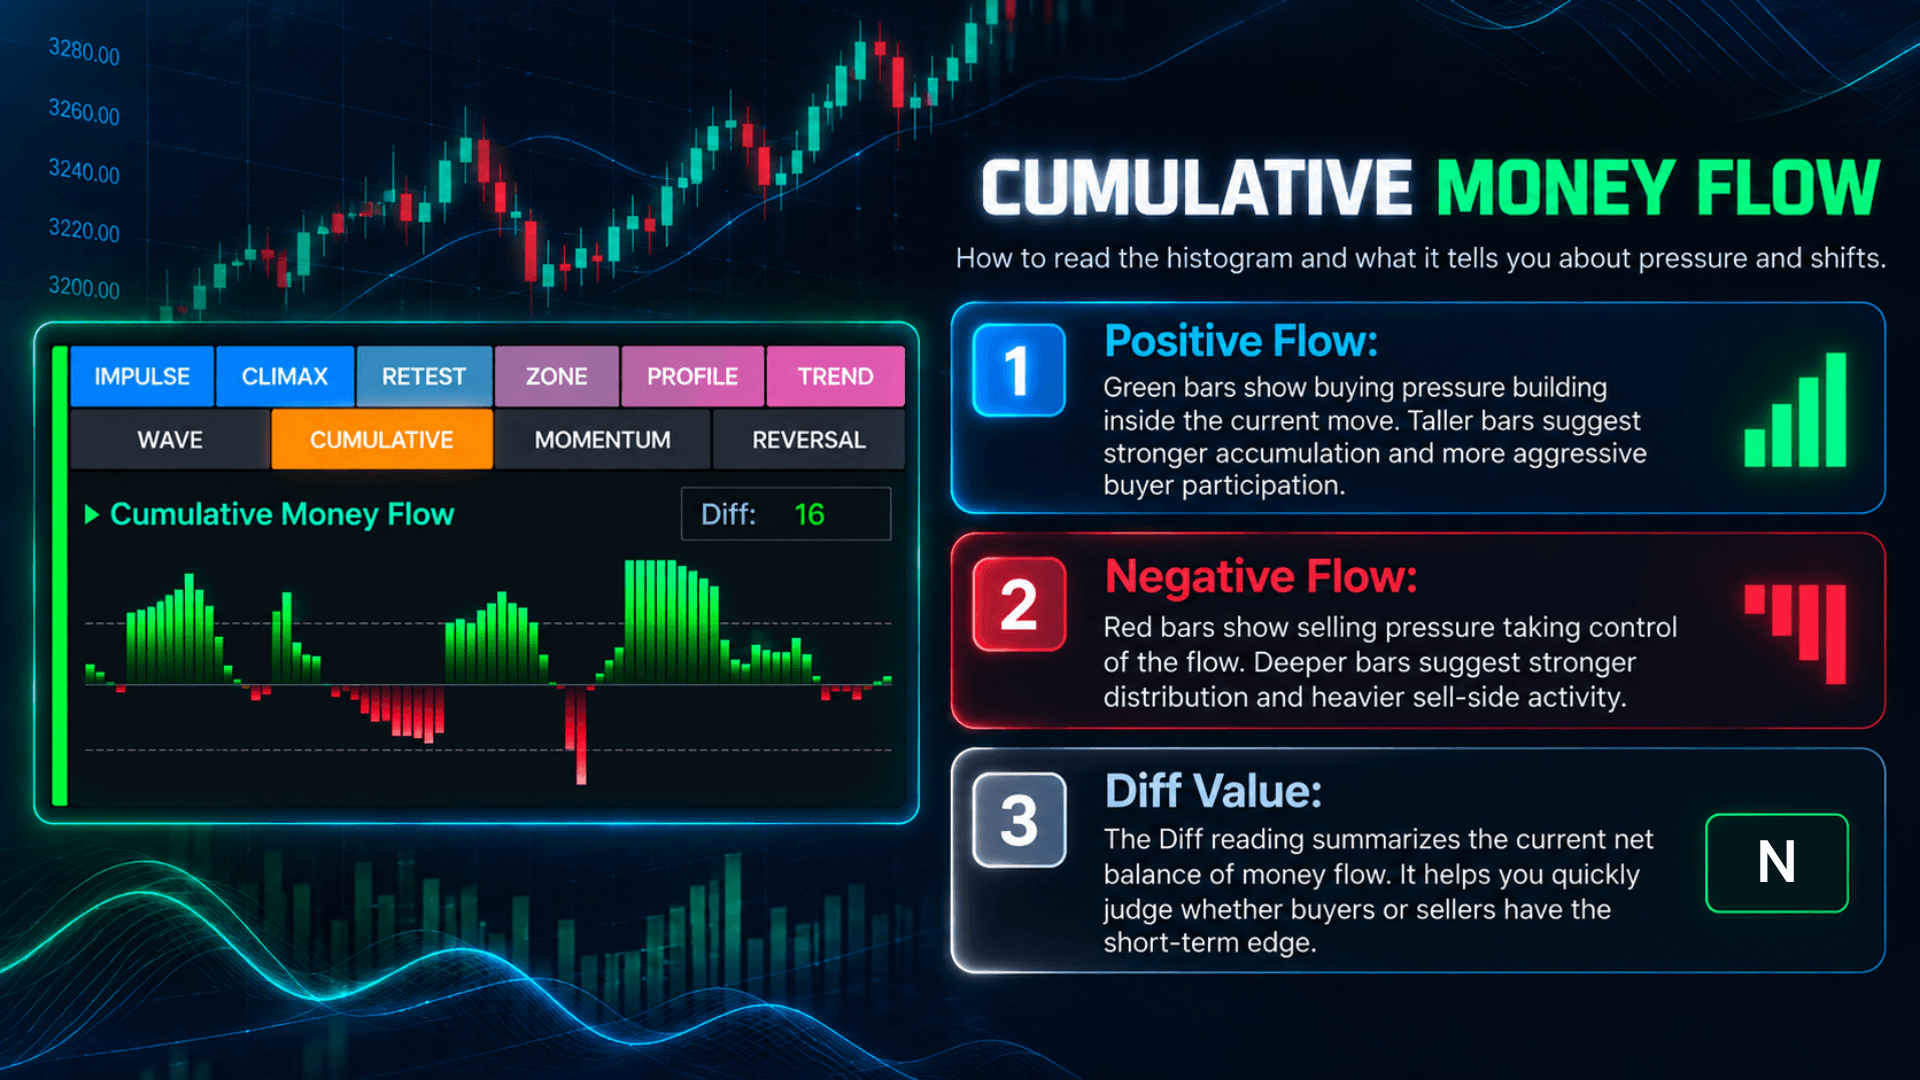
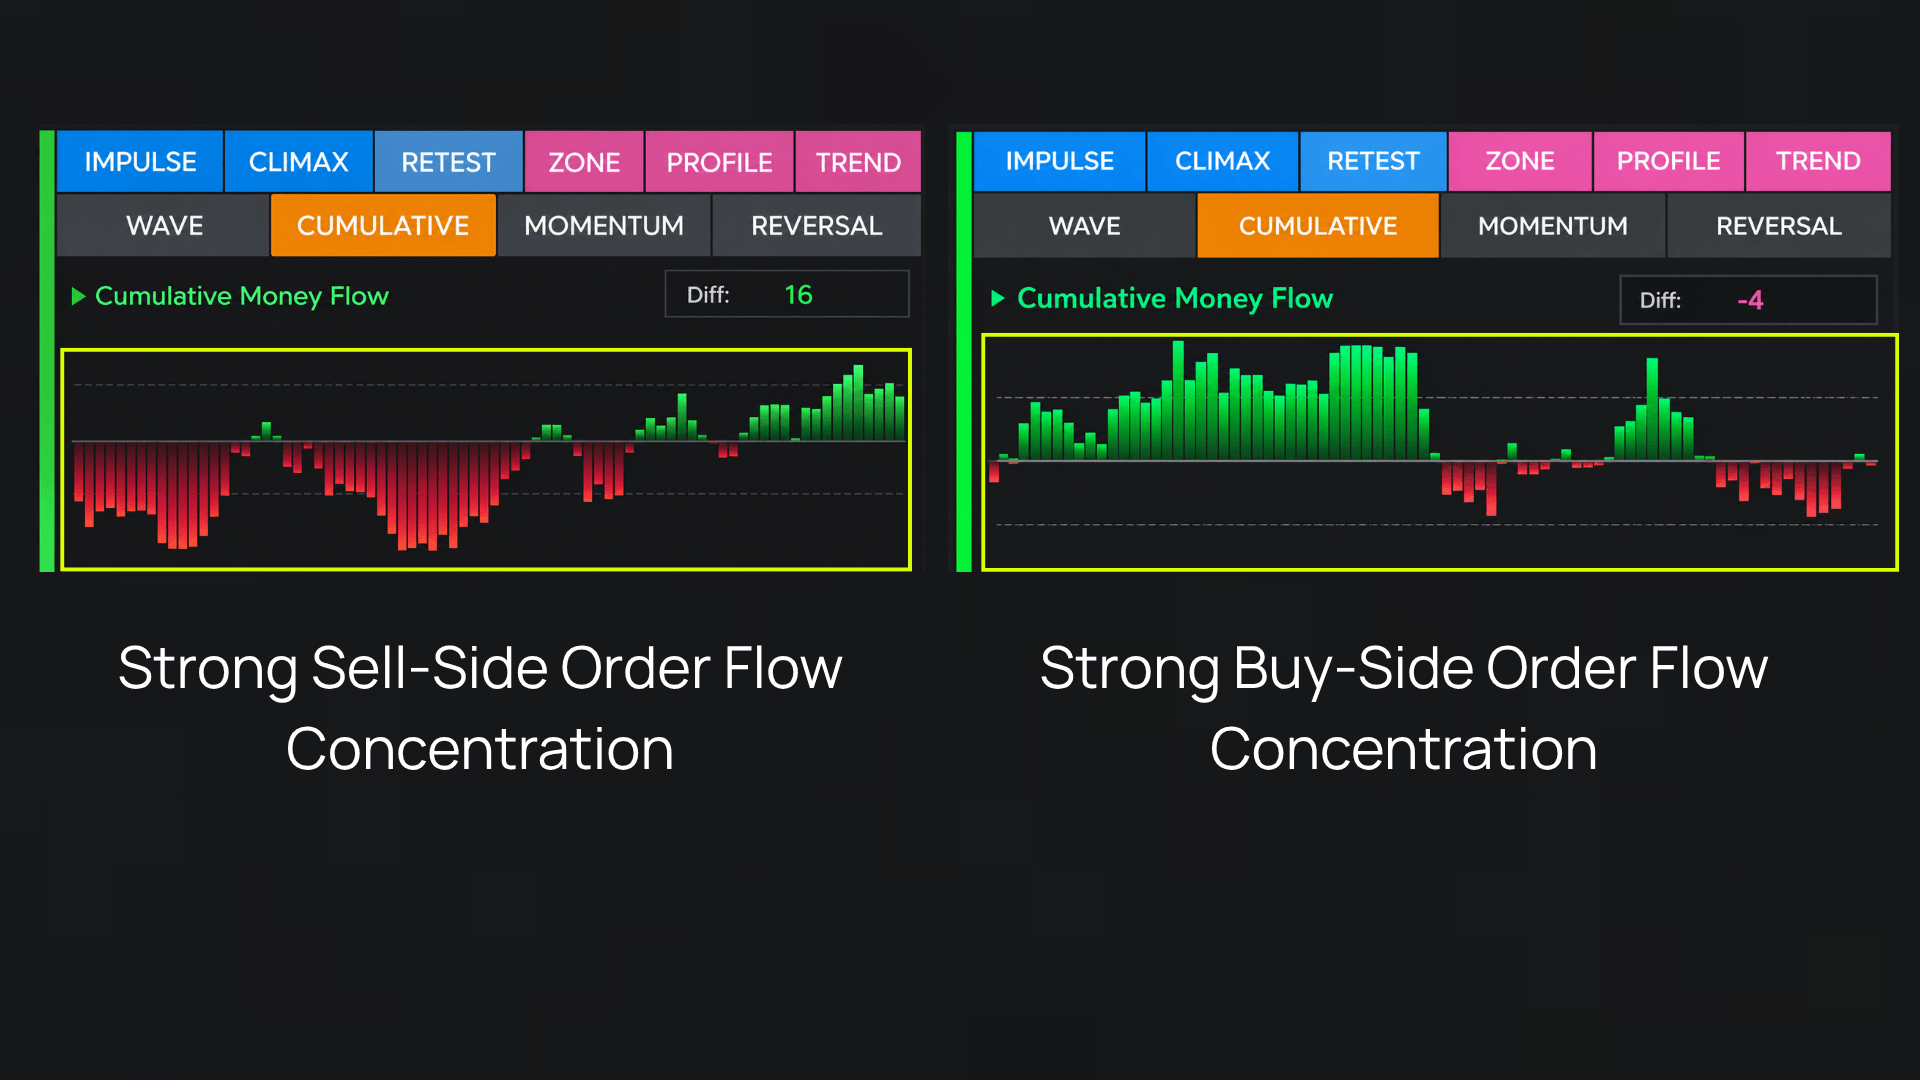
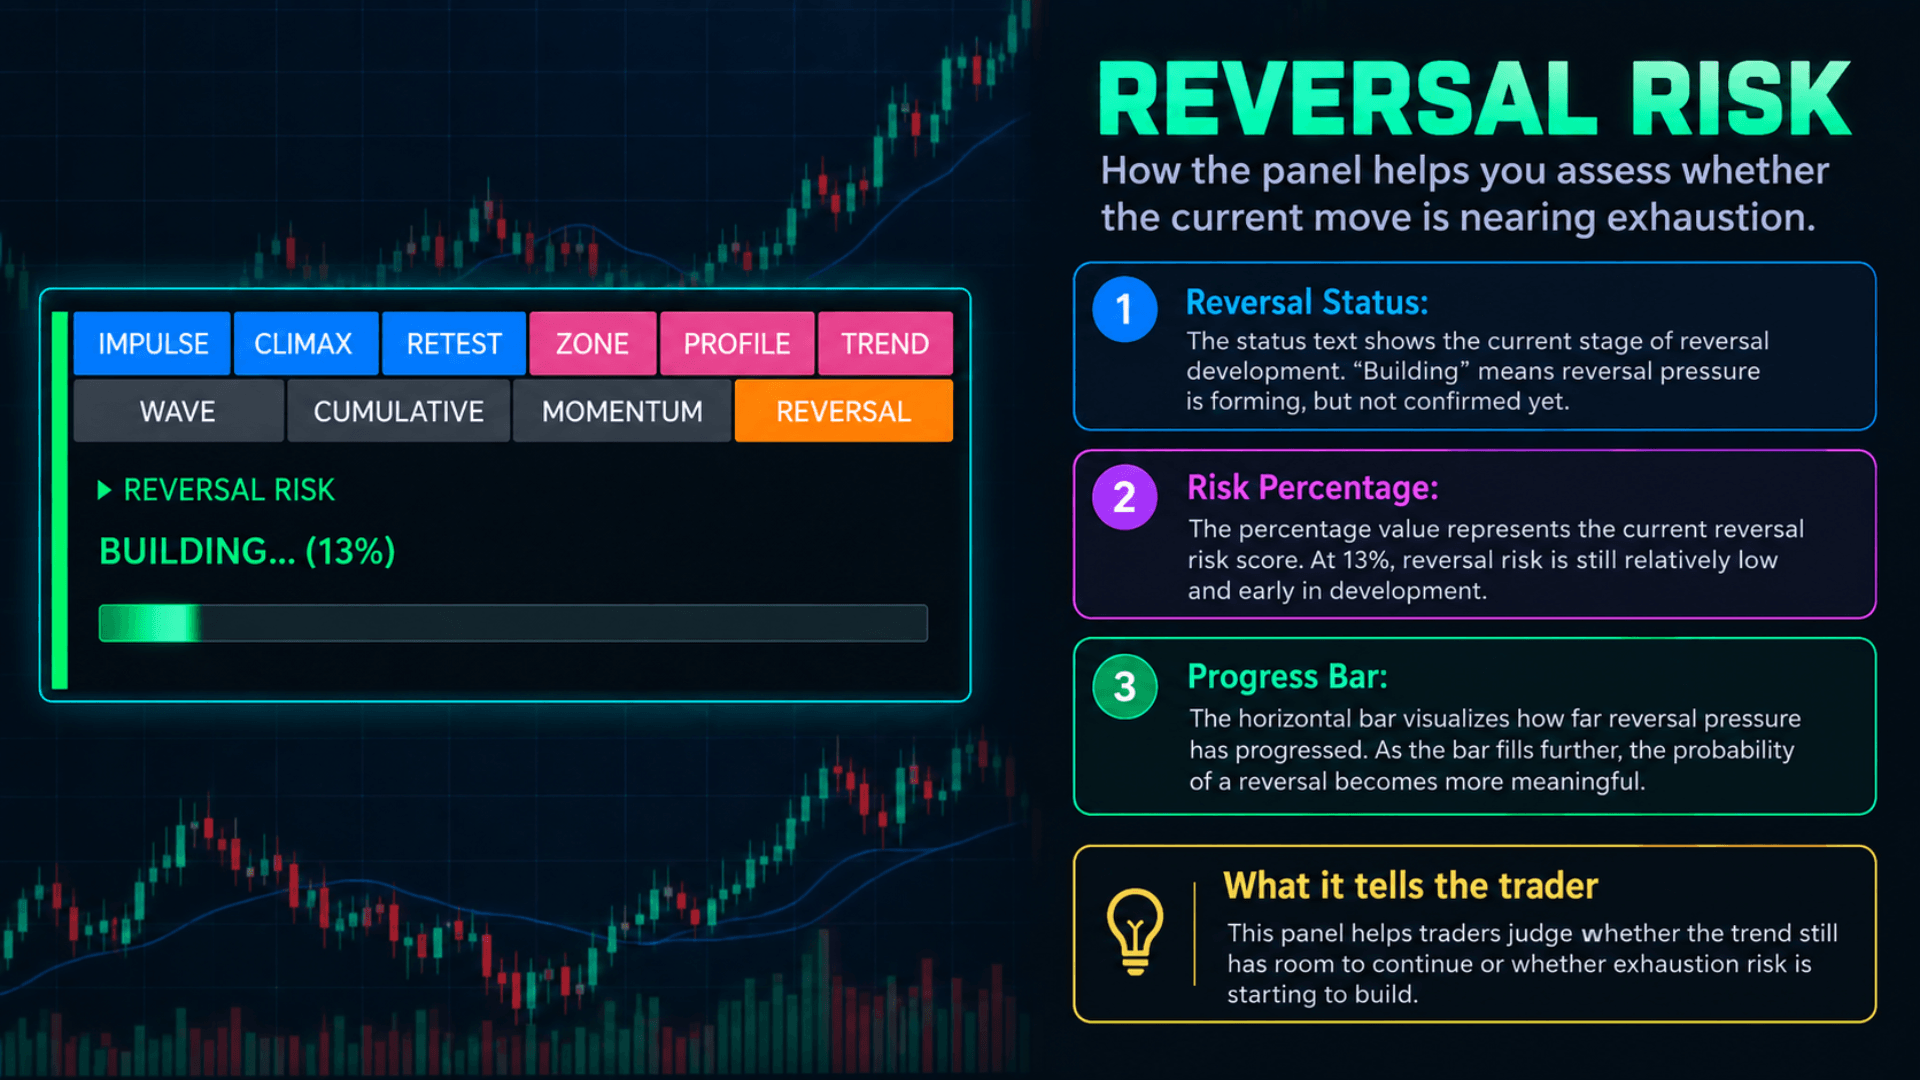
Poseidon Trident —E does more than identify which type of opportunity is emerging. It also adds 9 layers of market information, each revealing a different dimension of the same movement. Together, they provide you with deeper context for assessing the quality of a trading opportunity.
01
02
03
04
06 / WEBINAR & NINZA DIRECT REPLAYS
Want to see how this way of reading Renko works on a chart? Explore our webinar and NINZA Direct replays for live chart walkthroughs, trading examples, and conversations with the NINZA team.
NINZA Direct: Ask the Team #6
In this session, we look beyond individual Renko bars and follow how Waves build, compress, and extend. You’ll see how Poseidon Trident —E compares each Wave with recent market behavior, and why the market condition matters when choosing between an Impulse, Retest, or Climax signal.
We also walk through the dashboard, answer traders’ questions, and show how Poseidon Trident —E can work with Captain Optimus Strong v2 for automated trade execution.
Webinar Replay: Live Trading
Watch James Buchman trade live with Poseidon Trident —E and Oracle Matrix.
He walks through real setups and shows how he approaches early entries, extended moves, and pullbacks that could be mistaken for reversals.
NINZA Direct #9 Replay
Learn how to trade impulse continuations, zone retests, and Wolfe Wave Navigator reversals using Poseidon Trident —E, ImpulseWave Radar, and Wolfe Wave Navigator, with live chart examples.
Webinar Replay
See how Poseidon analyzes wave strength, volume, and delta to generate Impulse, Retest, and Climax signals, and how it stays out of choppy markets. Live examples on ES and NQ.
07 / LIVE TRADING
See Poseidon Trident —E applied as the market unfolds — not through backtesting or chart replay, but through real trading sessions and real-time decisions.
LIVE SESSION 01
See how Poseidon Trident —E identifies impulse, retest, and climax conditions to support live trading decisions across trending and sideways markets.
LIVE SESSION 02
See how Poseidon Trident —E adjusts to lower-volatility Asian-session conditions through flexible Renko sizing, responsive signal settings, and real-time impulse, retest, and climax analysis.
LIVE SESSION 03
See how Poseidon Trident works with Captain Optimus Strong and Infinity Algo Engine to identify directional momentum and execute eight trades automatically in real market conditions.
LIVE SESSION 04
See how Poseidon Trident’s impulse signals helped the session overcome early losses and return to profit — without increasing risk, chasing trades, or abandoning the strategy.
LIVE SESSION 05
See how Poseidon Trident’s impulse signals helped the session overcome early losses and return to profit — without increasing risk, chasing trades, or abandoning the strategy.
LIVE SESSION 06
See how Poseidon Trident —E’s Impulse and Retest signals perform across 30 trading days and different market conditions.
SIGNAL DEMO
Over 3 trading days, Poseidon Trident —E generated more than 100 Impulse Signals — and 90 of them were followed by favorable movement in the signaled direction.
Signal Filtering & Risk Management
Use trend alignment, supply and demand zones, and buy/sell pressure to evaluate impulse, climax, and retest signals—then manage risk as market conditions change.
SIGNAL WORKFLOW
Use multi-chart trend context, key price zones, and pressure bars to assess signals—and manage risk as conditions change.
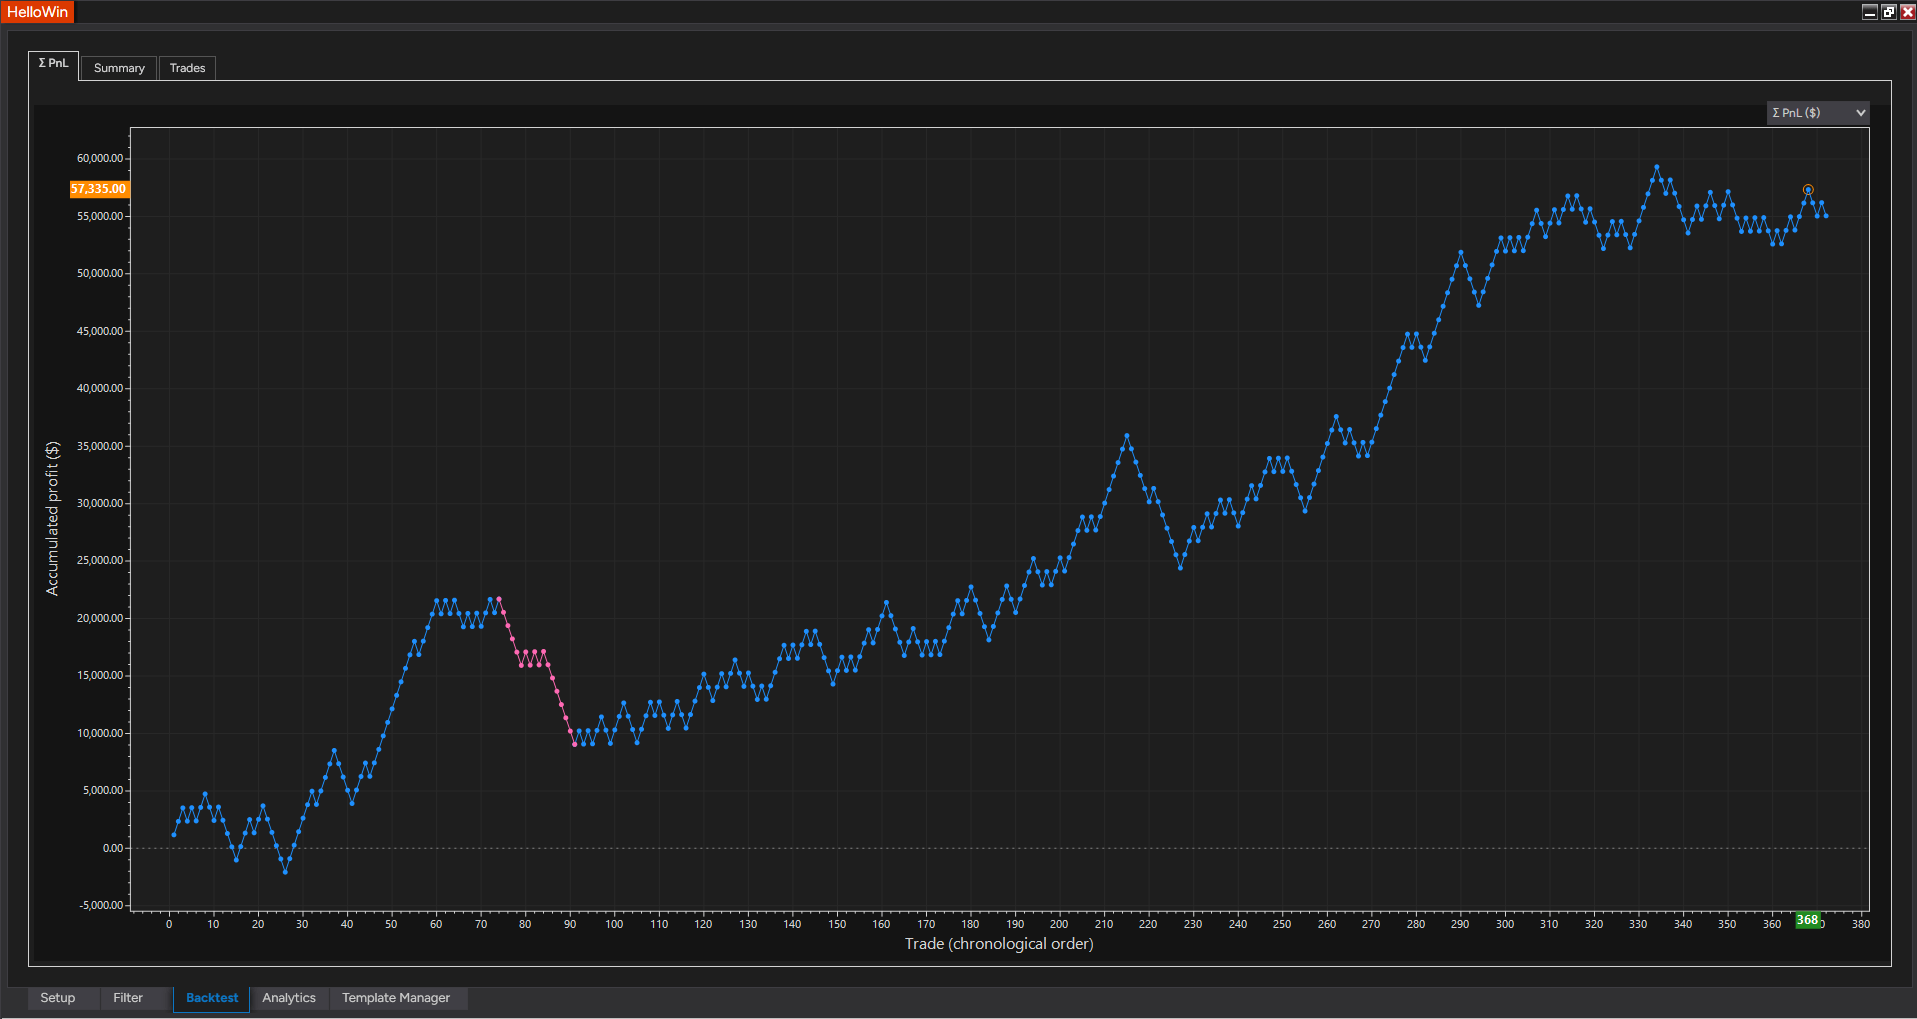
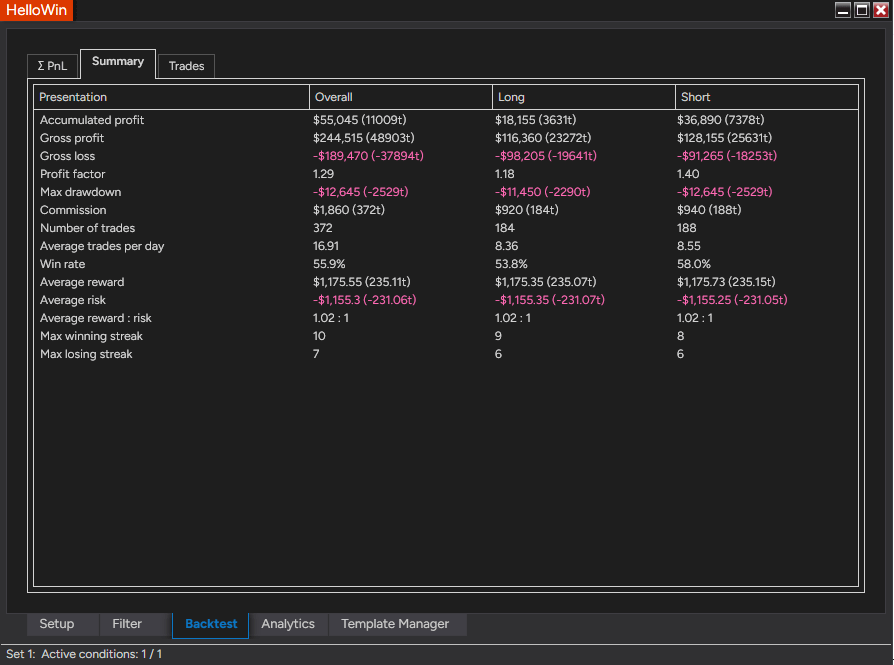
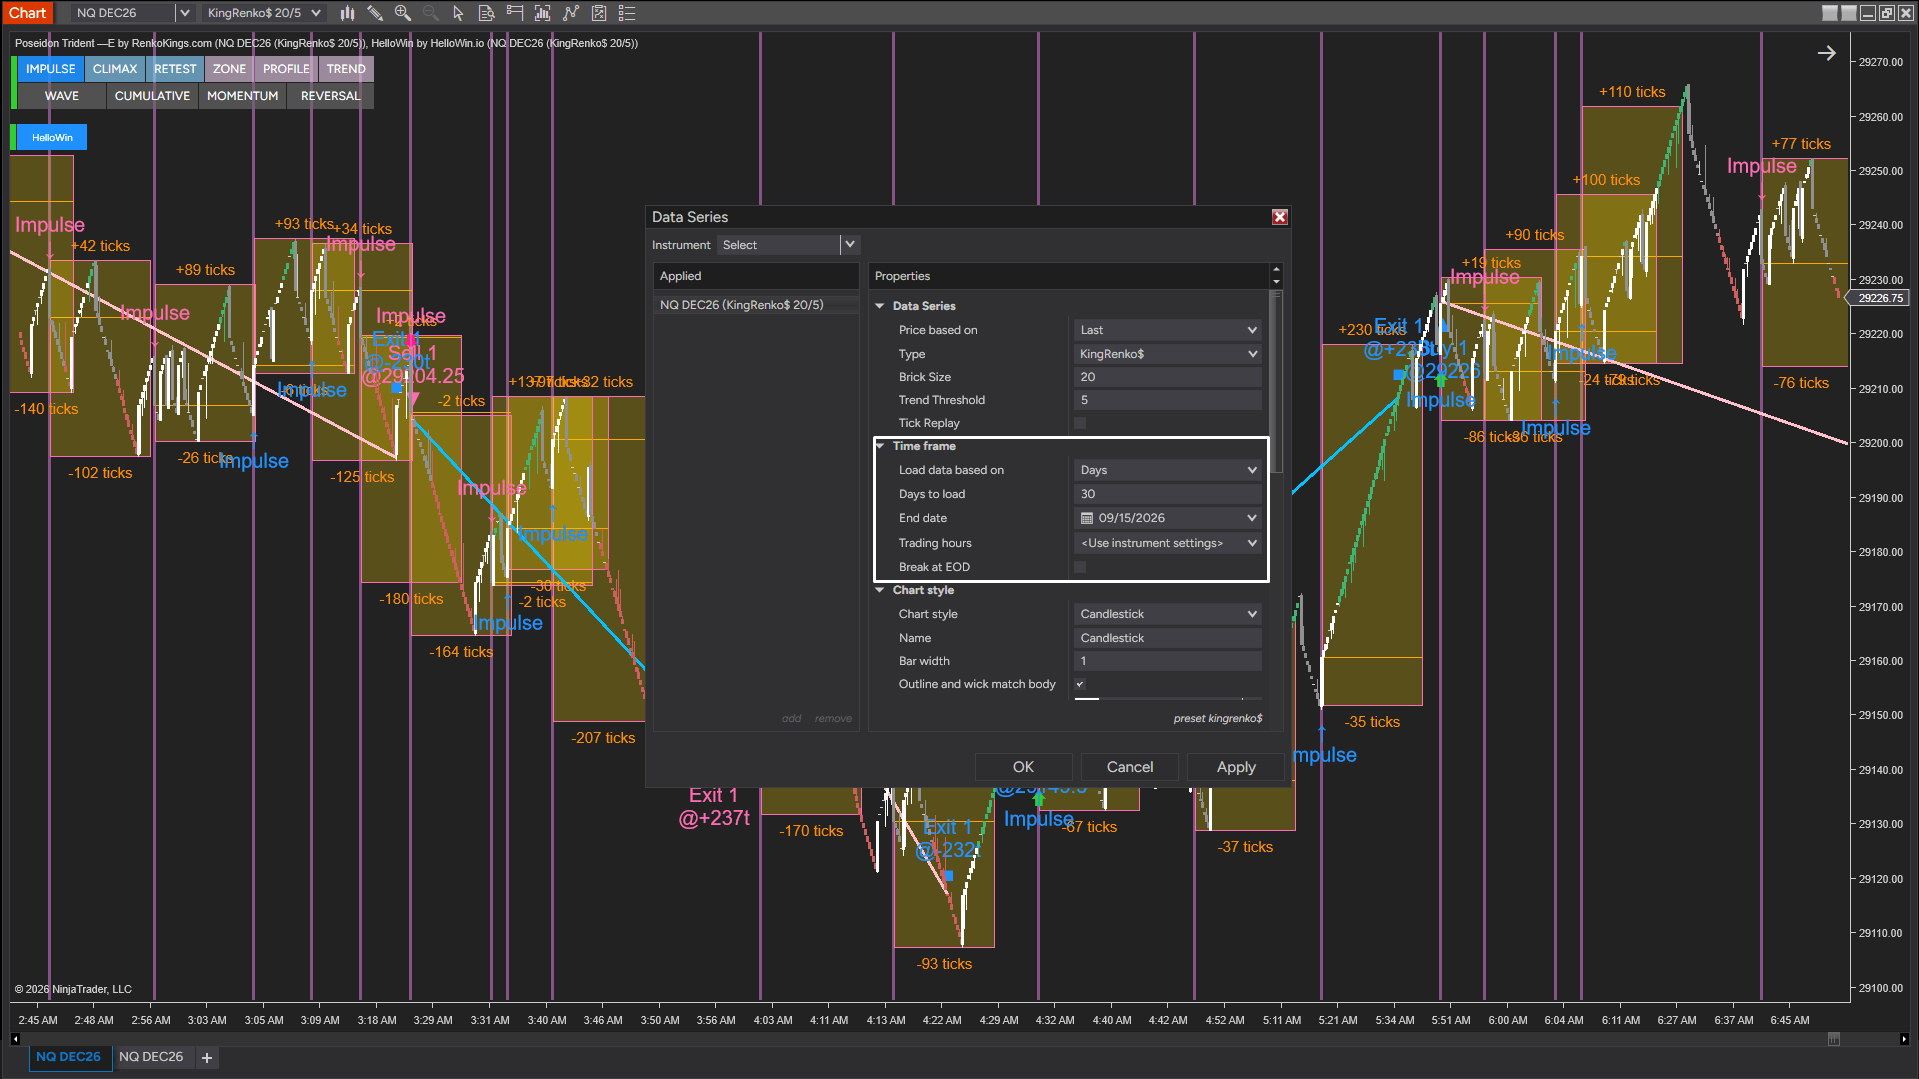
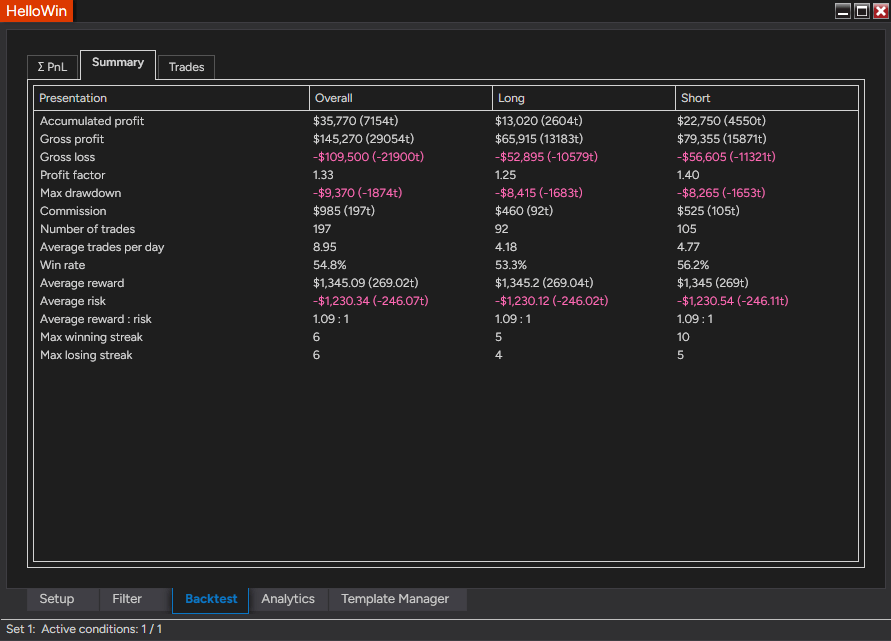
30-DAY IMPULSE SIGNAL BACKTEST
Over the latest 30-day period, Poseidon Trident —E identified an average of more than 16 Impulse Signal opportunities per day.
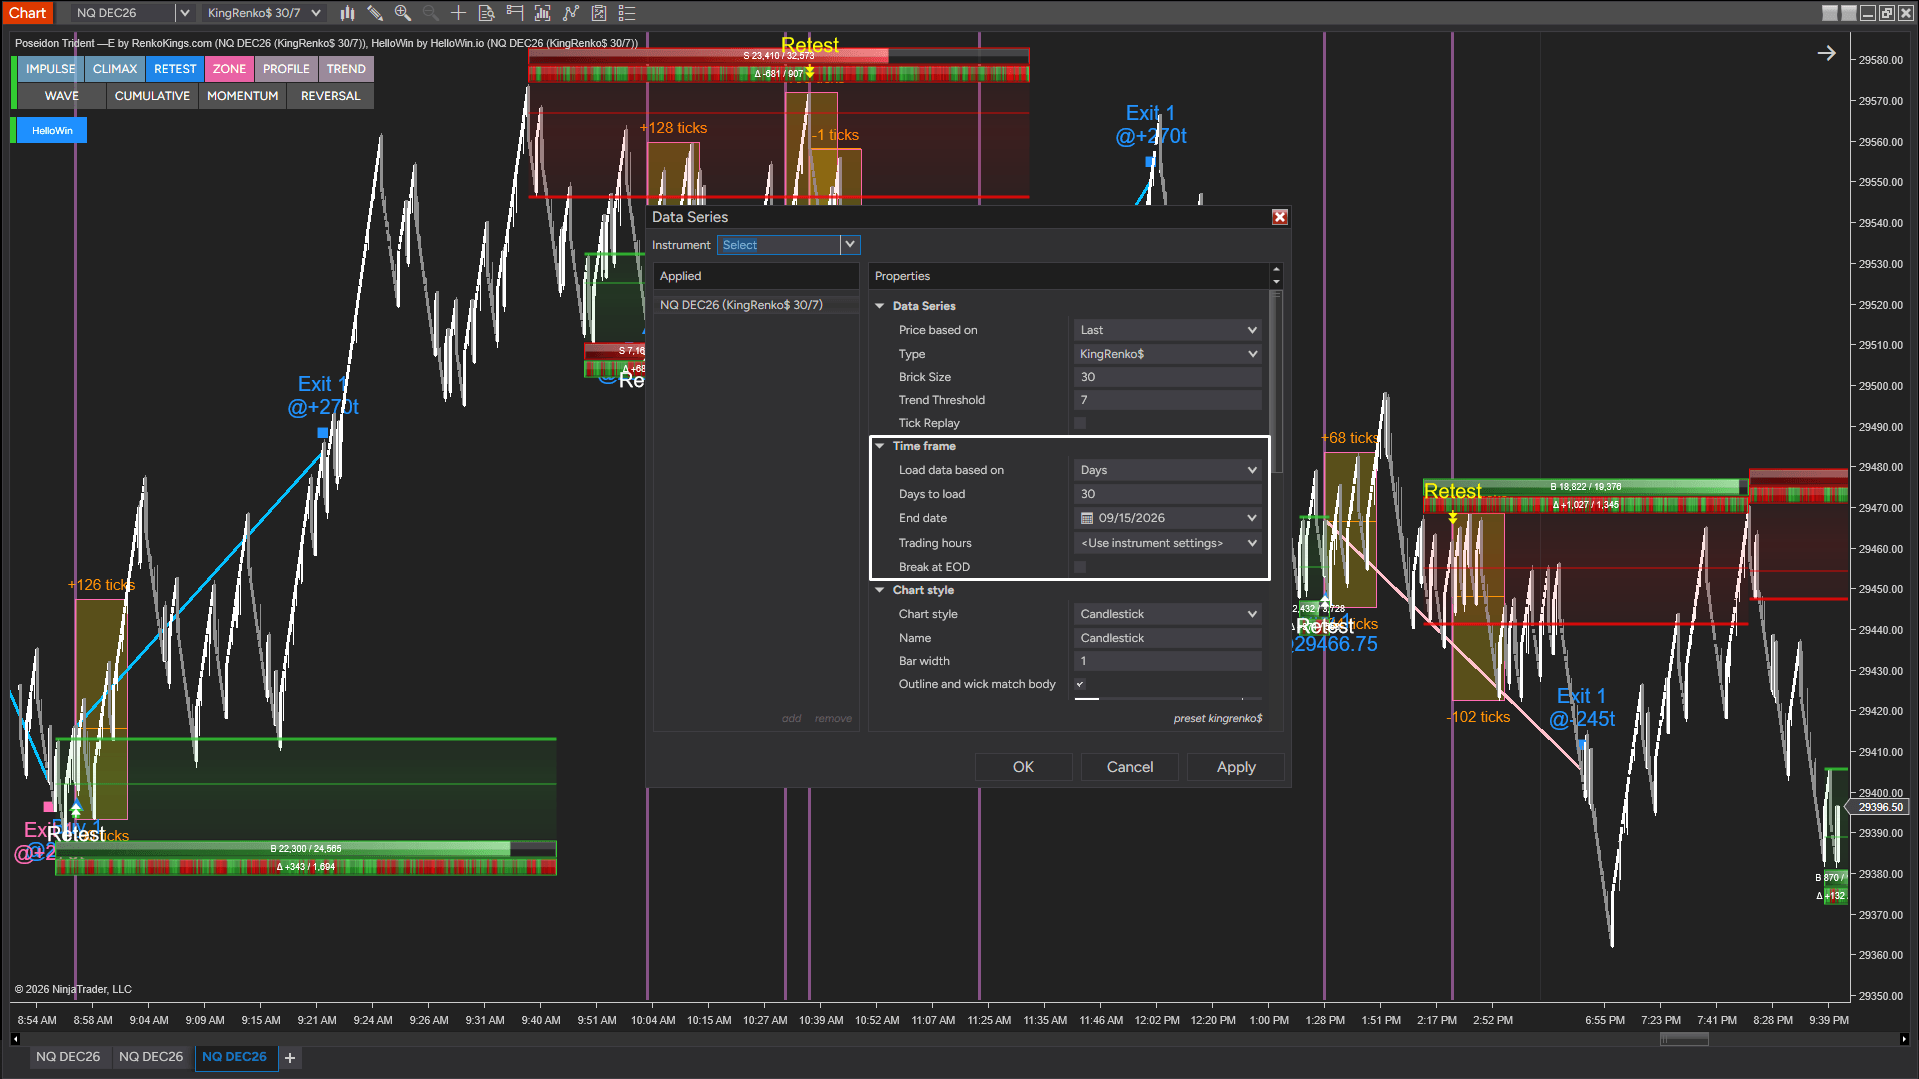
30-DAY RETEST SIGNAL BACKTEST
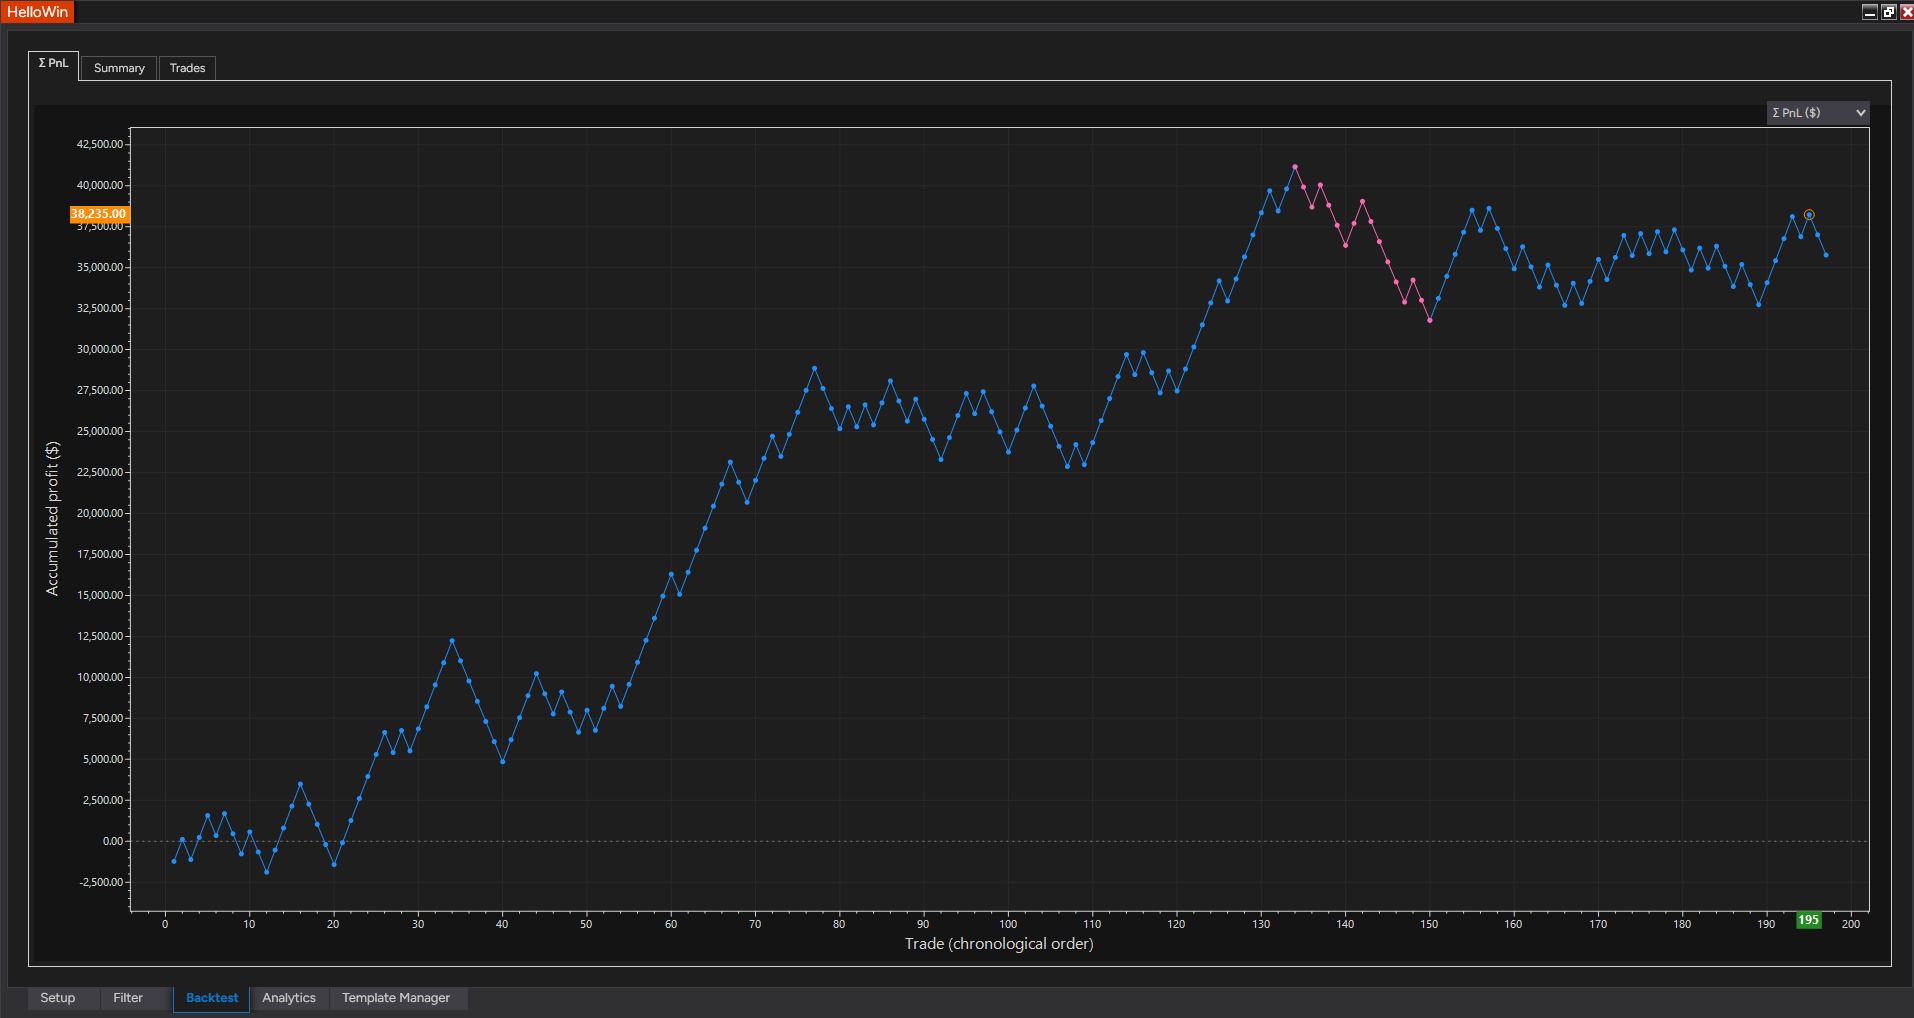
Review how Poseidon Trident —E identified Retest Signal opportunities as price returned to previous compression zones during the latest 30-day period.
TRADER EXPERIENCES
Every trader reads the market differently. These are their experiences with Poseidon Trident —E, in their own words.
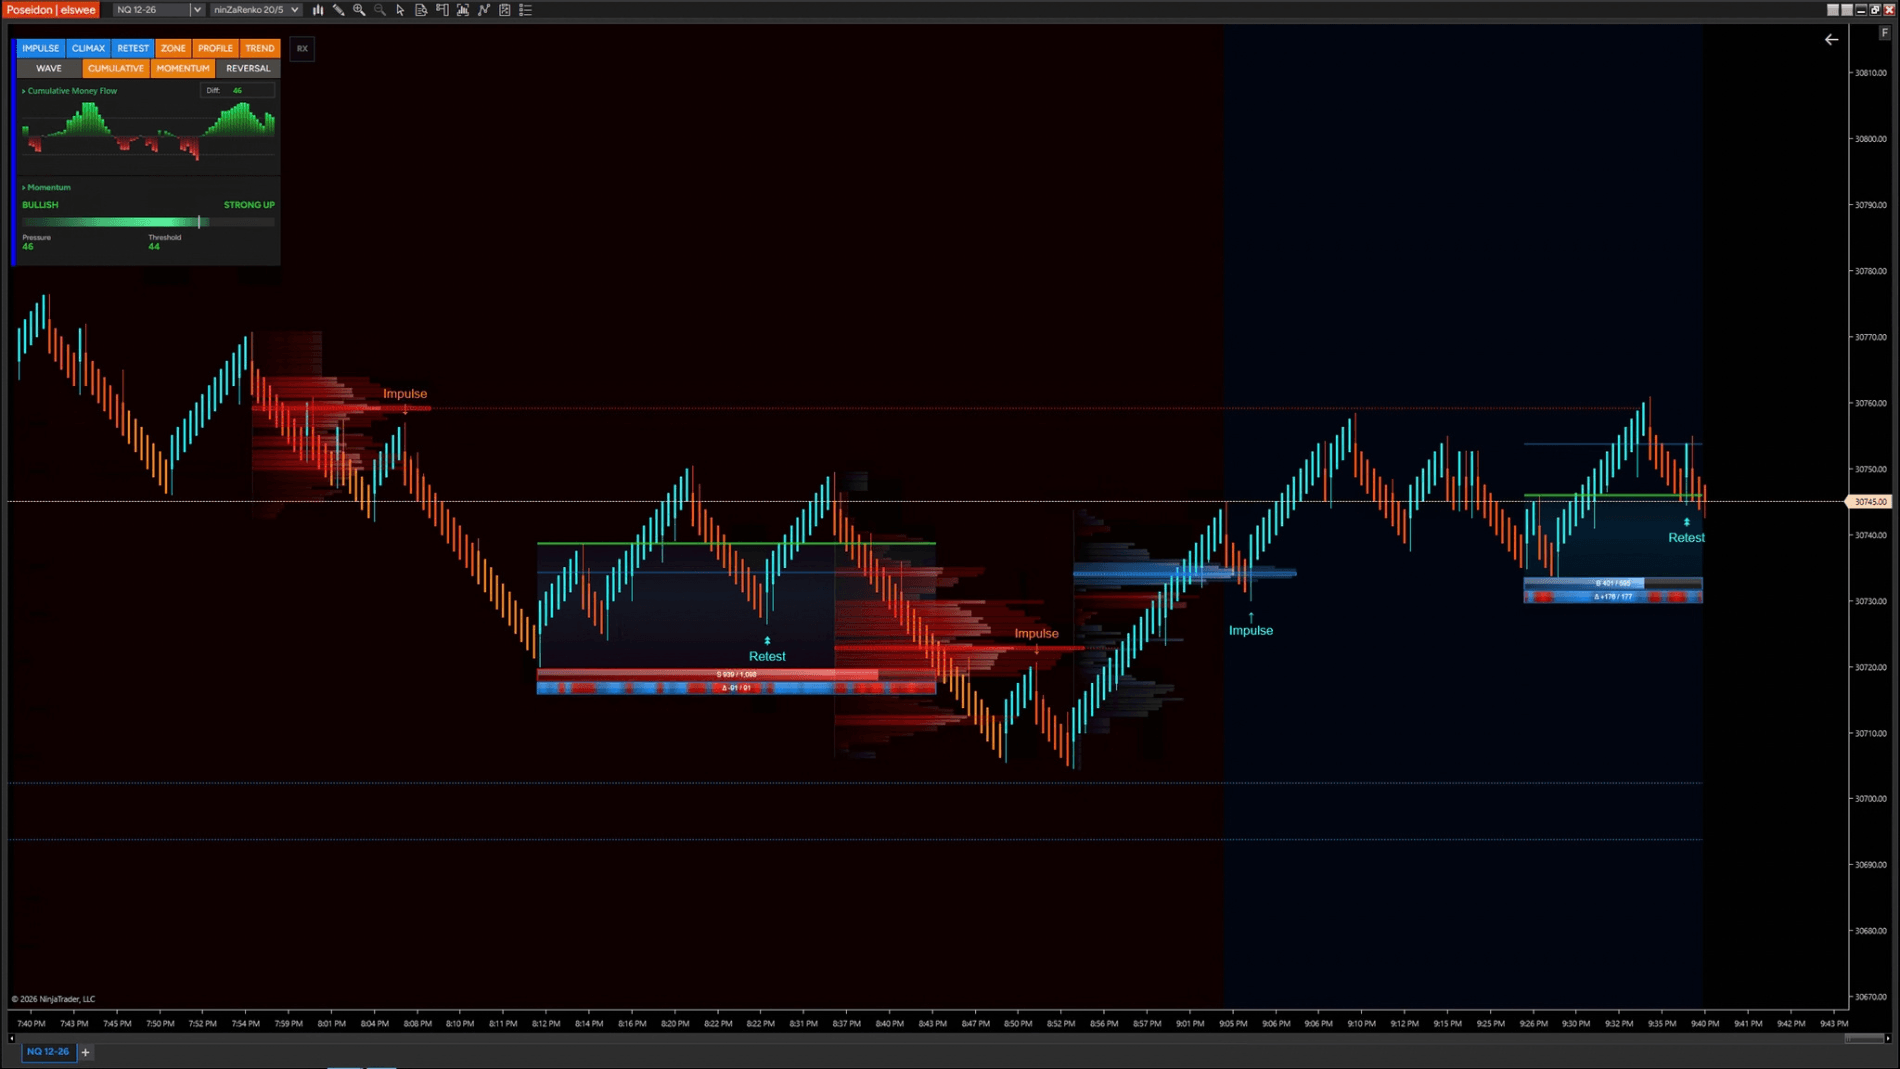
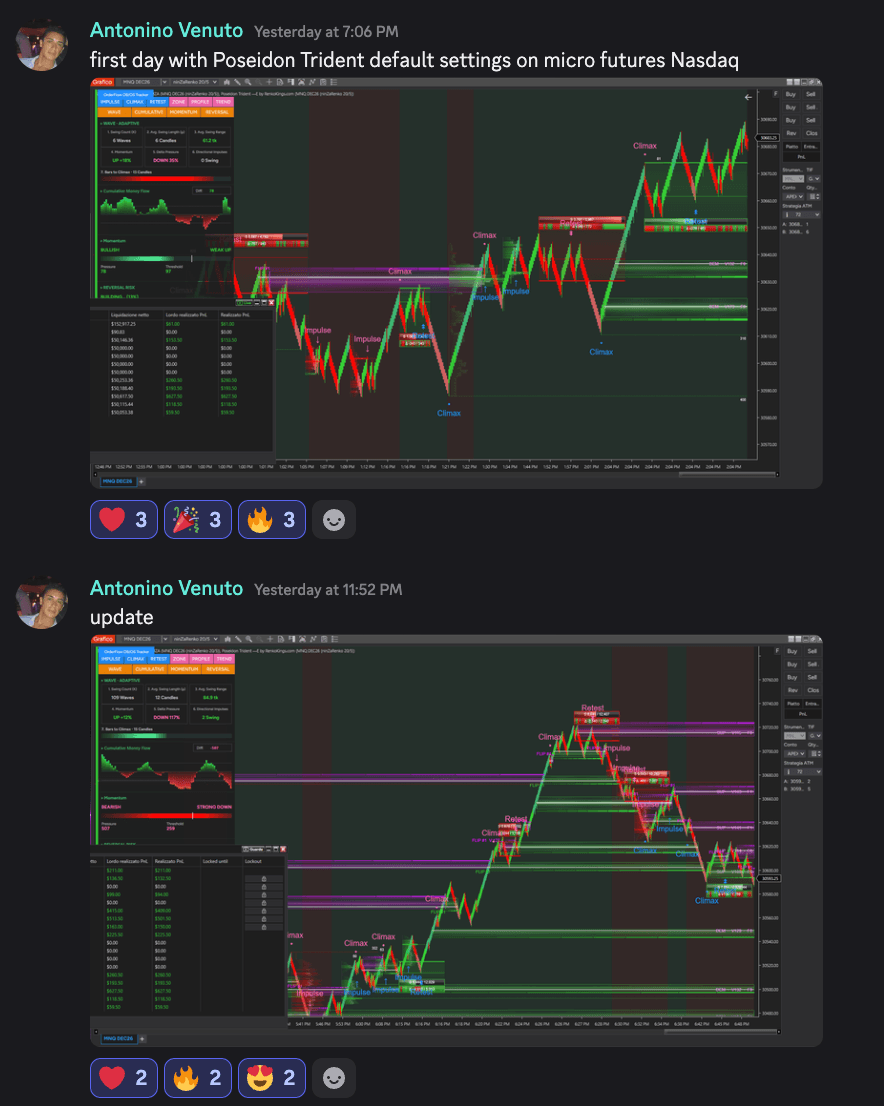
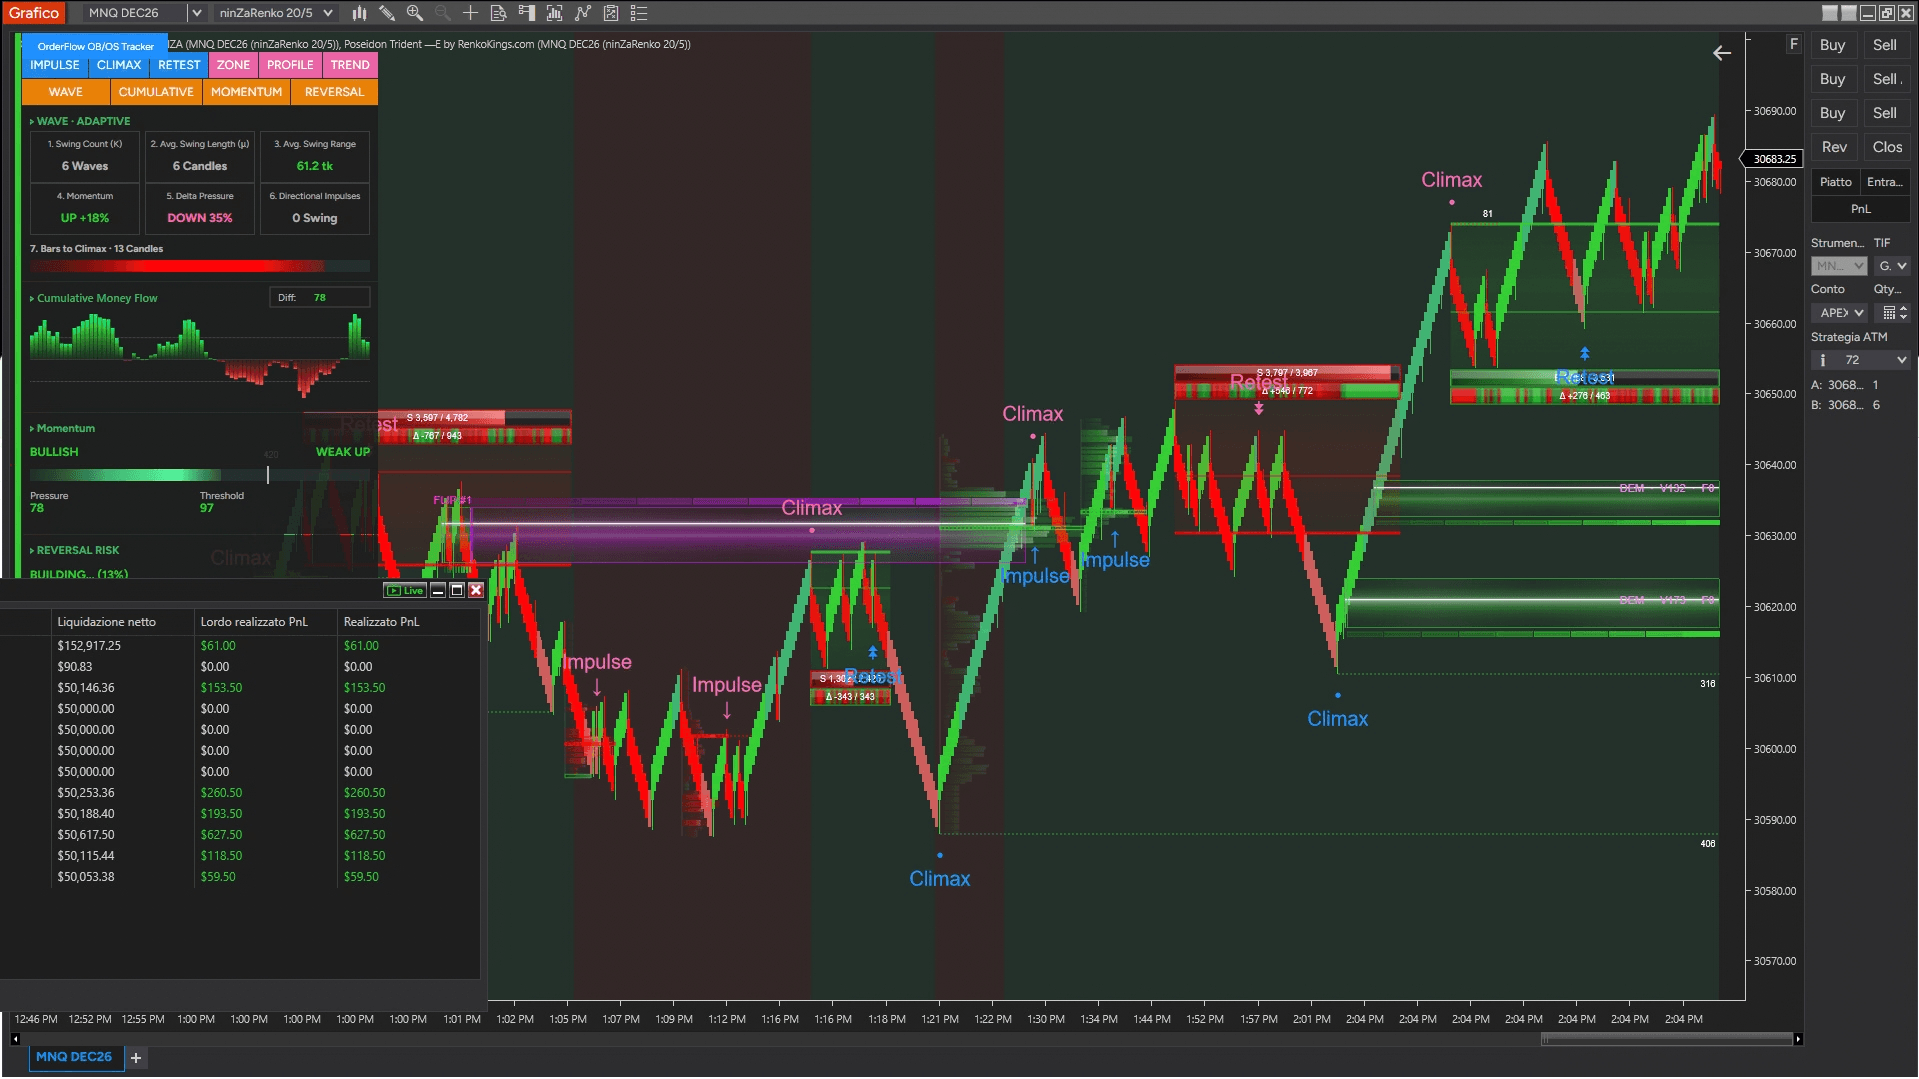
Let’s see how it goes for Antonino as he tries Poseidon Trident —E for the first time, placing a manual limit order at POC support on Nasdaq micro futures.
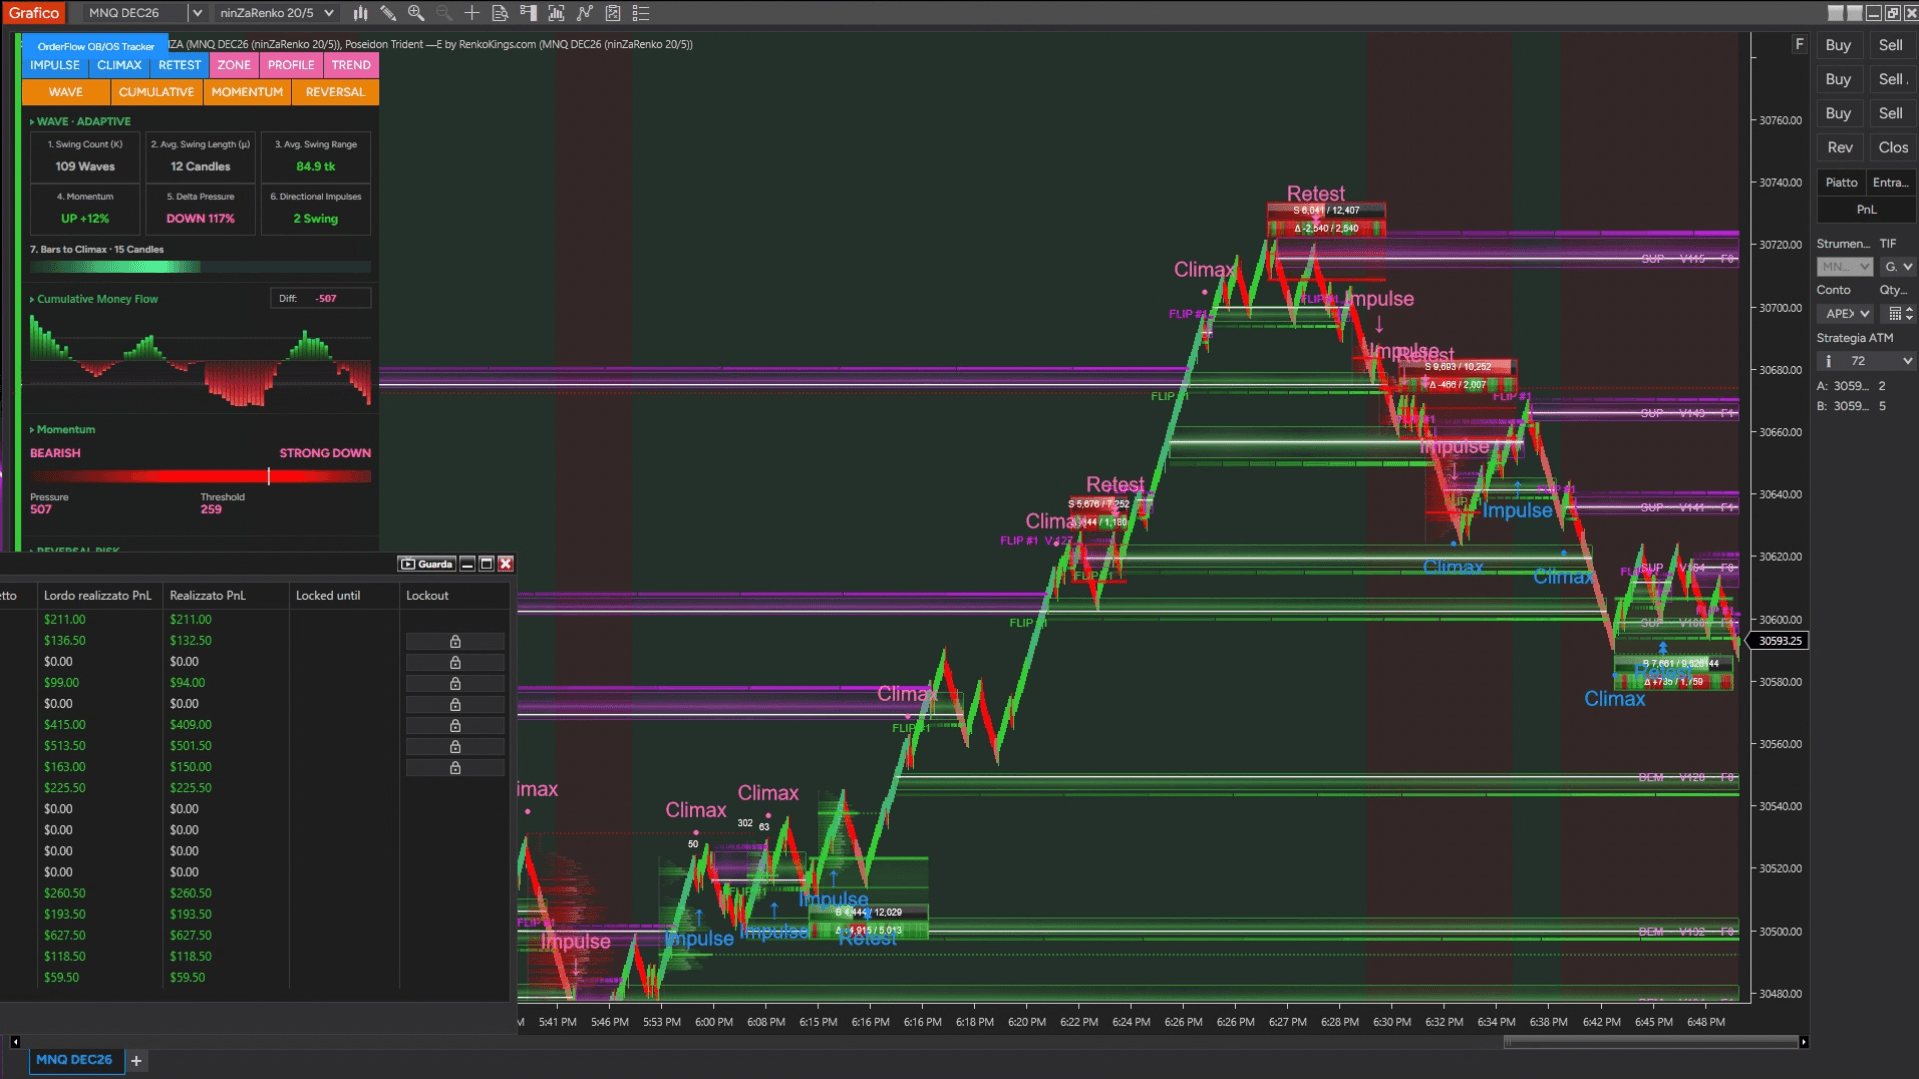
Let’s take a look at how one of our traders is using Poseidon Trident —E. He’s been doing some great work with it.
PRO TRADER SESSION · APEX EVALUATION
Nasdaq Futures on an Apex Evaluation Account
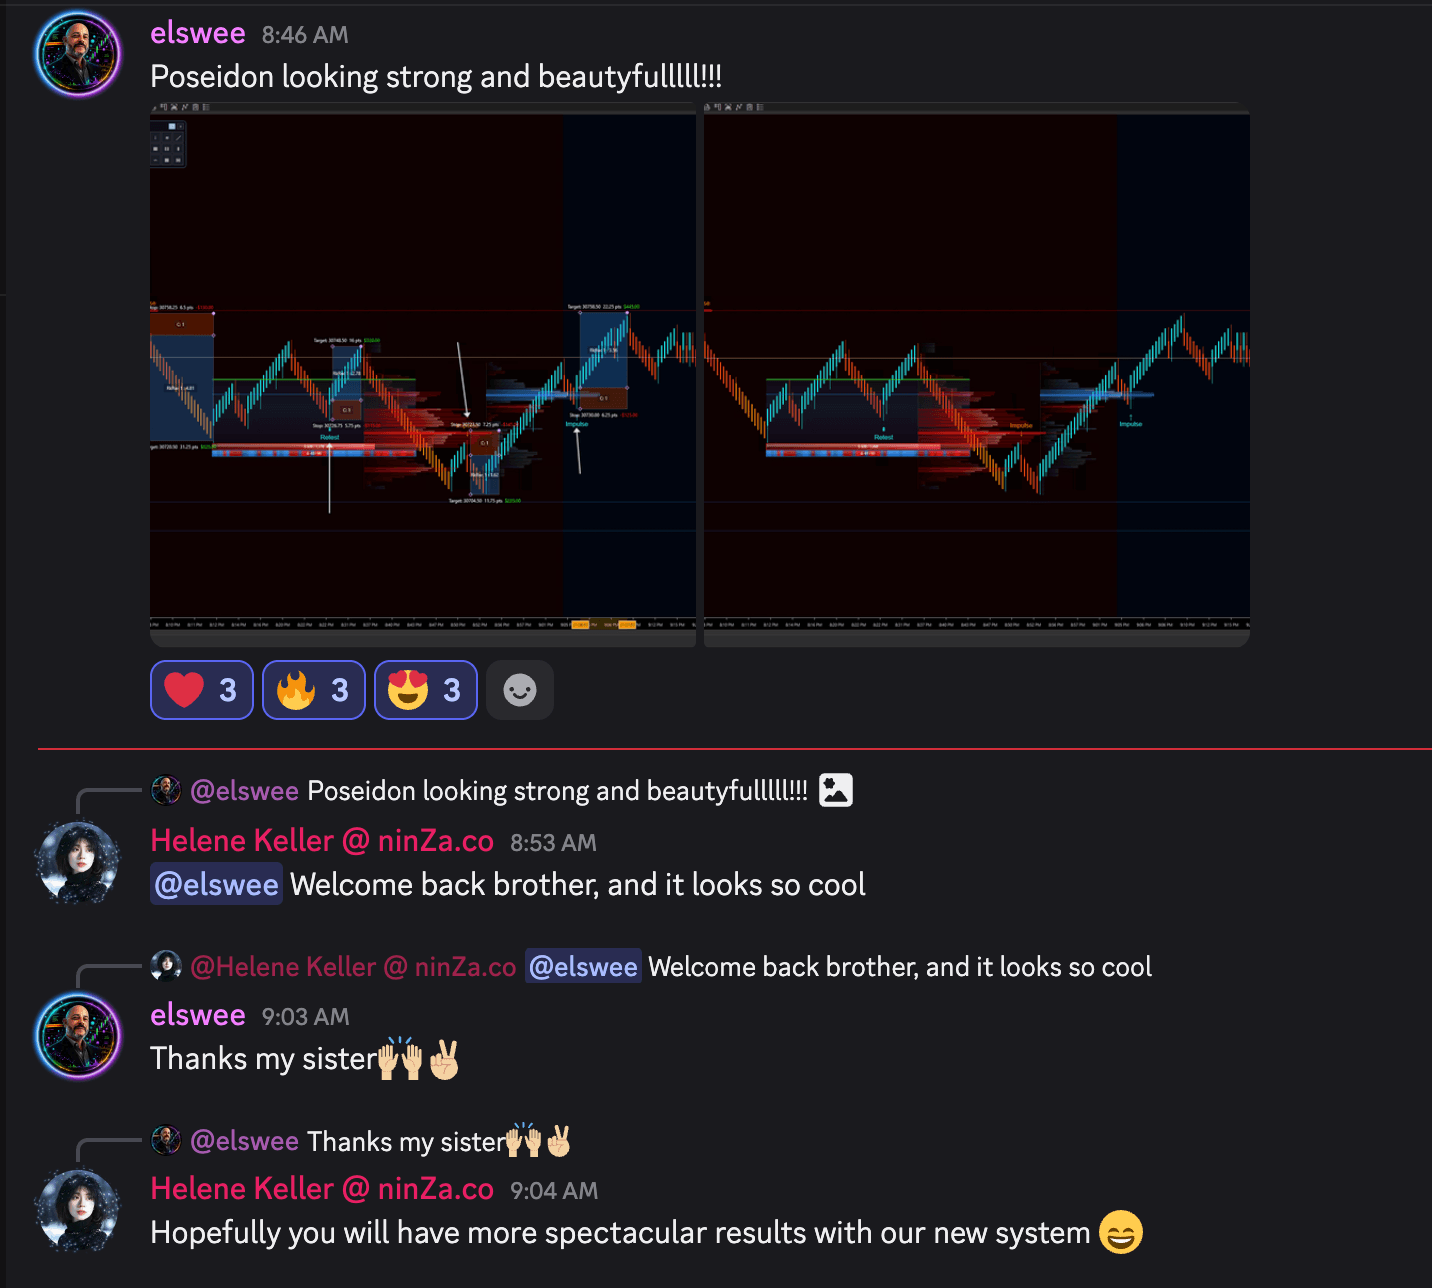
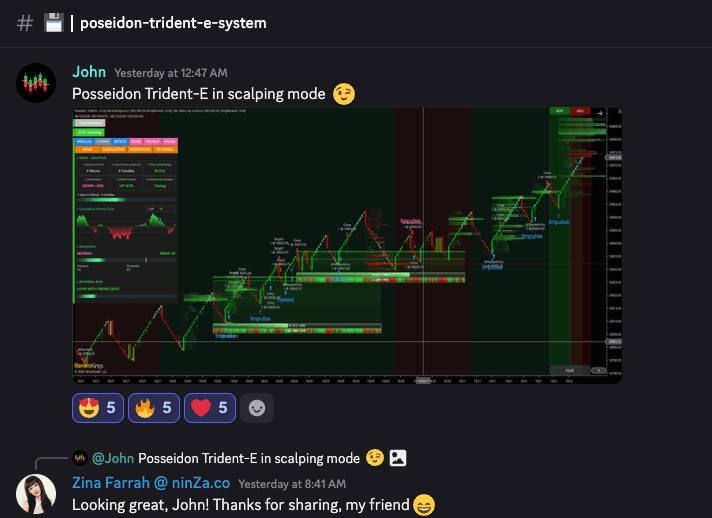
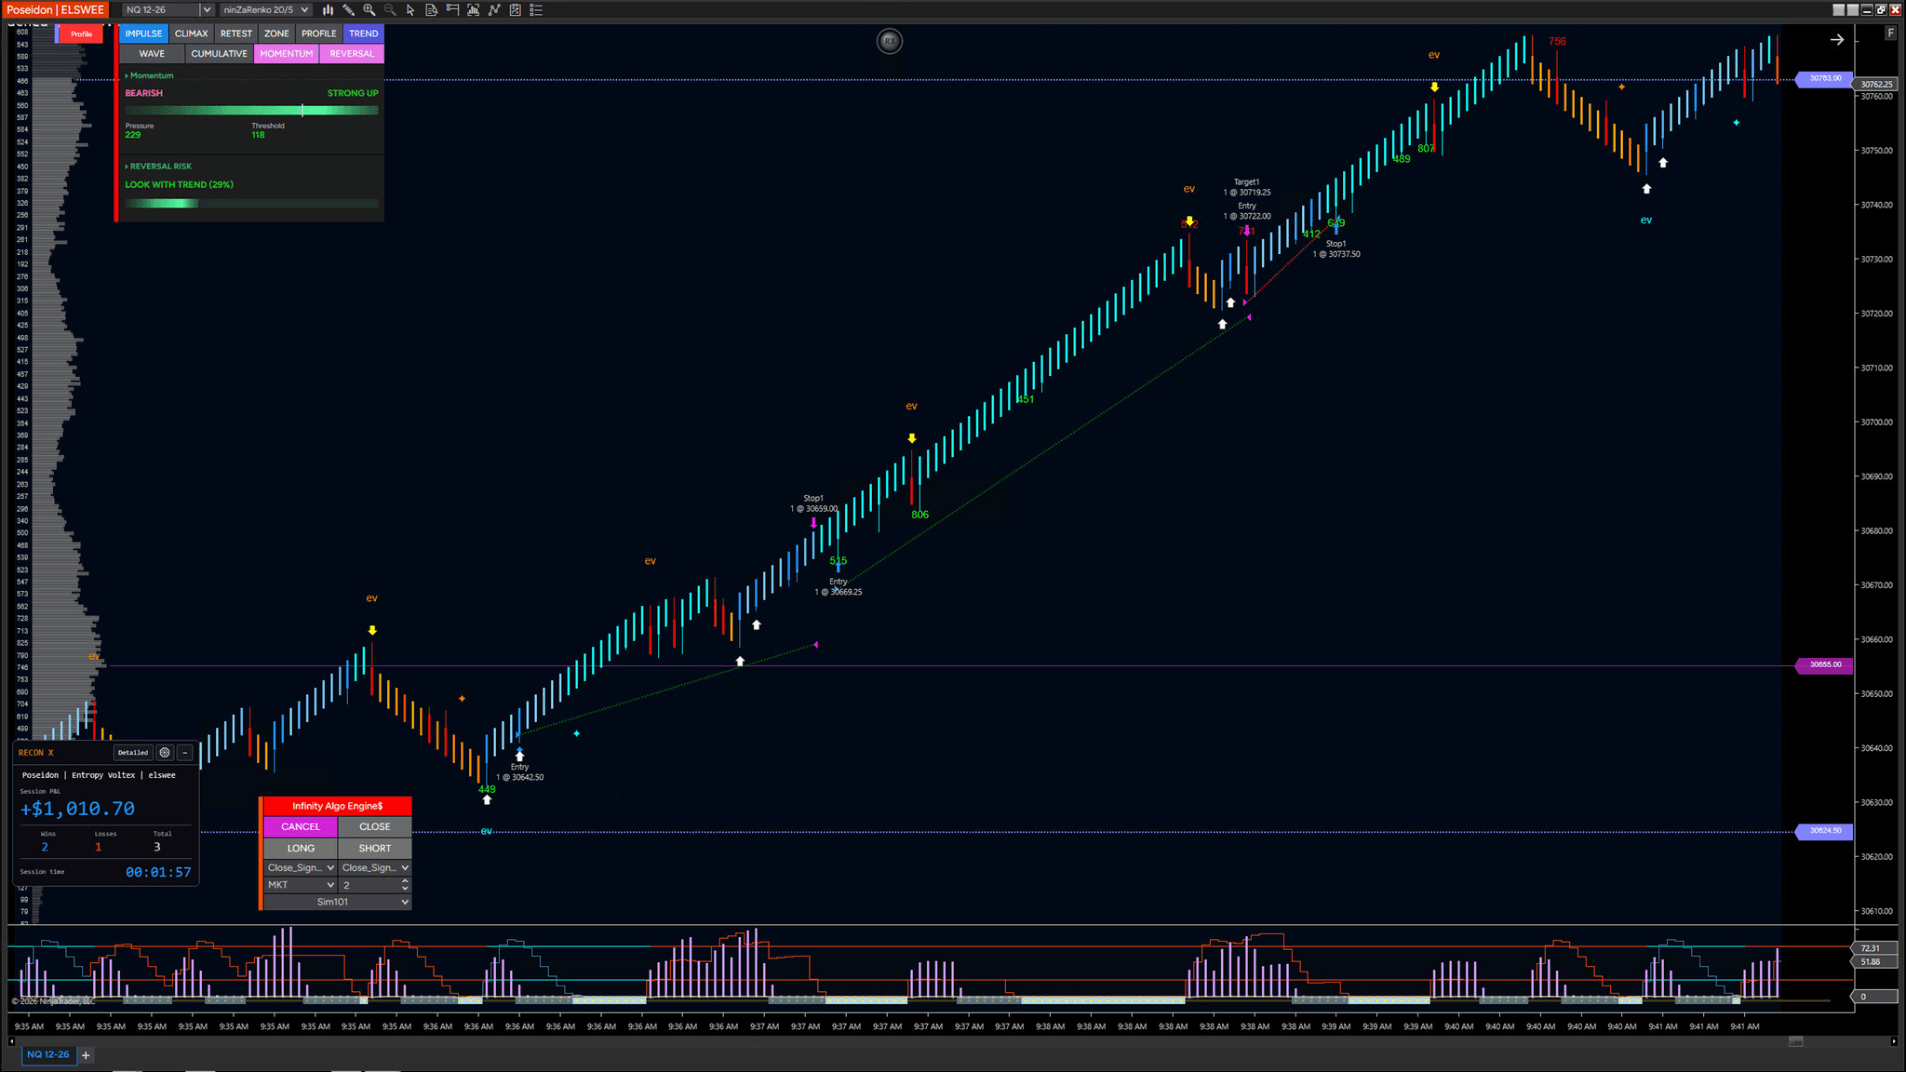
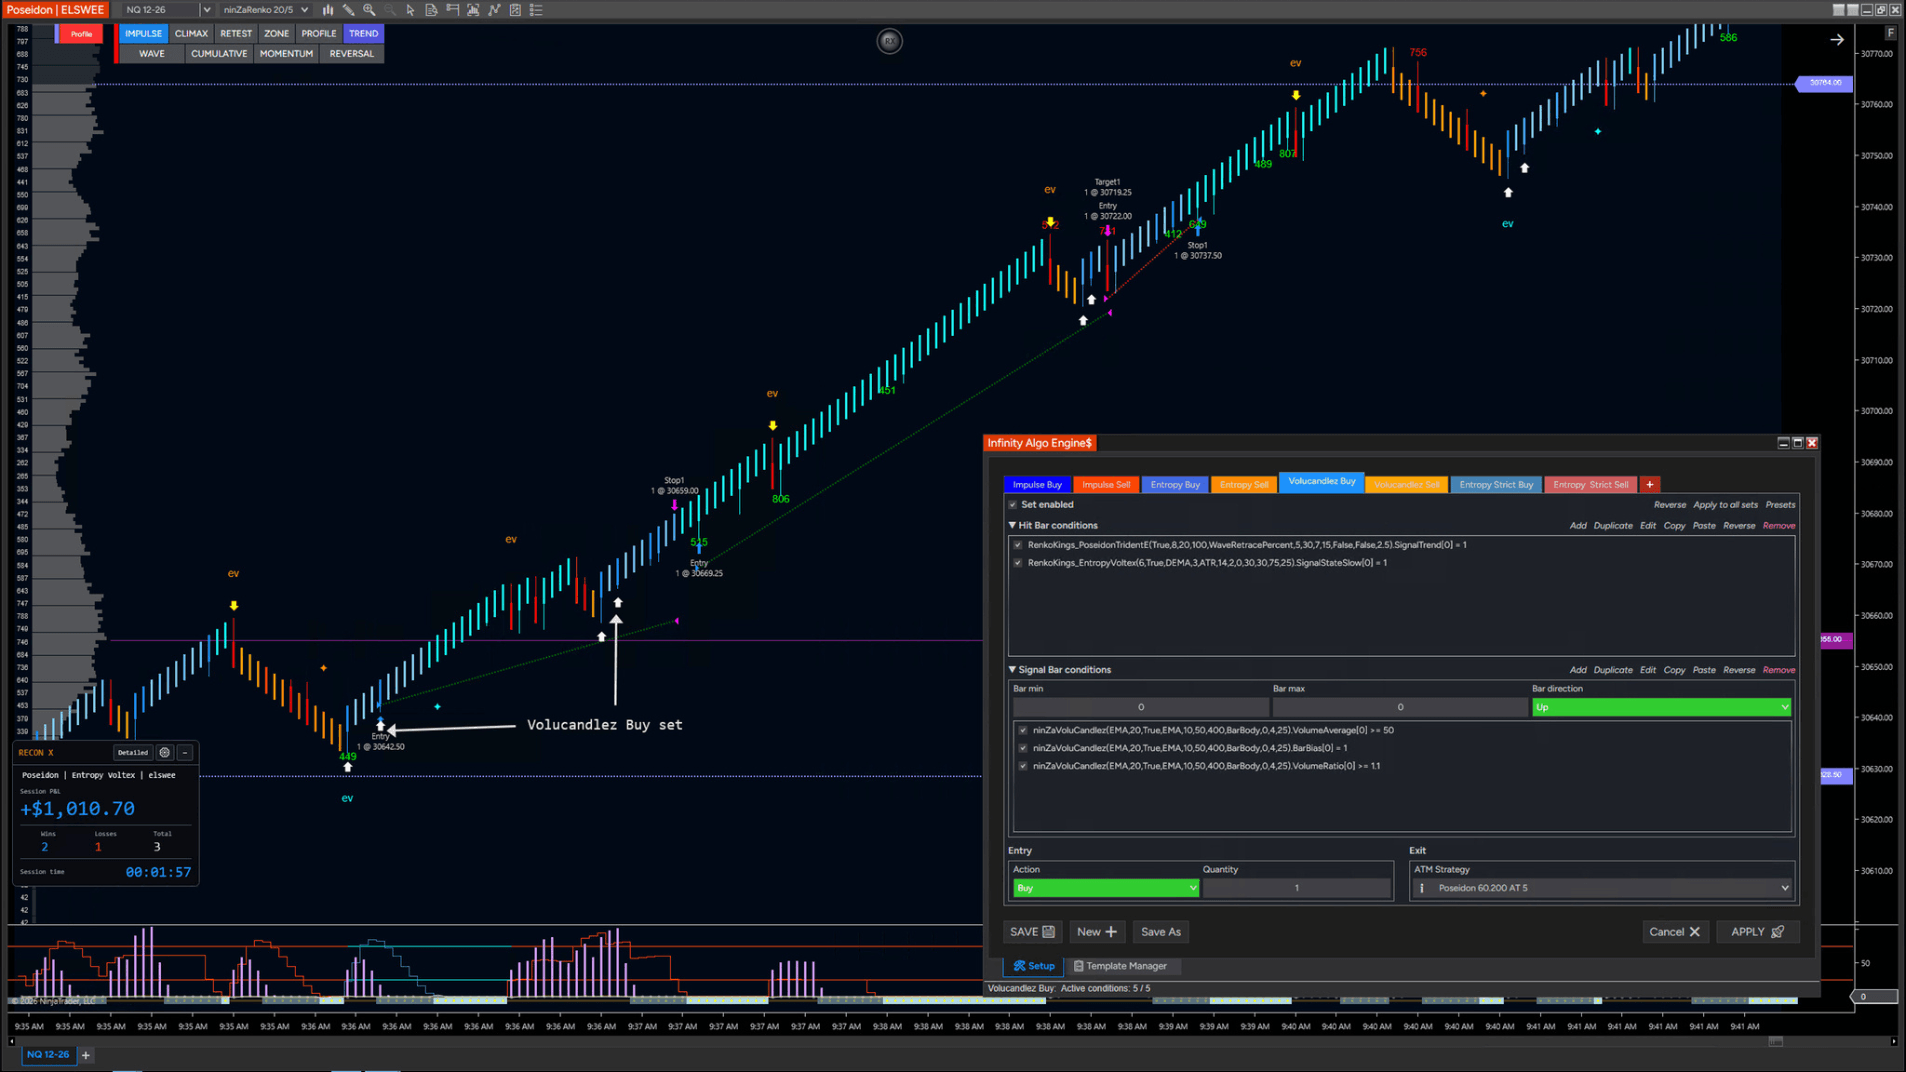
A session shared by our pro trader, Elswee, who used Poseidon Trident —E while trading an Apex evaluation account.
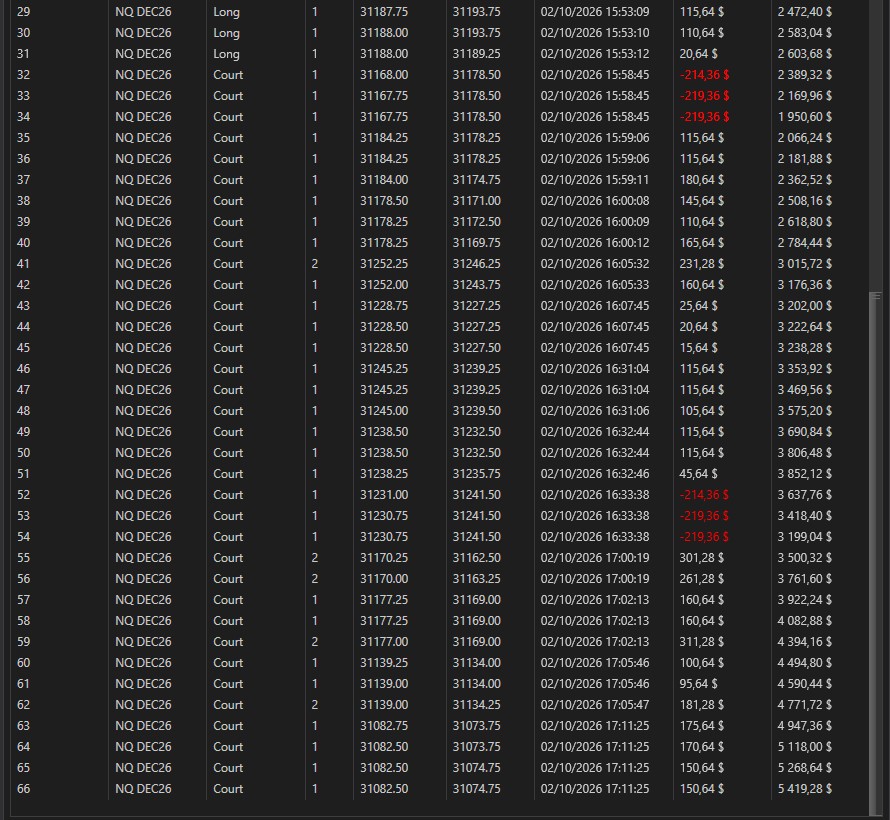
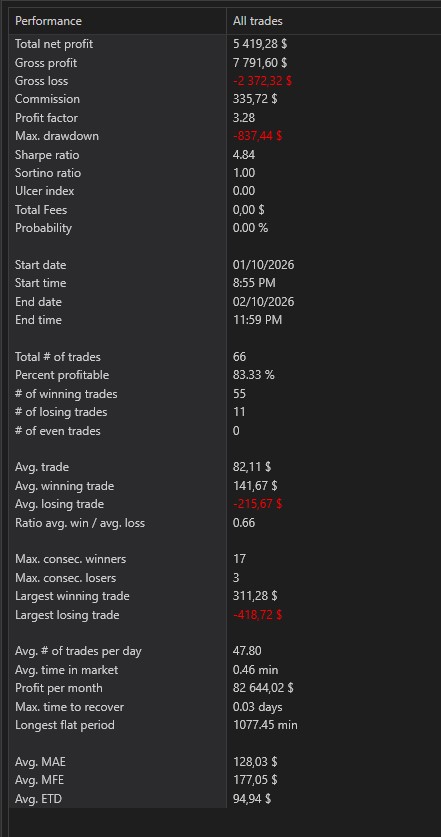
“2 trades, 9 minutes, $780, and done for the session.”
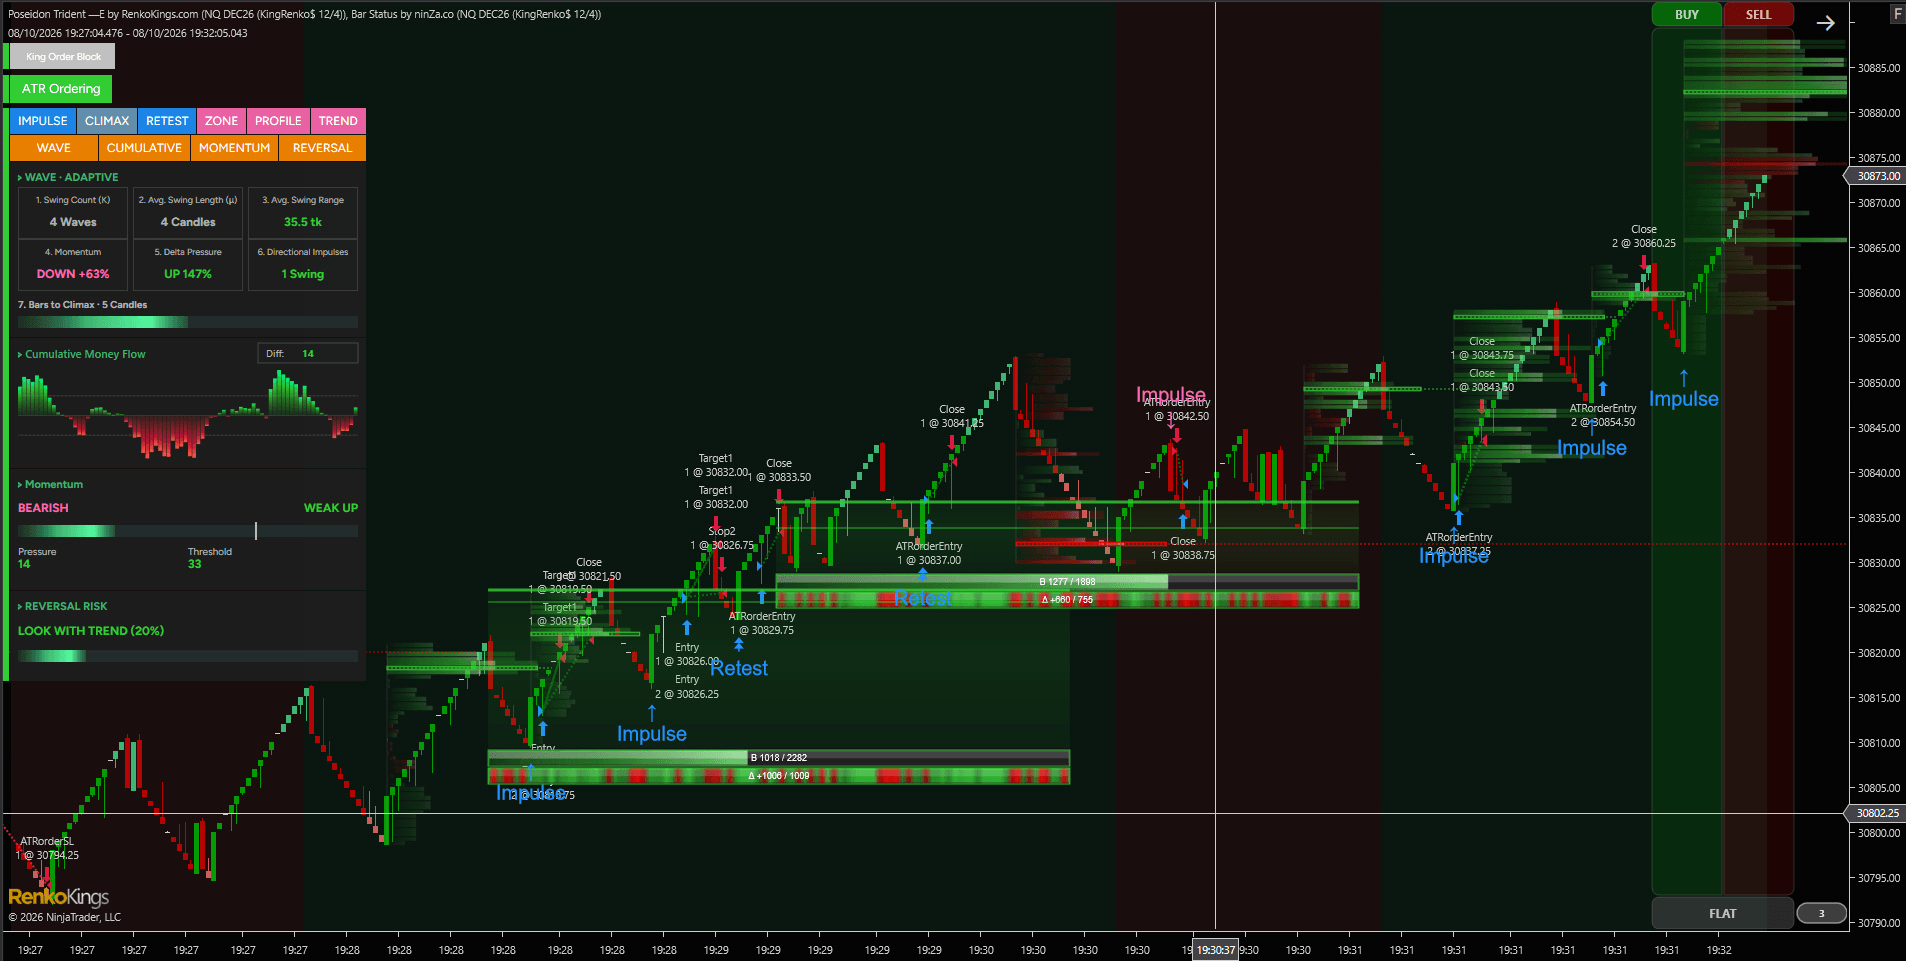
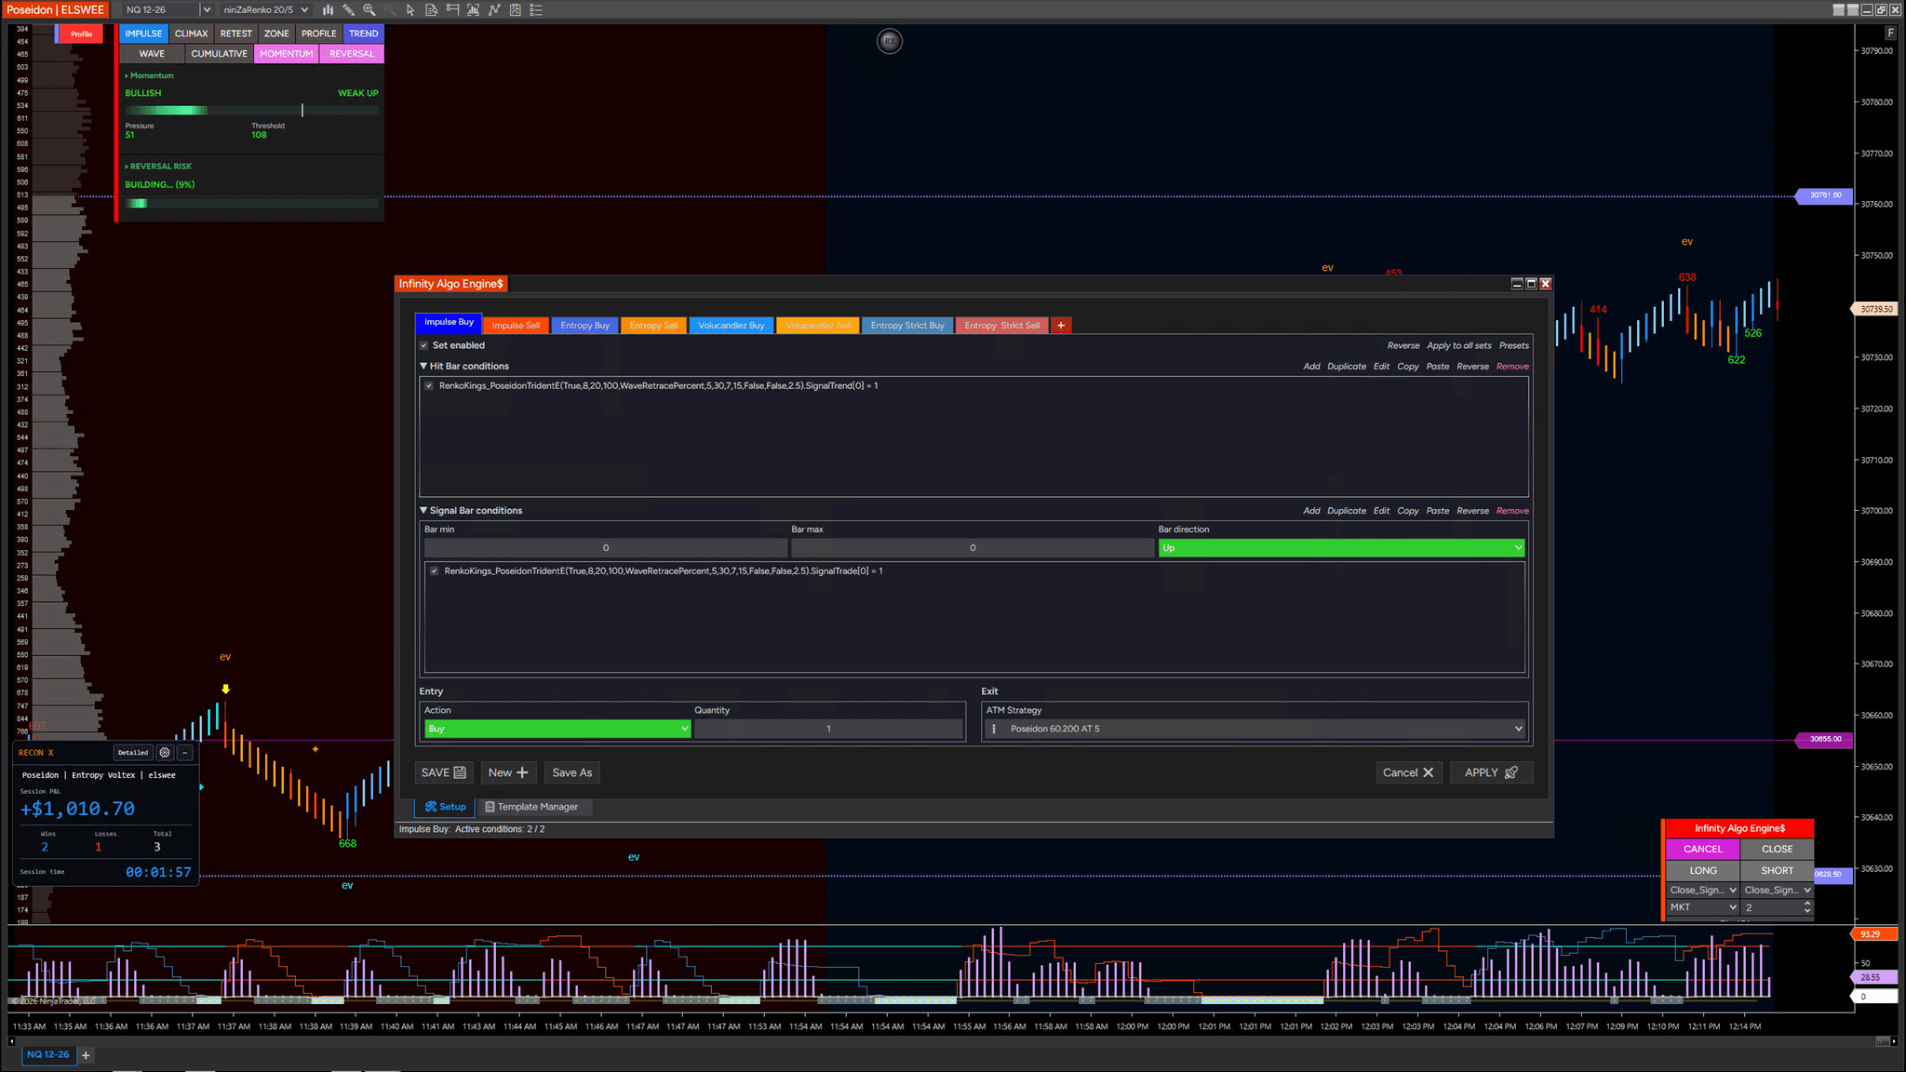
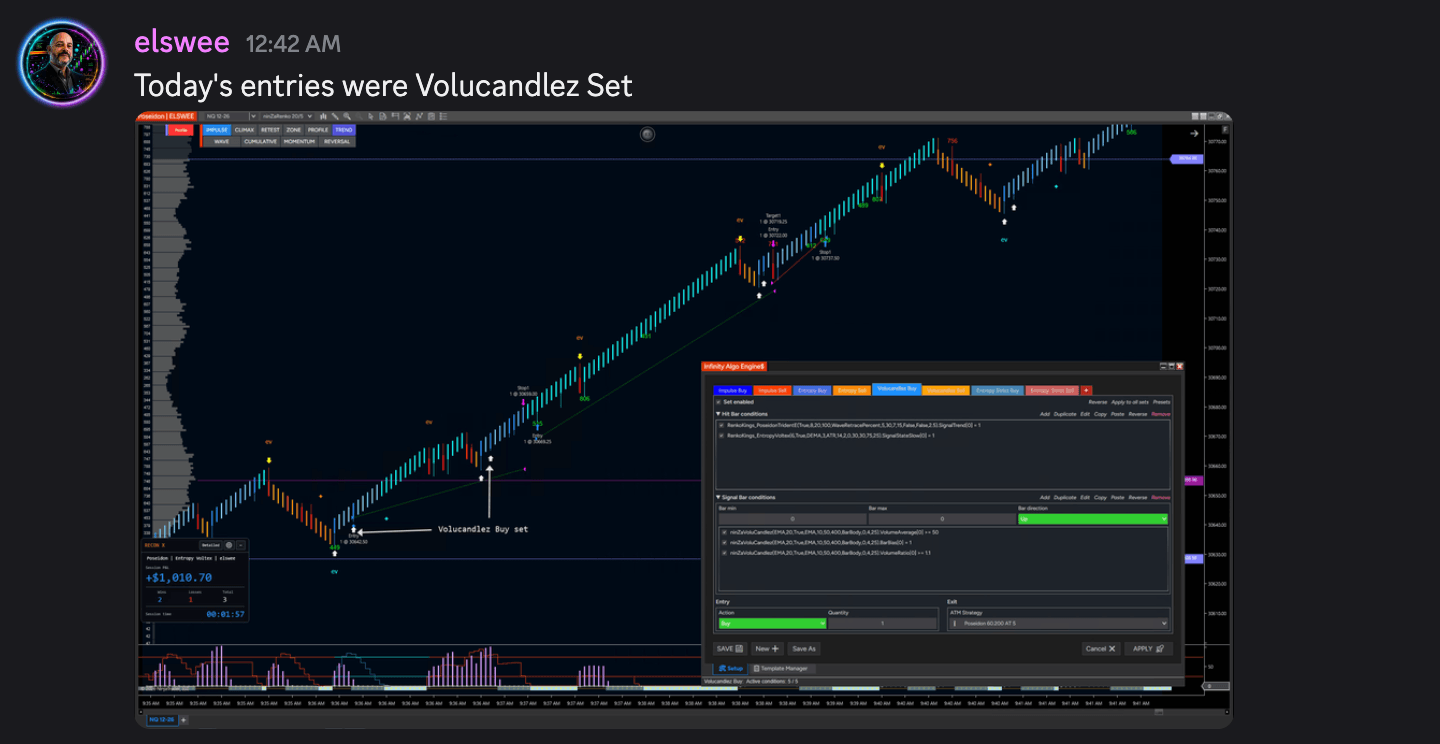
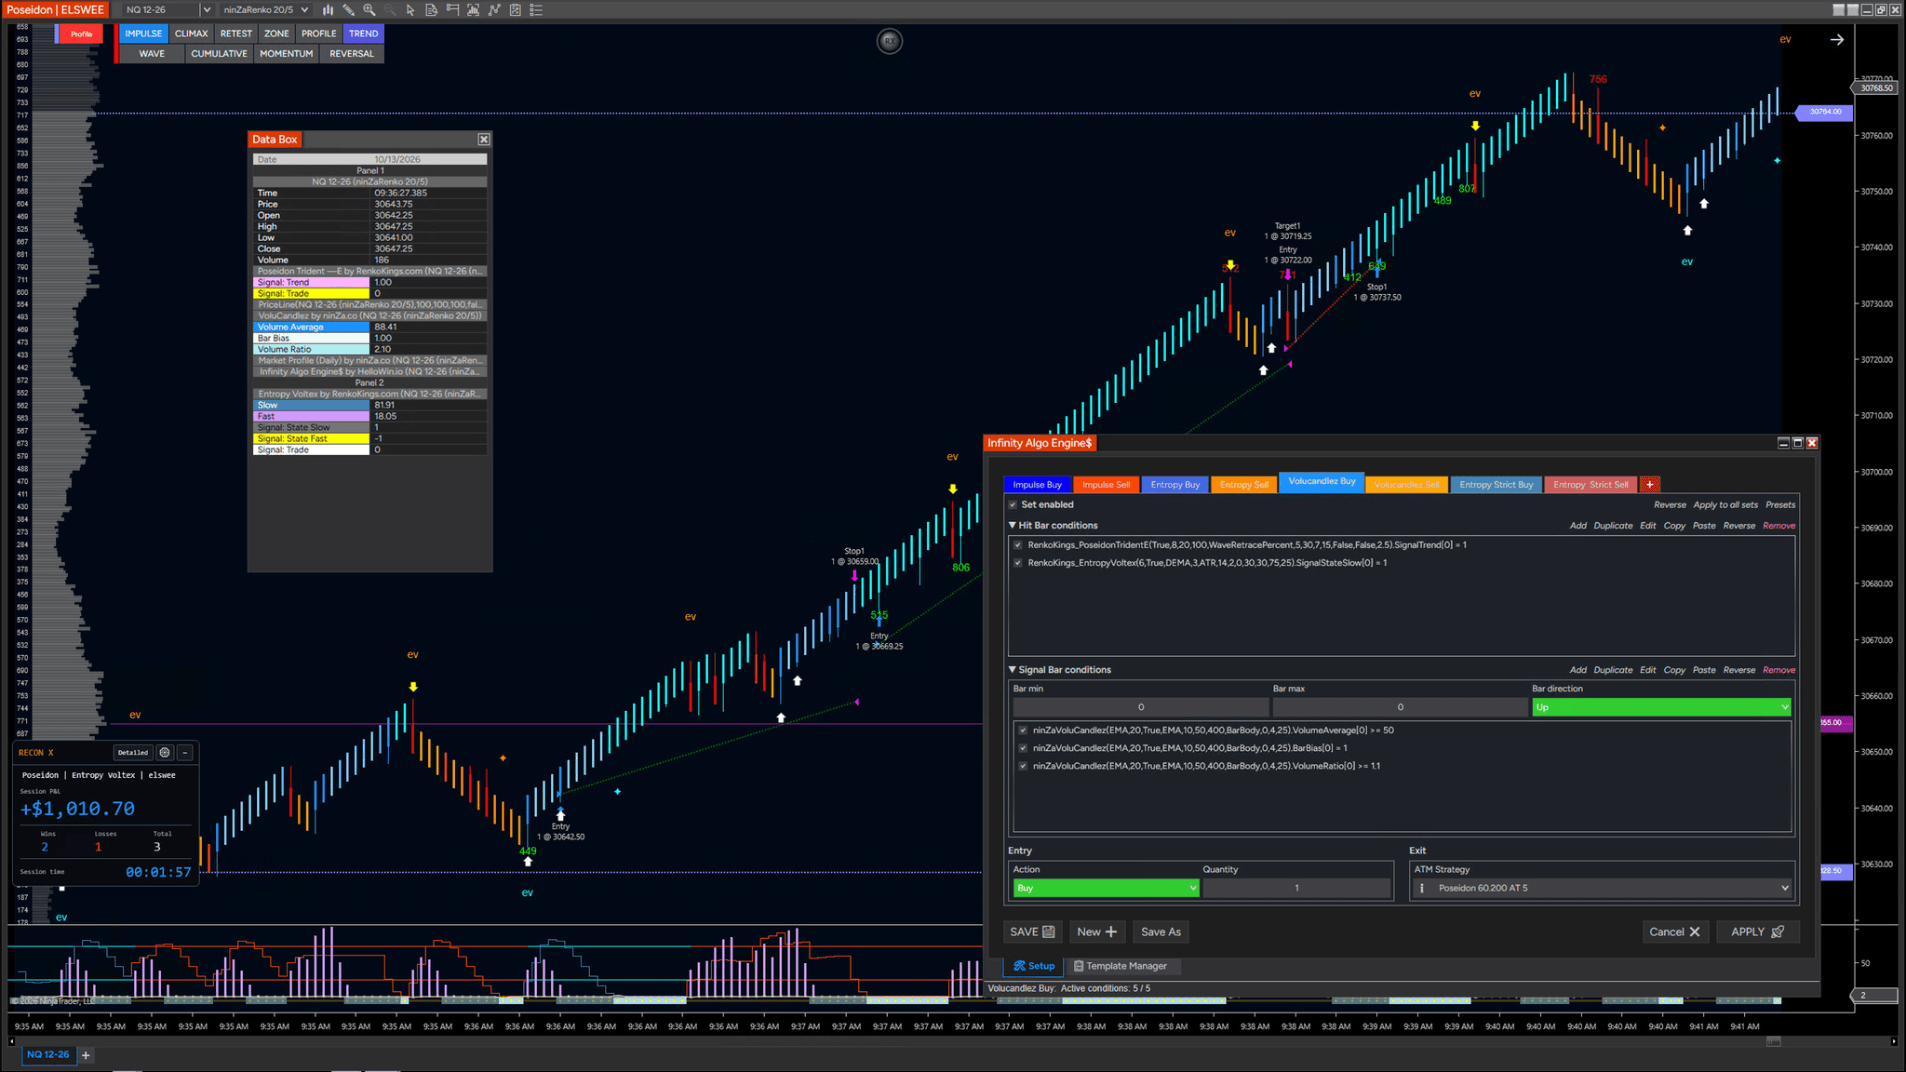
I used Poseidon Trident, Entropy Voltex, Market Profile, and Infinity Algo Engine to trade Nasdaq futures. I combine discretionary context with automated entries: Market Profile and a separate order flow chart help me assess the session range and decide when to enable the system. Infinity executes my configured setups, and an ATM handles trade management.
After the 9:30 open, I waited six minutes before enabling the system. The market was erratic, with frequent reversals and limited room for expansion. After two trades, I finished with $780, exceeding my $500 daily goal, and decided to stop.
— ELSWEE, PRO TRADER
TOOLS IN THIS SESSION
This video shows the tools in practical use under real market conditions, with analysis behind the decisions and the objective of passing an evaluation account.
Using the same ATM setup, the trader combined Poseidon Trident, Entropy Voltex, Market Profile, and Infinity Algo Engine on Sim101. The session finished at +$1,010.70, with two winners and one loser. Next, they plan to refine signal precision and ATM trailing.

08 / POSEIDON MANUAL
Learn how Poseidon Trident —E reads Renko Wave behavior, generates signals, and uses Dashboard context to evaluate opportunities.
09 / WEBINAR & NINZA DIRECT
Join webinars and NINZA Direct sessions with our Trading and Support Teams.

10 / QUESTIONS YOU MAY BE ASKING
3 practical questions traders often ask before bringing a new system into their workflow.
Poseidon Trident —E approaches the market differently. Instead of adding another conventional calculation over price, it studies how consecutive Renko bars organize into Waves and how each Wave compares with recent market behavior. You can evaluate that approach in your own workflow for up to 30 days through Zuture Exchange.
No. Impulse, Retest, and Climax represent three different market conditions. The Dashboard adds supporting context so you can understand why a signal appears rather than reacting to the marker alone. The Manual and direct team guidance help you evaluate those opportunities properly.
You do not need to begin as a Renko specialist. The system organizes Renko movement into Waves, market states, and clearly defined opportunity types. The included Manual, onboarding, webinars, and NINZA Direct sessions help you build the workflow step by step.
11 / SUPPORTED ACCESS
Access Poseidon Trident —E as a standalone system or combine it with advanced NINZA tools.
Every option includes lifetime updates, direct setup assistance, and a Voucher-F for your next eligible NINZA purchase.
POSEIDON FOUNDATION
Build your Renko Wave foundation with the complete system and personalized guidance around your market, chart, and workflow.
STANDARD ACCESS: $800
Current supported access
DAYS TO FIND THE RIGHT FIT
A system can look promising in a demonstration, but the real test is how well it fits the way you trade. Use Poseidon Trident —E with your own markets, Renko configurations, chart templates, and real-time workflow.
If it is not the right fit, request an exchange for another eligible NINZA product through Zuture Exchange within 30 days.
Ψ
THE NEXT WAVE
Bring signals, Wave strength, momentum, market pressure, and reversal risk into one connected view—so you can understand not only where an opportunity appears, but how the movement behind it is developing.
Sign in
Log in with your Ninza account to continue.
Welcome back! Please log in to continue.
Create a free account to get started.