
Curated indicator combos available at the strongest exclusive offers. Explore now →
Sale!
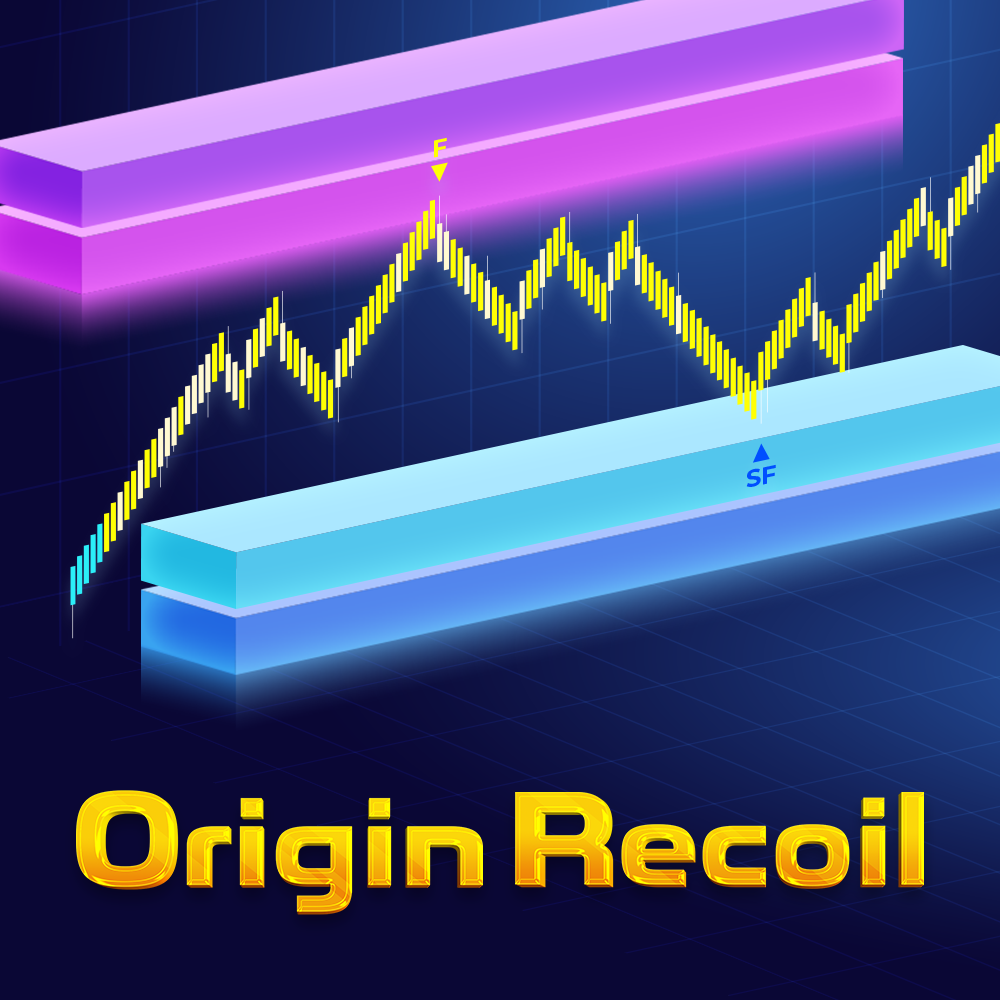
Origin Recoil
Original price was: $596.$200Current price is: $200.
Description
Origin Recoil – See the true strength behind every price move
Most traders spend years learning how to read price charts, focusing on structure, support, and resistance levels, breakouts, and patterns.
Over time, they become skilled at identifying where the price is moving and what it is doing on the chart. But there is 1 critical dimension that is almost always ignored:
SPEED
This is exactly the gap that Origin Recoil is designed to solve.
On most chart types, including time-based charts, every candle is printed regardless of how meaningful the underlying activity is. A slow, low-participation move can produce candles that look nearly identical to those formed during aggressive, high-momentum conditions.
On Renko charts, the issue becomes even more pronounced:
- Every brick is the same size
- A move that forms in milliseconds looks identical to one that takes much longer
- The intensity behind the move disappears completely
The solution: Bring time back into the Renko chart
Origin Recoil was built to solve exactly this problem. Instead of focusing only on price structure, it measures something most indicators completely ignore:
The speed at which each candle forms – down to the millisecond
By comparing this speed to recent market behavior, Origin Recoil reveals:
- Whether a move is backed by strong, aggressive participation
- Whether momentum is increasing or fading
- Whether price is likely to continue in the same direction
- Where meaningful activity is actually entering the market
This provides a level of clarity that traditional price-based analysis simply cannot offer.
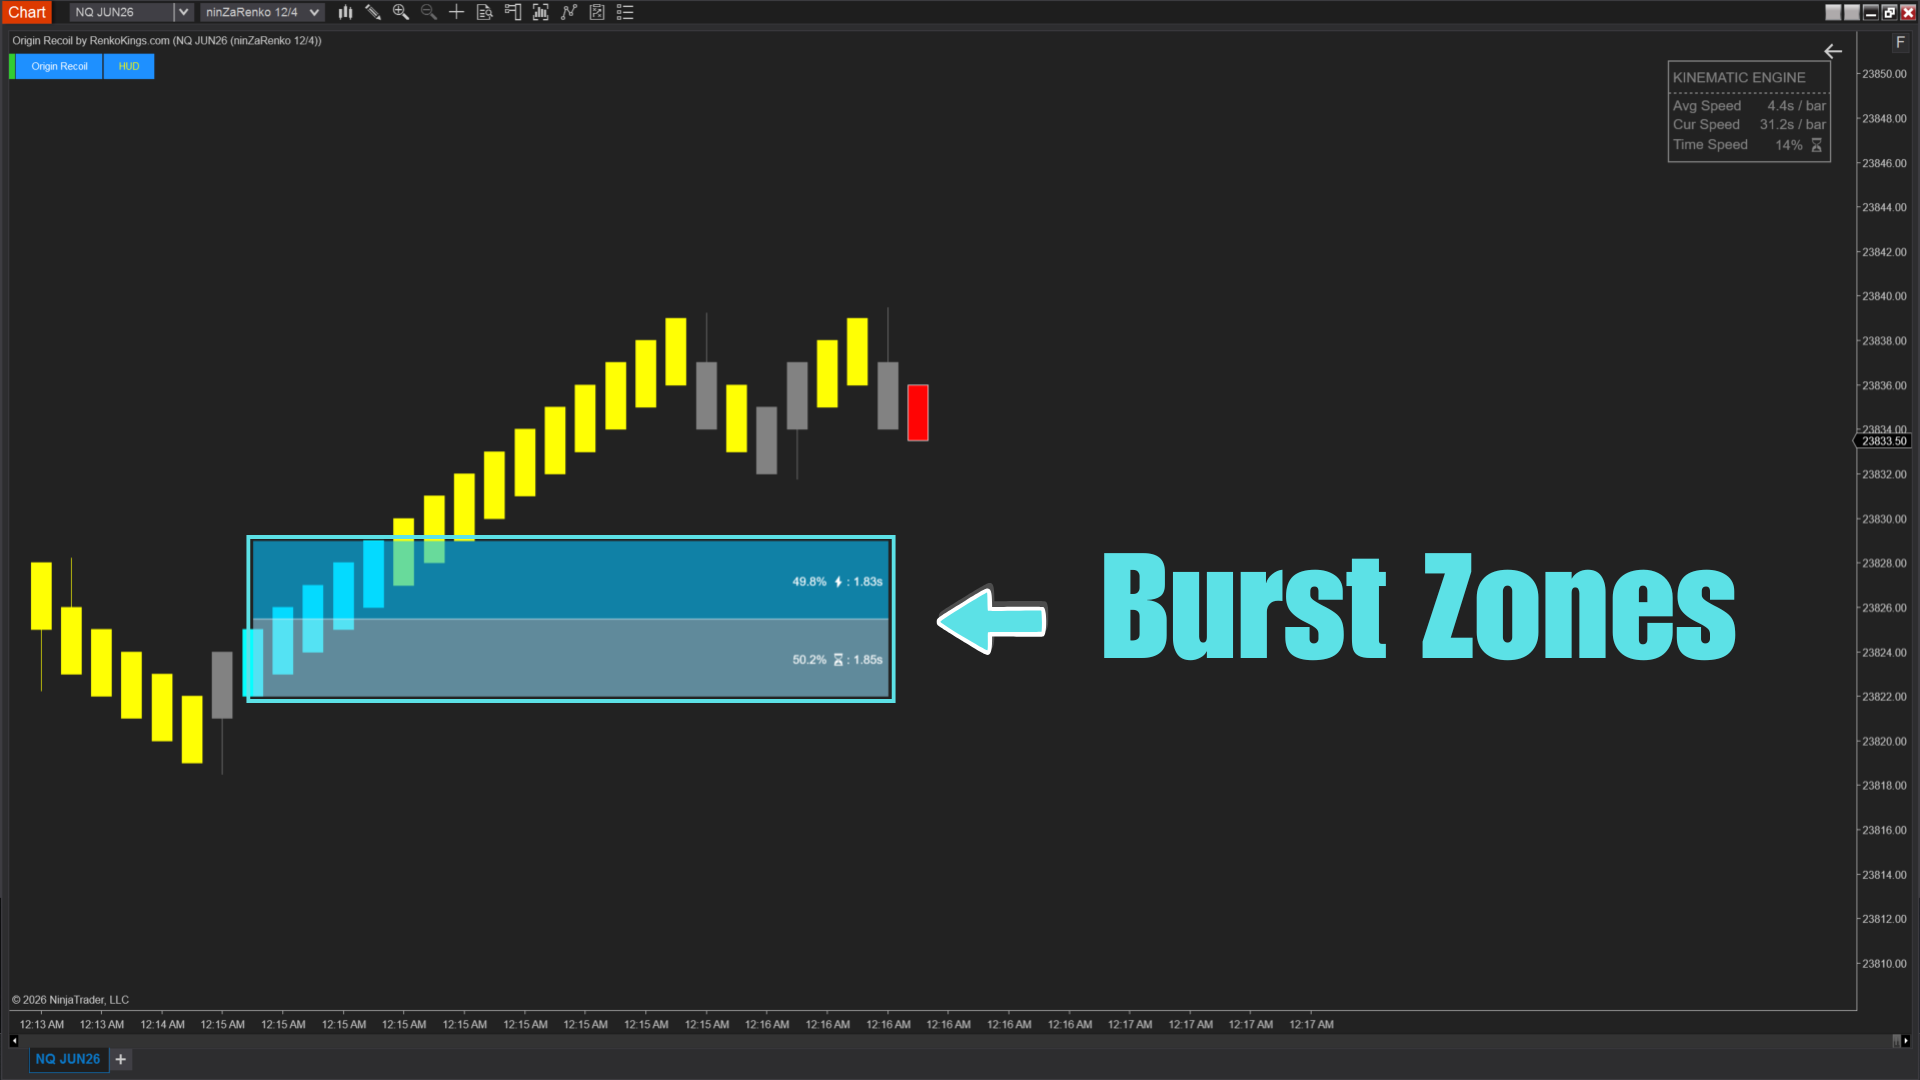
Burst Zones – Where momentum becomes visible
At the core of Origin Recoil is the concept of Burst Zones. These are areas where price begins to move significantly faster than normal market conditions.
Rather than relying on candle patterns or structure alone, the indicator continuously:
- Measures the formation speed of consecutive candles
- Compares that speed to the average speed of recent candles
- Detects when acceleration becomes abnormal
When this happens, a Burst Zone is formed.
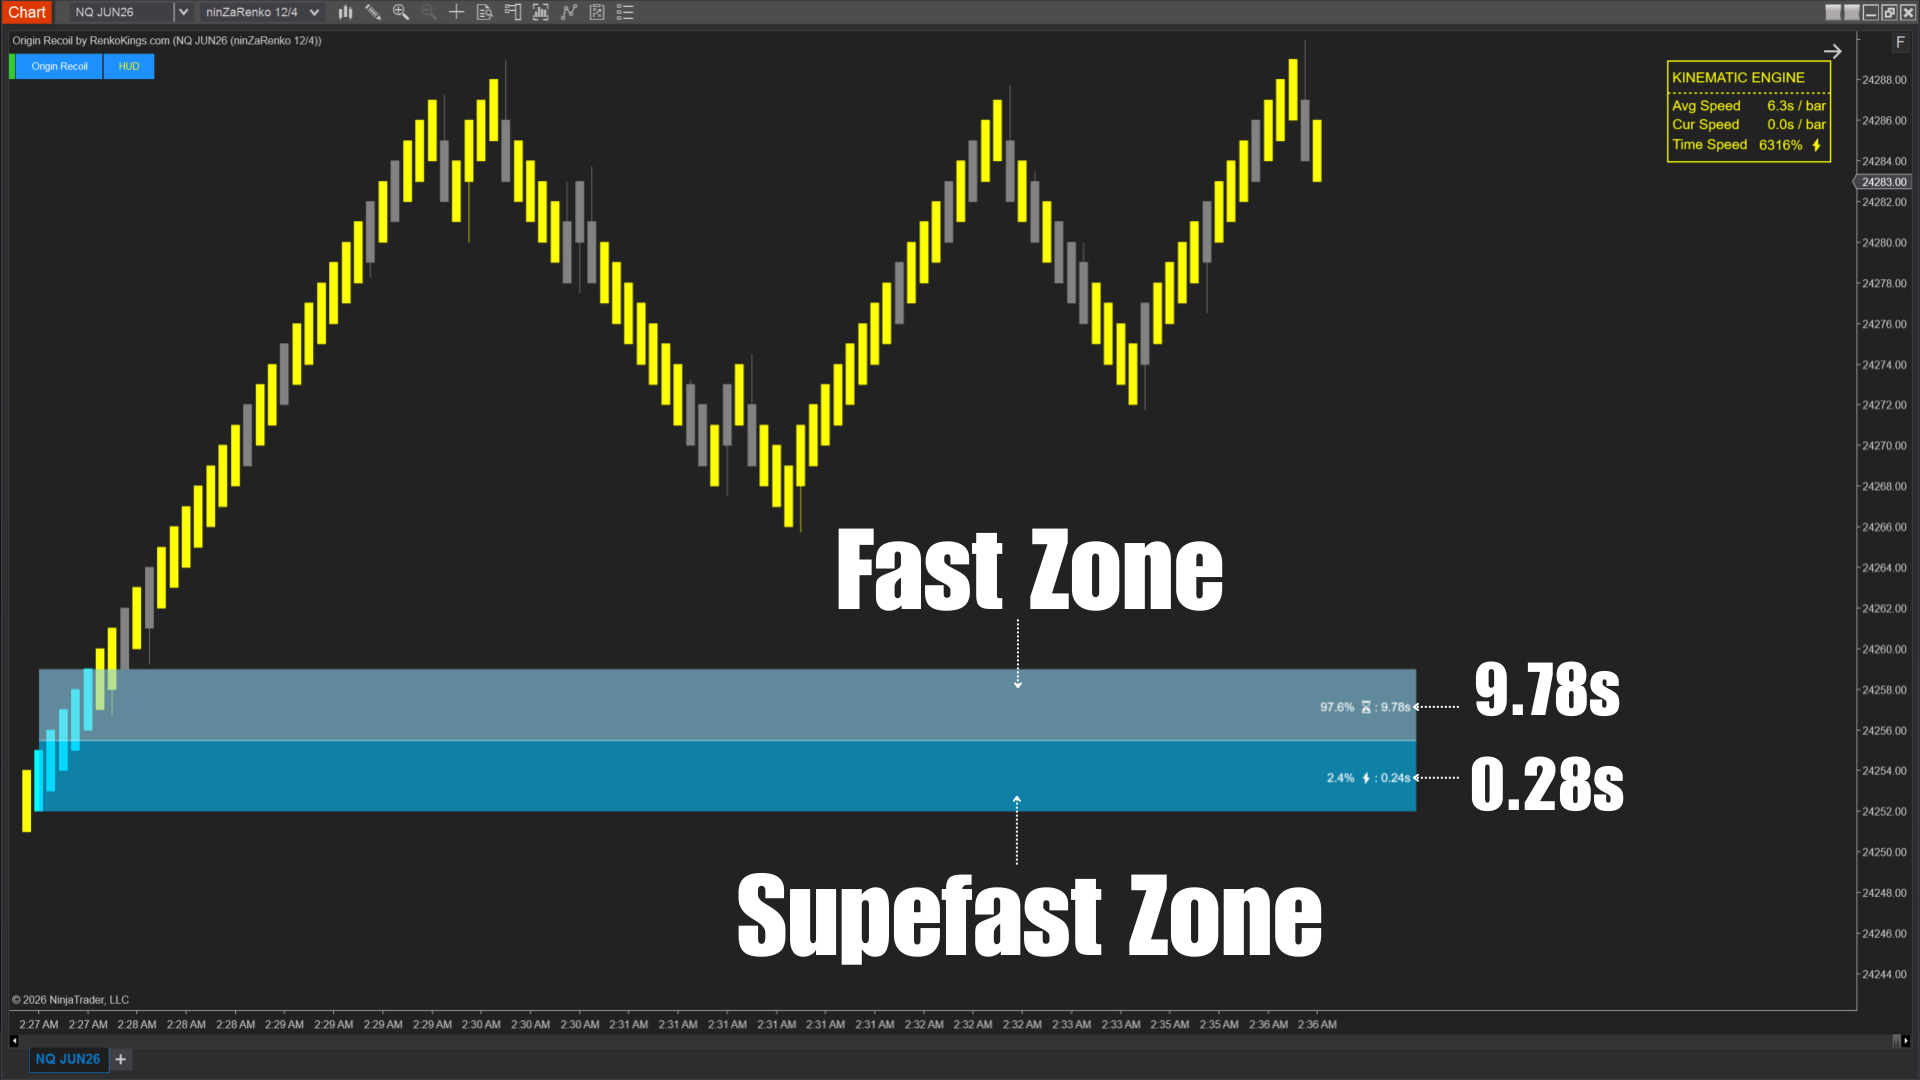
Understanding the strength of each move
Not all high-speed movements carry the same level of strength. That’s why Origin Recoil classifies Burst Zones into 2 categories:
Zone Type
Description
Trading Implication
Fast Zone
Indicates strong momentum relative to recent conditions
Good for structured entries after a pullback
Superfast Zone
Indicates extremely aggressive acceleration
High probability of immediate continuation
This distinction helps you quickly understand how powerful a move really is, instead of treating all breakouts the same way.
See momentum evolve inside the move
One of the most unique aspects of Origin Recoil is that it doesn’t just show where momentum exists – it shows how that momentum evolves within the move itself.
Each Burst Zone is divided into 2 internal layers:
- If the 2nd half forms faster, momentum is accelerating
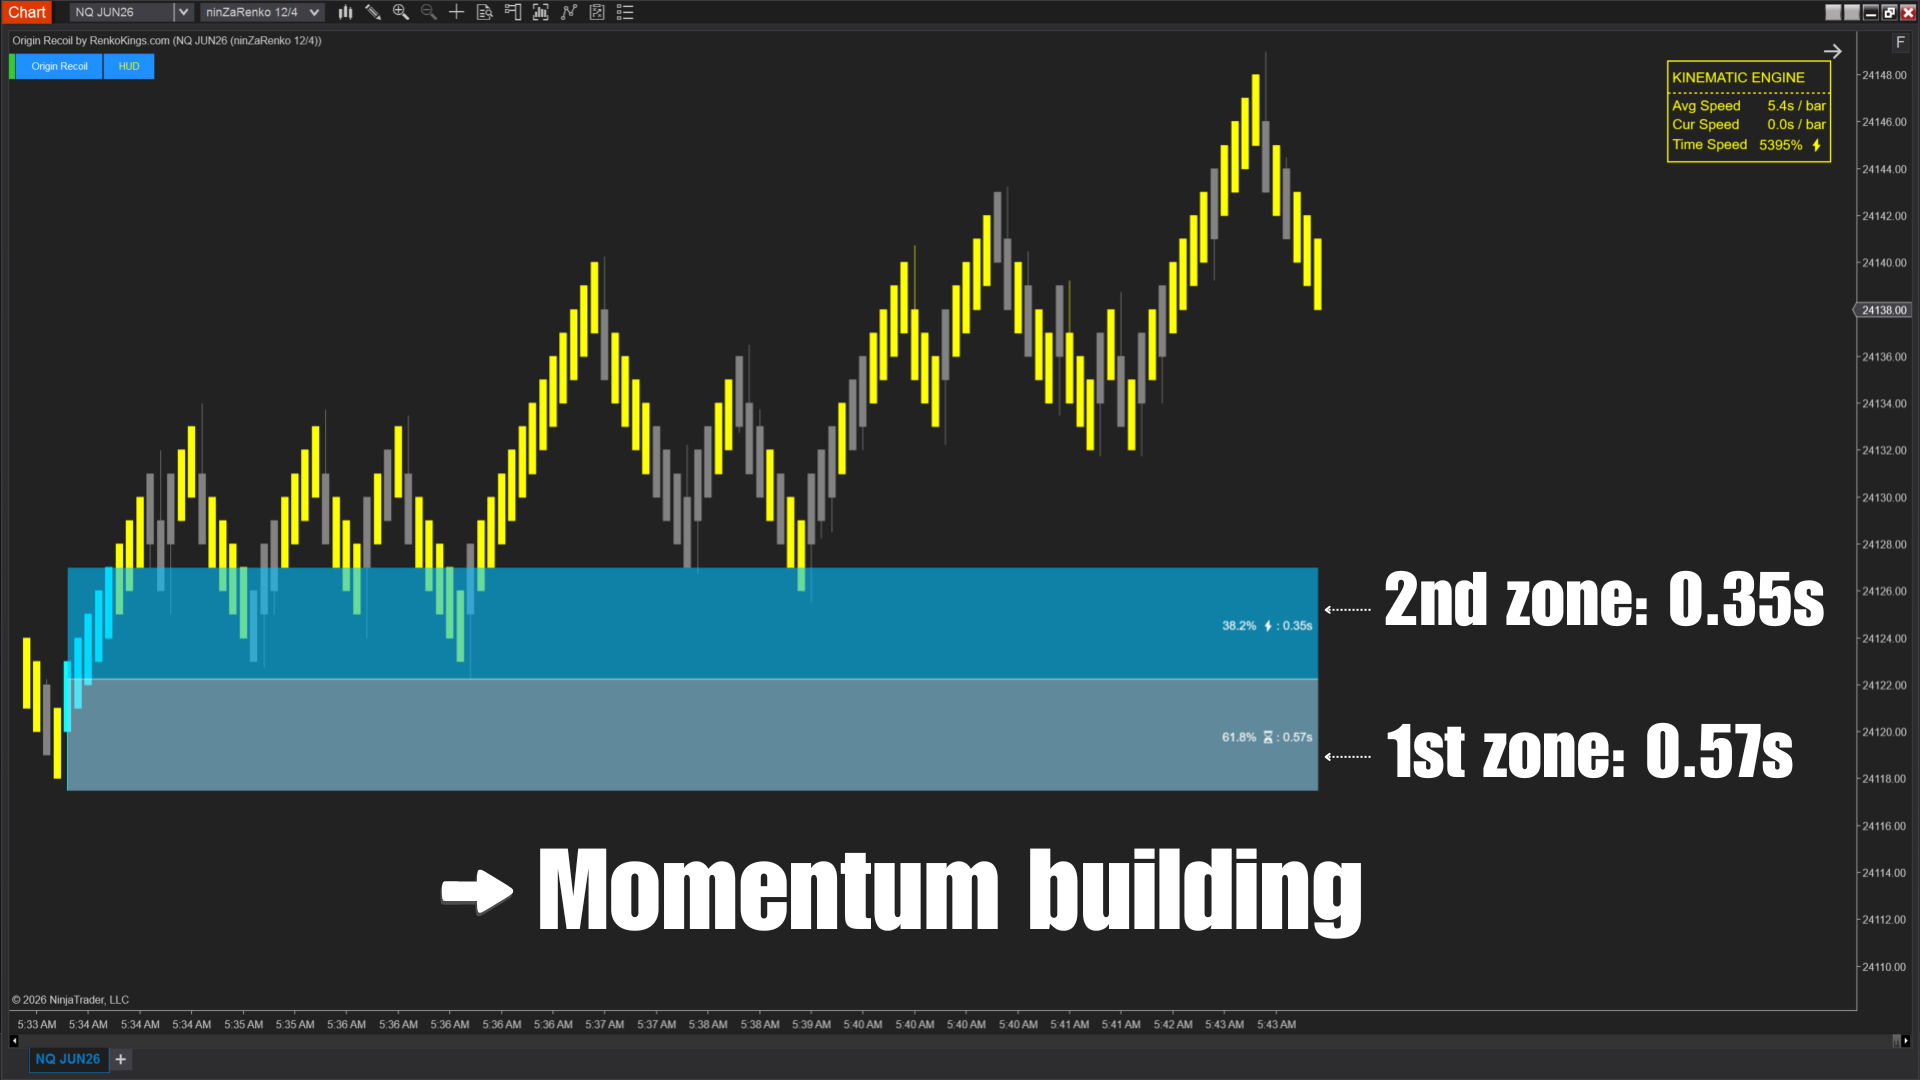
- If the 1st half forms faster, momentum is weakening
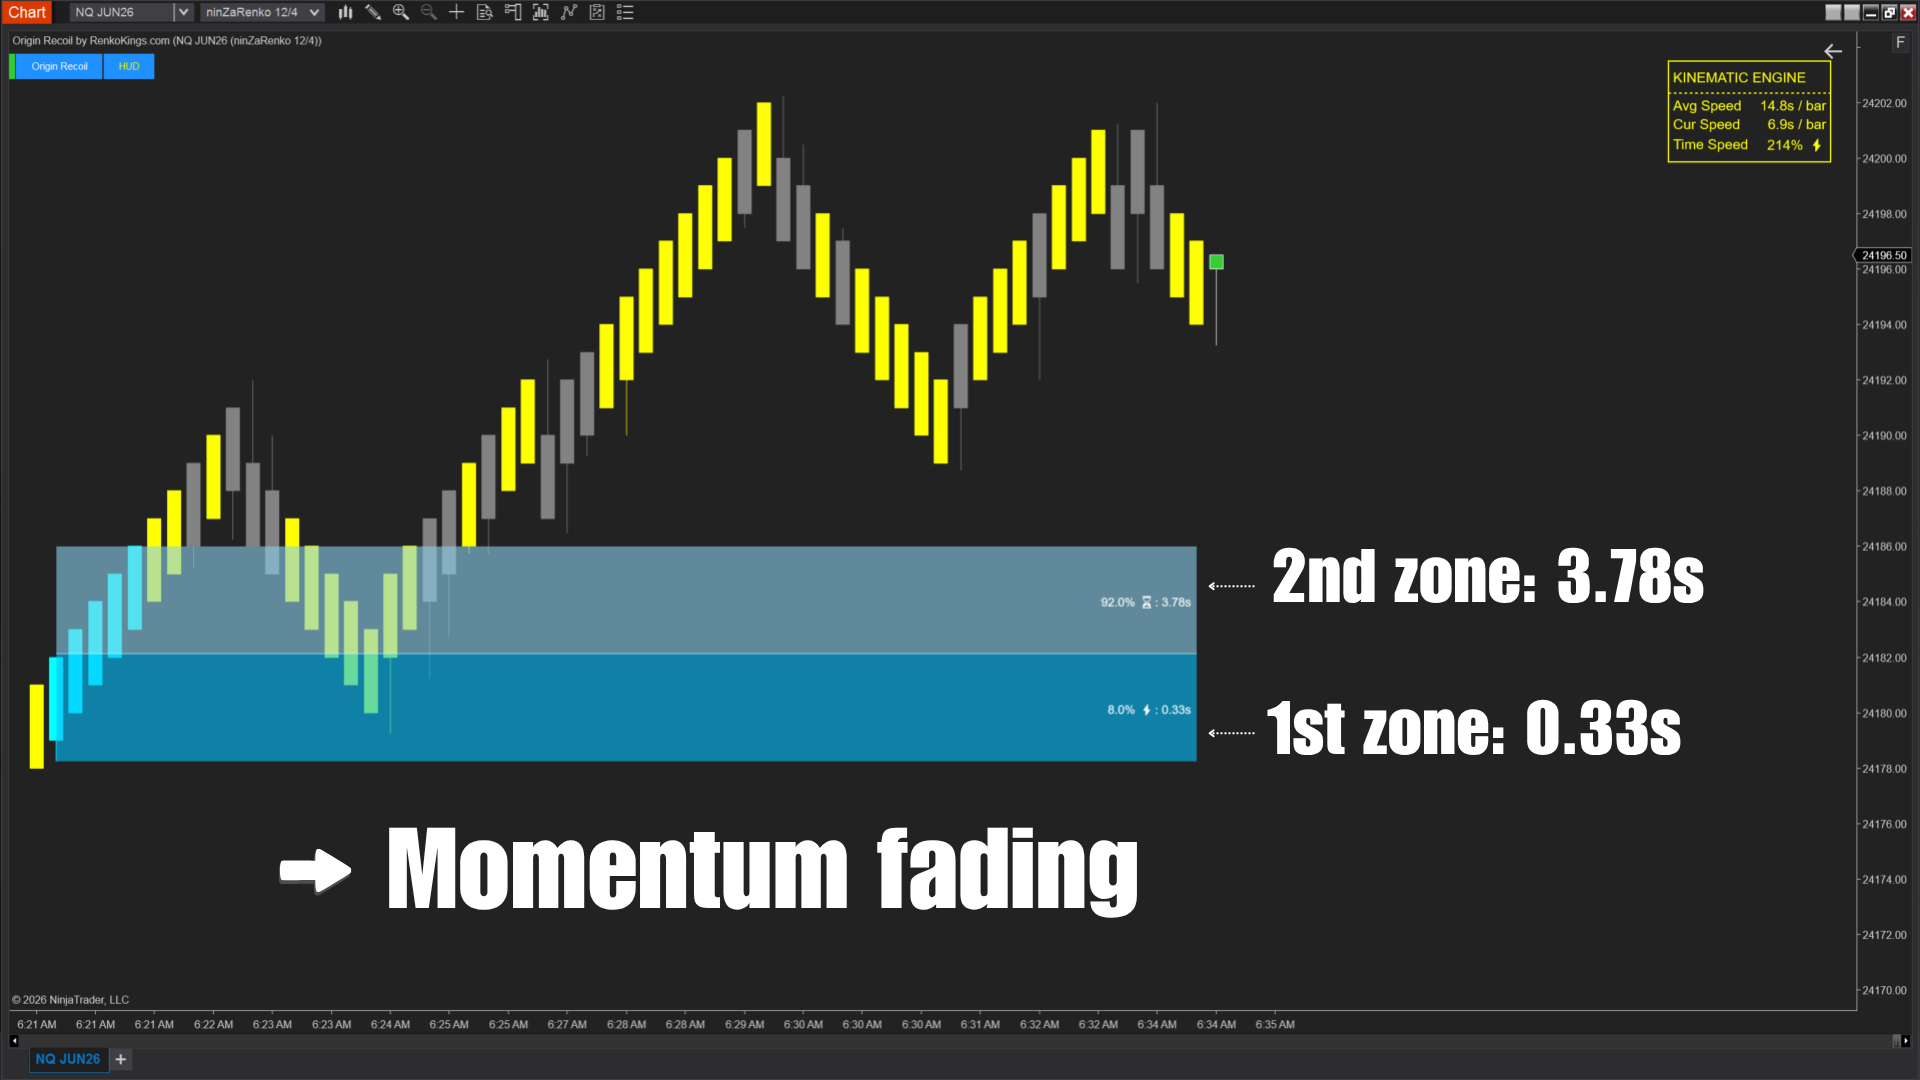
This provides a deeper level of insight:
- Is the move gaining strength?
- Or is it already losing energy?
That information becomes incredibly valuable when price returns to the zone.
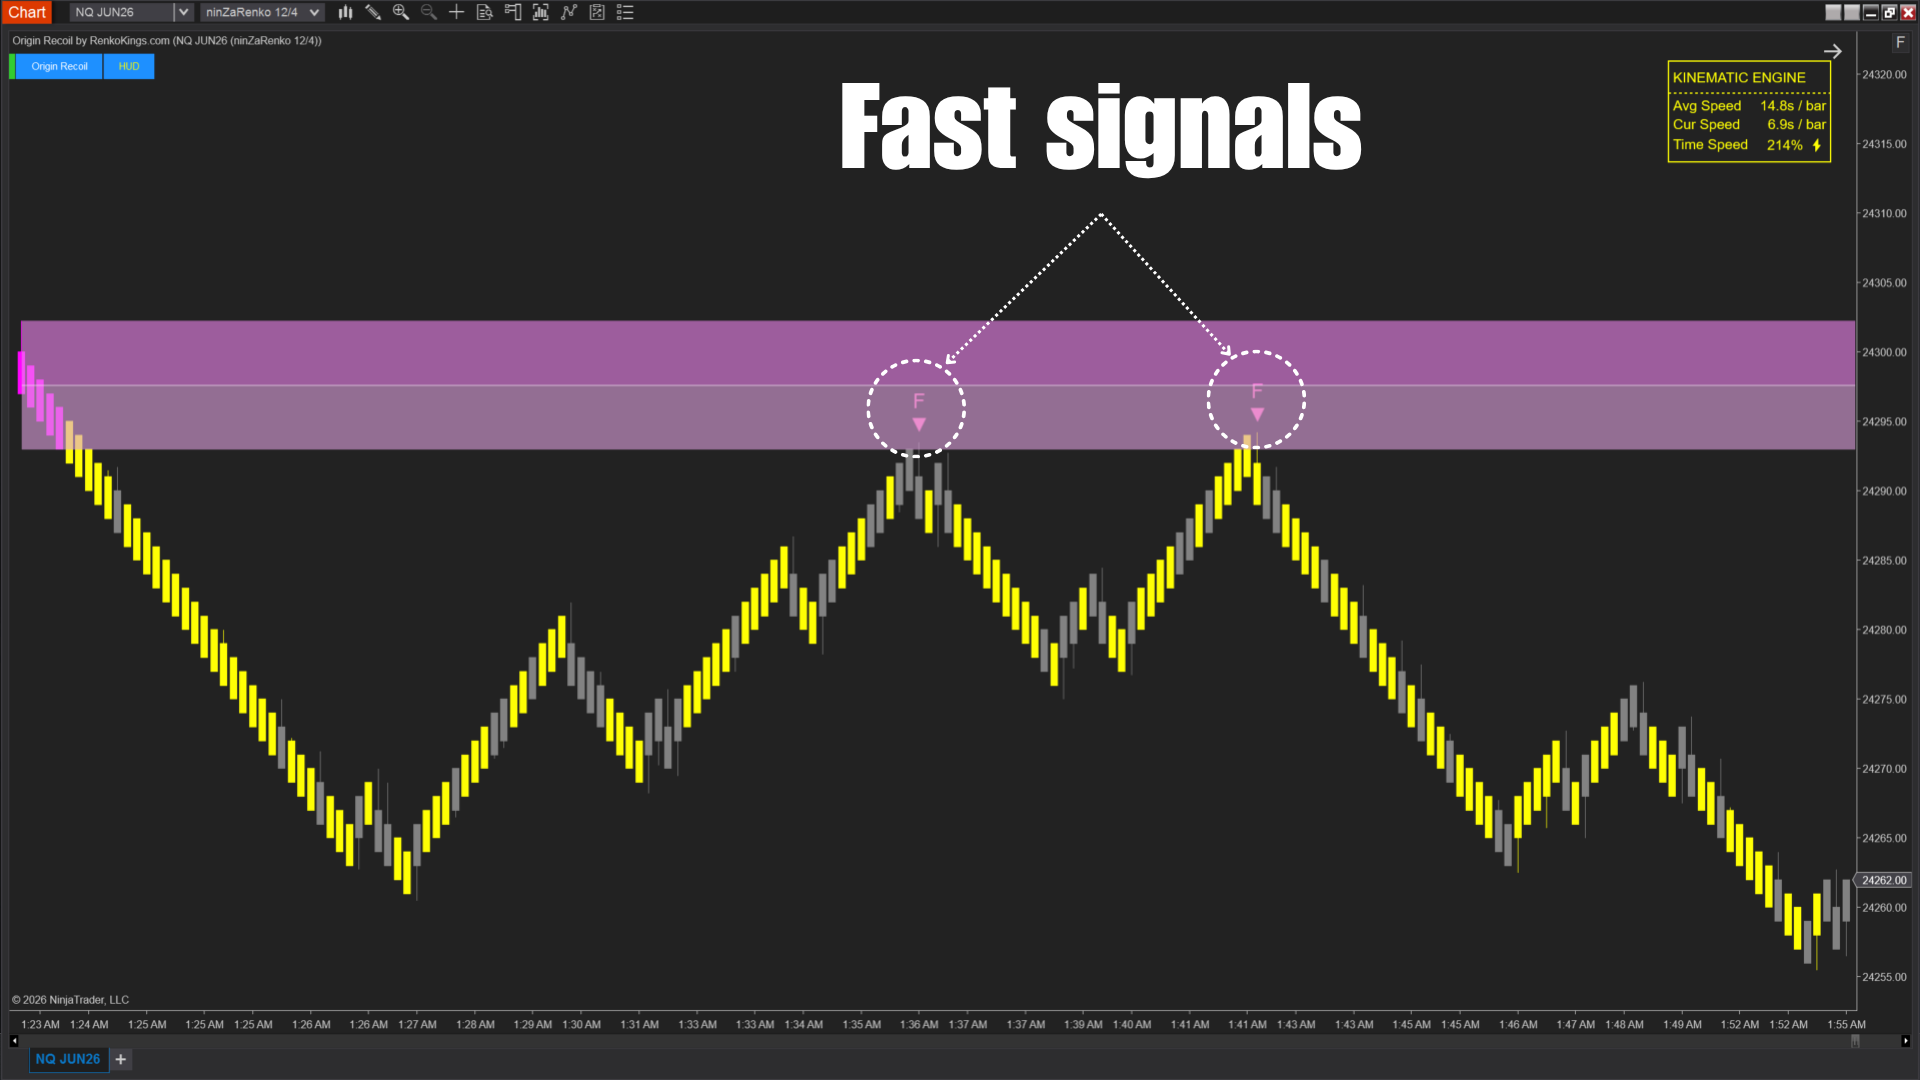
Fast & Superfast signals
In trading, the ability to enter at the right moment is just as important as identifying the right direction. Many traders struggle with this because they treat all pullbacks as equal, without considering the strength of the original move.
Origin Recoil addresses this by distinguishing between two types of retest signals:
Fast Signal – Controlled opportunity
This occurs when price revisits a Fast Zone. These conditions are typically seen in:
- Sideways or less-defined markets
- Situations where momentum is still building
- Moves that allow deeper pullbacks
In these cases, price often retraces further before continuing. This gives you the advantage of entering at better prices with more control
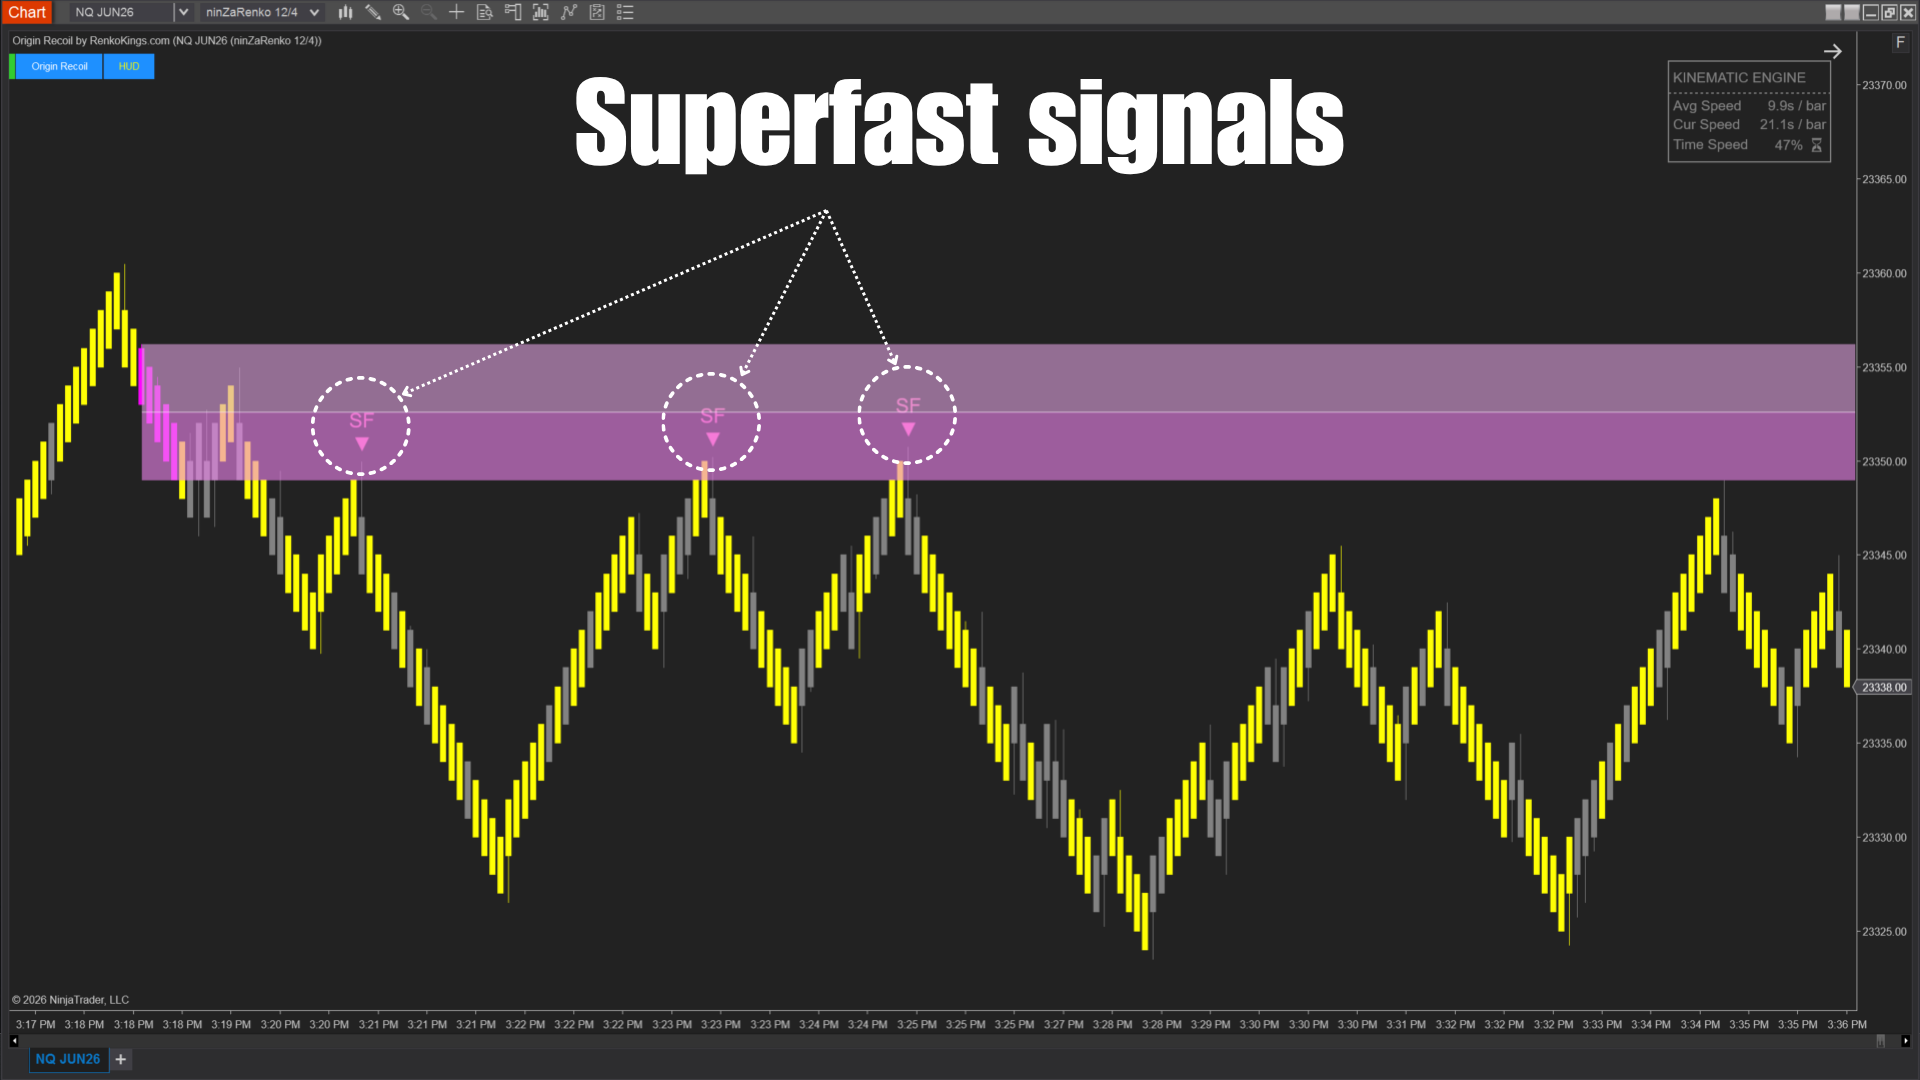
Superfast Signal – Immediate reaction
This occurs when price revisits a Superfast Zone. These are usually found in:
- Strong, clearly trending markets
- Conditions with sustained aggressive momentum
- Situations where pullbacks are shallow
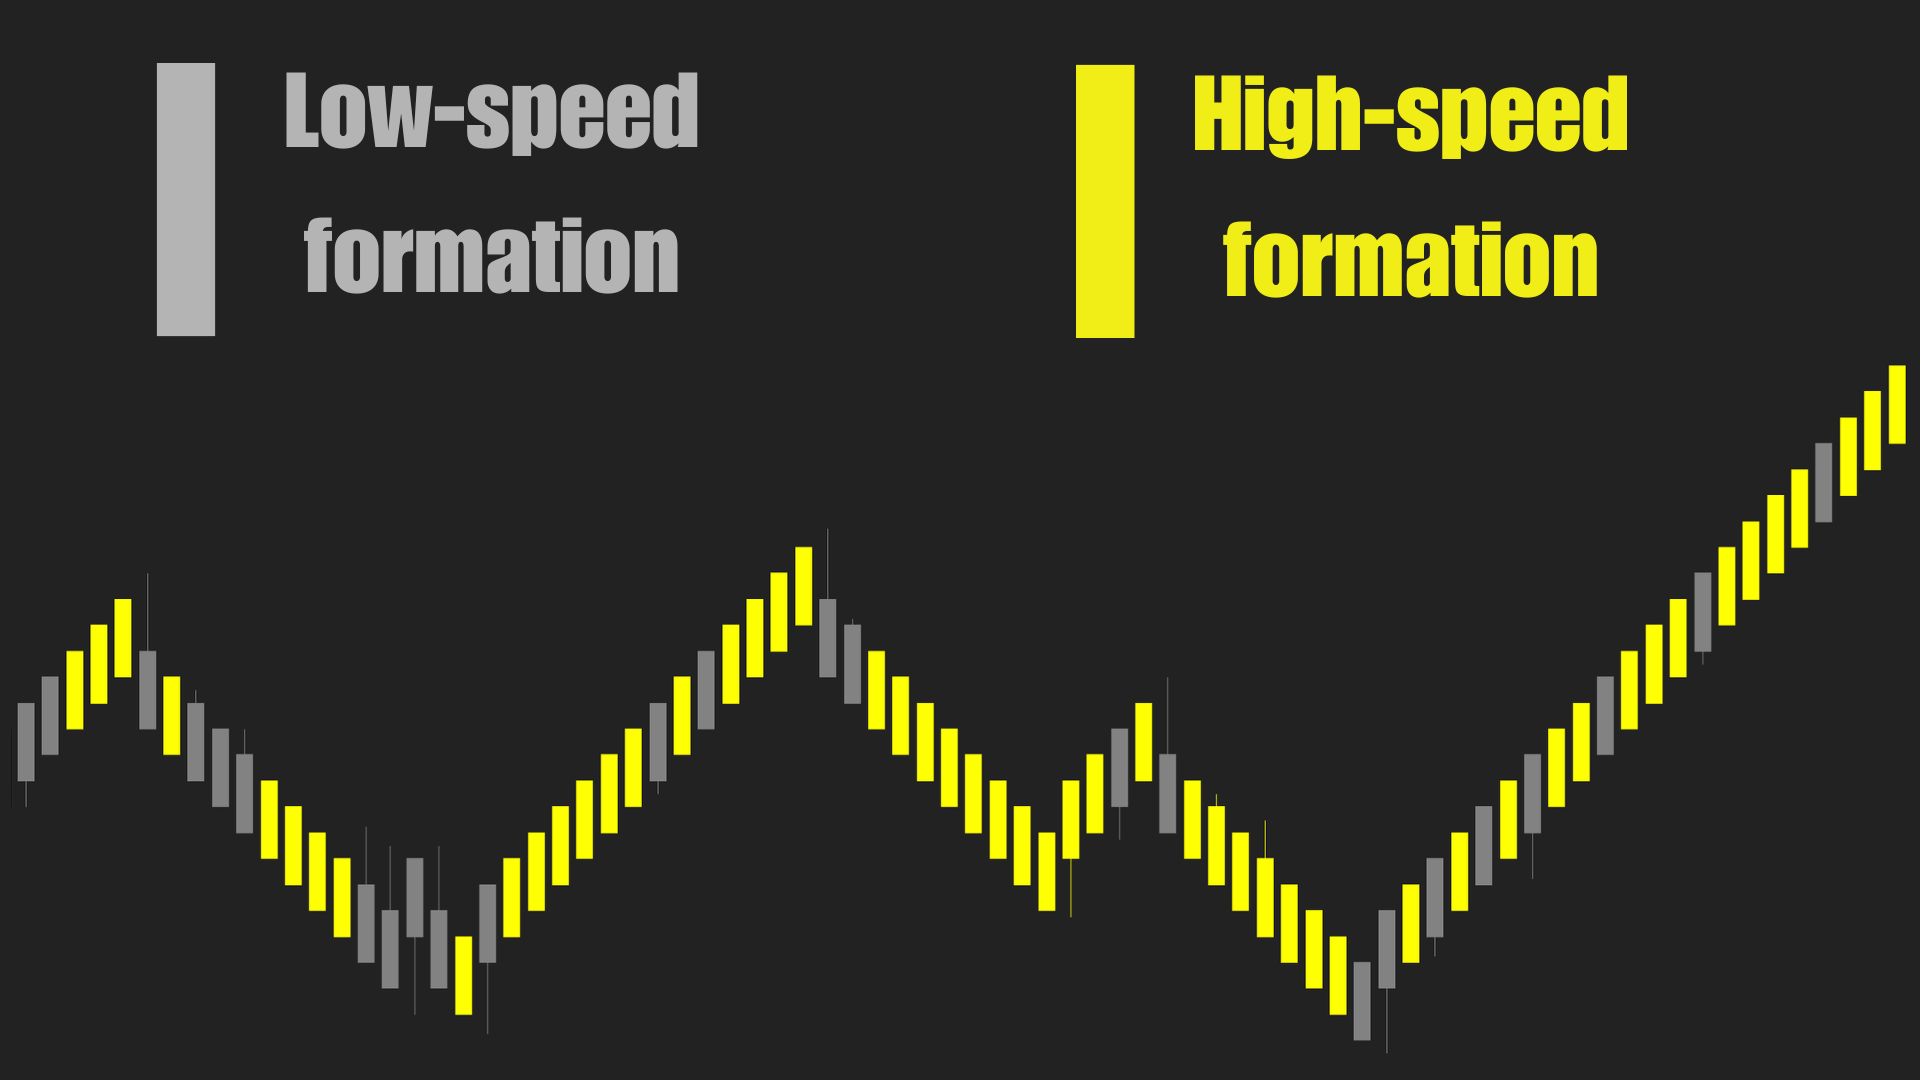
In addition, the indicator helps you identify whether candles are forming slowly, quickly, or extremely fast through color changes:
Start using Origin Recoil today and gain momentum insight you’ve never seen on Renko charts!
Dedicated NinjaScript signals:
- Signal_Trade: 2 = super fast bullish, 1 = fast bullish, -1 = fast bearish, -2 super fast bearish, 0 = no signal
A Breakout isn’t defined by price alone. What happens next?
Get Noble POC Band today & receive our 2 latest Renko bars as a bonus →
Media

Origin Recoil
21 photos


Changelog
- 27 Mar 2026 – The indicator was released (built new).
A Breakout isn’t defined by price alone. What happens next?
Get Noble POC Band today & receive our 2 latest Renko bars as a bonus →
Related products
Sale!

Sale!
Sale!
Sale!
Sale!

Sale!

Sale!

Sale!