For scalpers: How does the Expansion Entry Scalping Solution perform in live markets?
See it in action across all four live trading sessions →
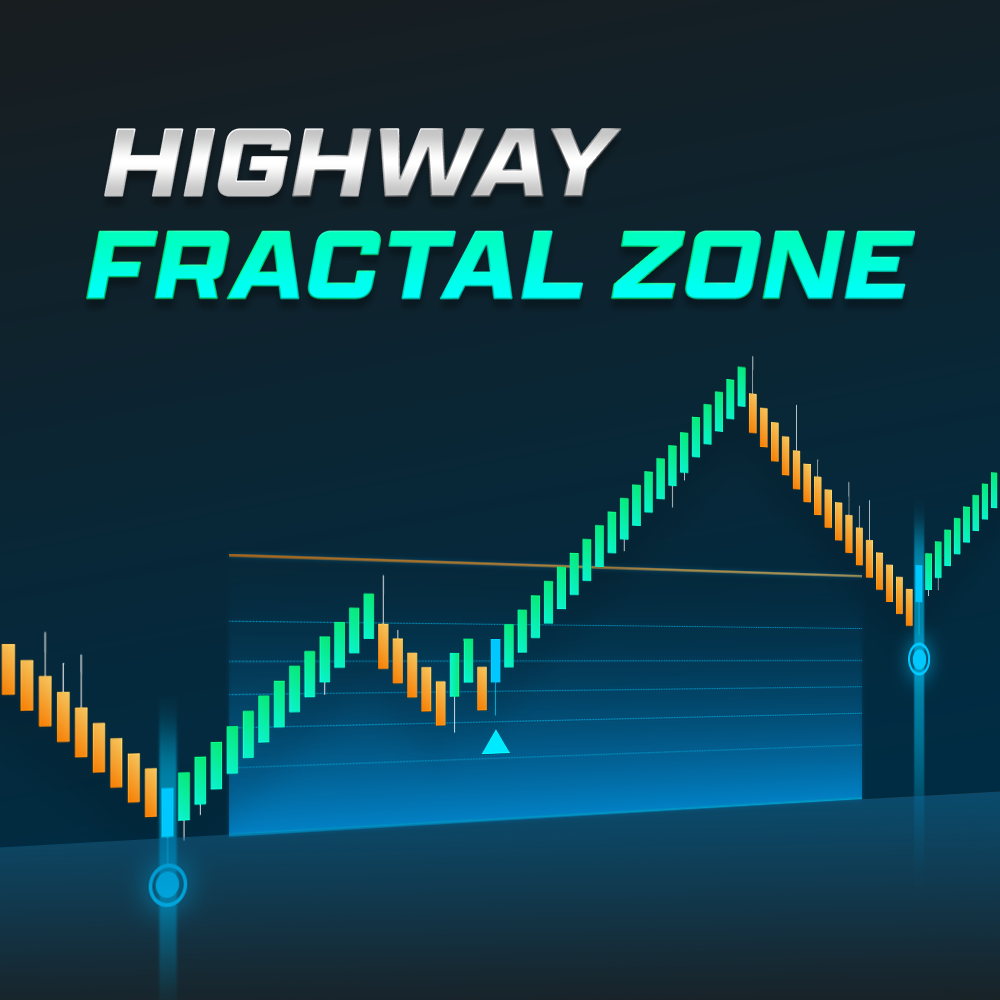
Highway Fractal Zone
$250
Description
Turn Fractal swings into high-value trading zones
Not every swing high or swing low deserves your attention. Some reactions are only short-term noise, while others develop into meaningful support and resistance areas where price continues to respond.
Highway Fractal Zone identifies these higher-quality structural zones by combining Fractal market structure, Fast & Slow Structure comparison, and Fibonacci retracement context.
Instead of reacting to every visible price swing, you can focus on zones that provide clearer context for pullbacks, trend strength, and potential turning points.
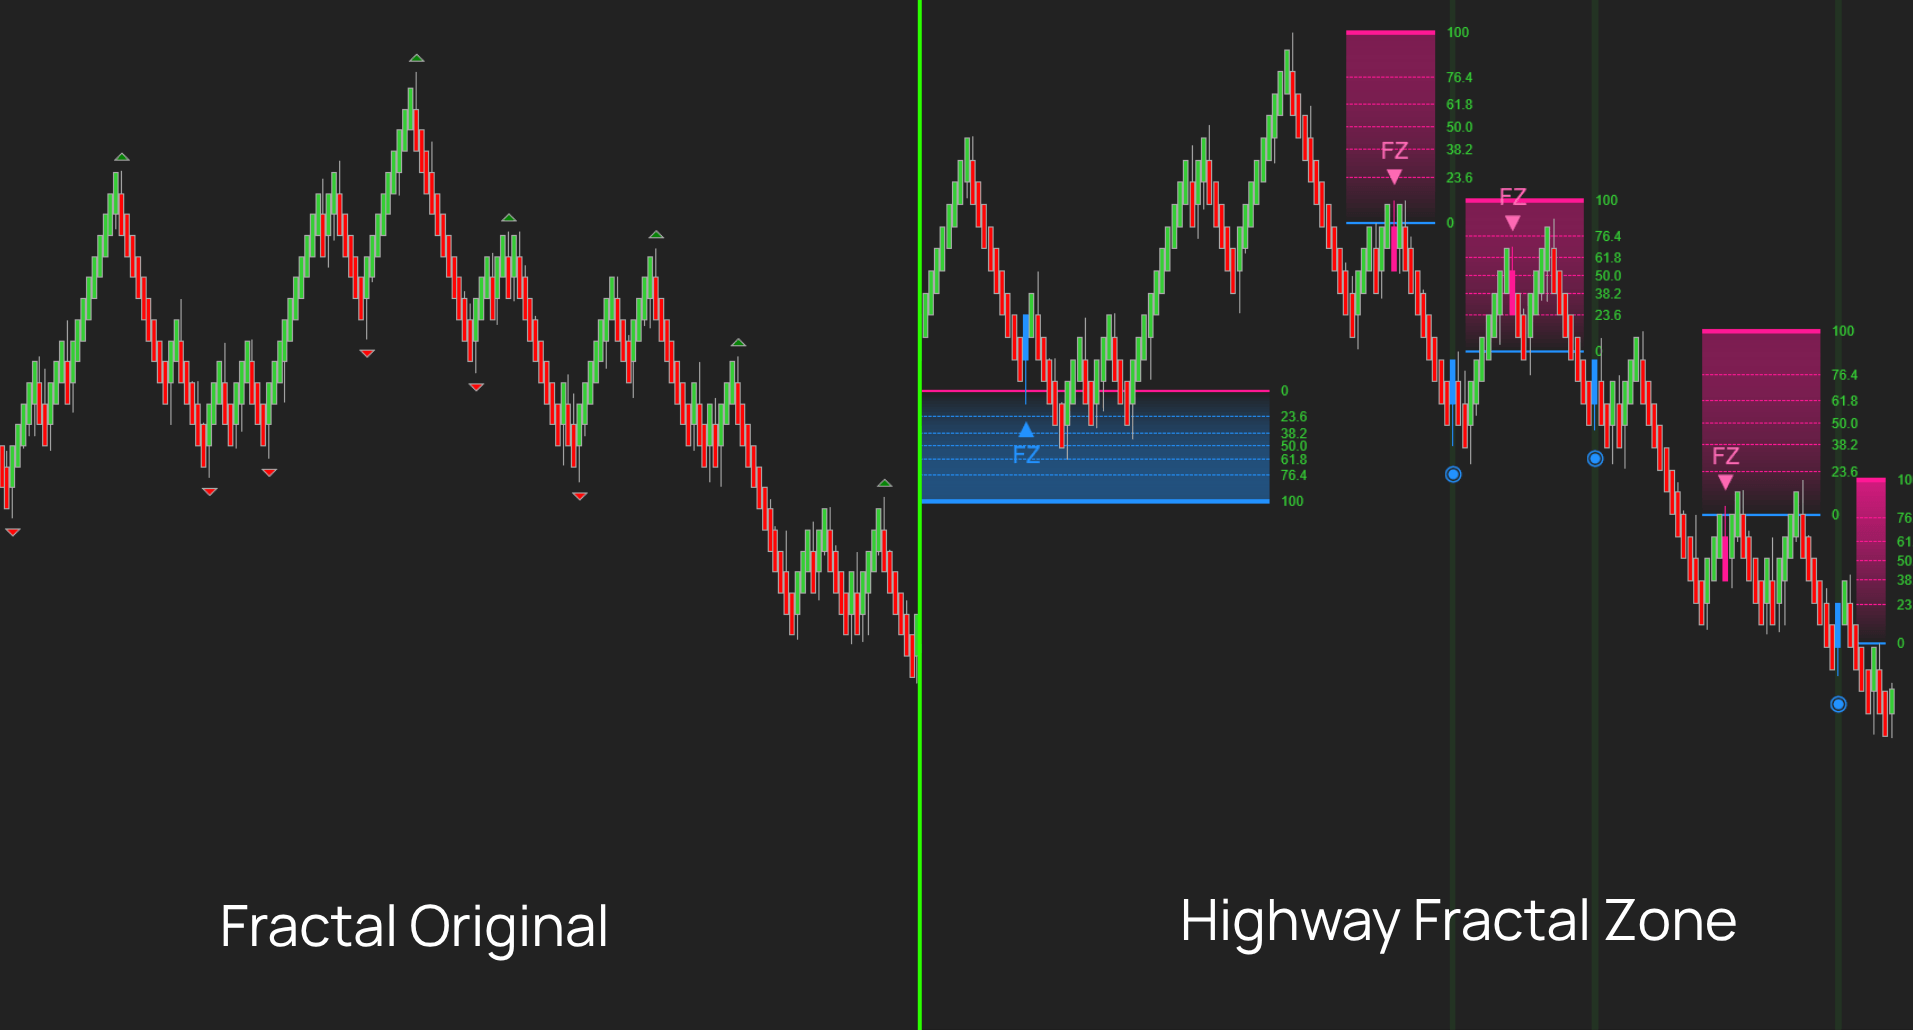
From raw Fractal points to actionable market structure
Fractals have long been used to identify important turning points in price action. However, knowing where price reacted is only part of the picture.
Highway Fractal Zone goes further by comparing recent market behavior with the broader market structure.
The indicator uses 2 key layers:
- Fast Structure reflects the market’s most recent reactions.
- Slow Structure reflects the broader and more stable market context.
When these 2 structures diverge, the space between them forms a Fractal Zone. This zone becomes a dynamic area you can monitor for pullbacks, support, resistance, trend continuation, rejection, or possible exhaustion.
Unlike fixed manual levels, Fractal Zones update as market structure develops. This keeps you focused on areas that are still relevant instead of relying on outdated support and resistance lines.
Why traders use Highway Fractal Zone
Find the zones where price structure actually matters
Highway Fractal Zone identifies important price areas based on Fractal swing structure, instead of relying only on manually drawn levels.
You can use it to:
- Detect structural support and resistance zones
- Reduce subjectivity in chart analysis
- Focus on price areas instead of isolated price points
- Follow market structure as it updates in real time
Stop treating every price reaction as a trade setup
Not every bounce deserves a trade. Not every swing high or swing low should become a decision point.
By comparing Fast Structure with Slow Structure, Highway Fractal Zone separates routine price reactions from areas with stronger structural context.
This gives you a clearer way to focus on higher-quality zones and avoid reacting to every minor market movement.
Know whether a Pullback is healthy or losing strength
The depth of a pullback can reveal a lot about trend strength.
Highway Fractal Zone integrates Fibonacci retracement levels directly inside each Fractal Zone, allowing you to evaluate whether a pullback is shallow, deep, or potentially dangerous.
- Shallow retracements may suggest the trend remains healthy.
- Deeper retracements may indicate weakening momentum.
- A decisive break of the zone may signal that the trend structure is losing validity.
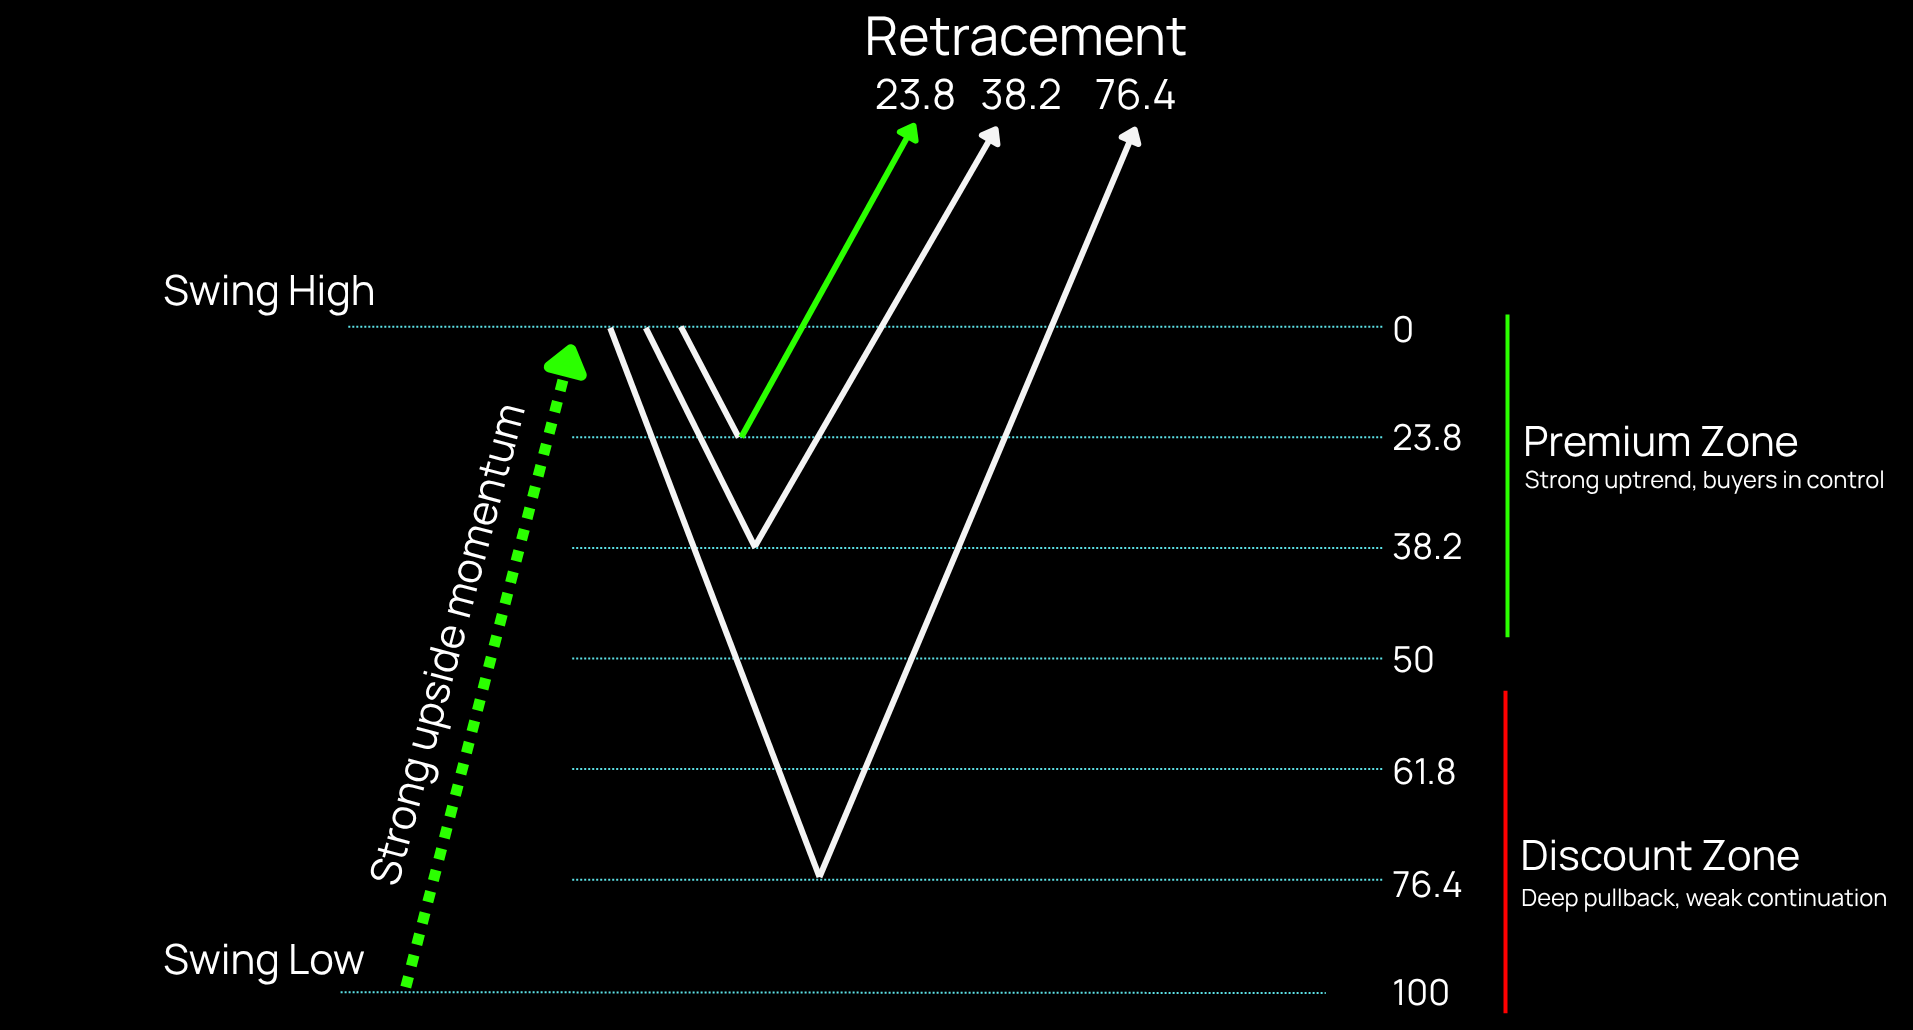
This creates a more objective way to judge pullback quality before making a decision.
Avoid fighting the broader market structure
A support zone may look attractive, but if the broader structure is bearish, that support may not carry the same value.
Highway Fractal Zone provides a clearer view of the broader market context:
- Fast Structure above Slow Structure suggests bullish conditions.
- Fast Structure below Slow Structure suggests bearish conditions.
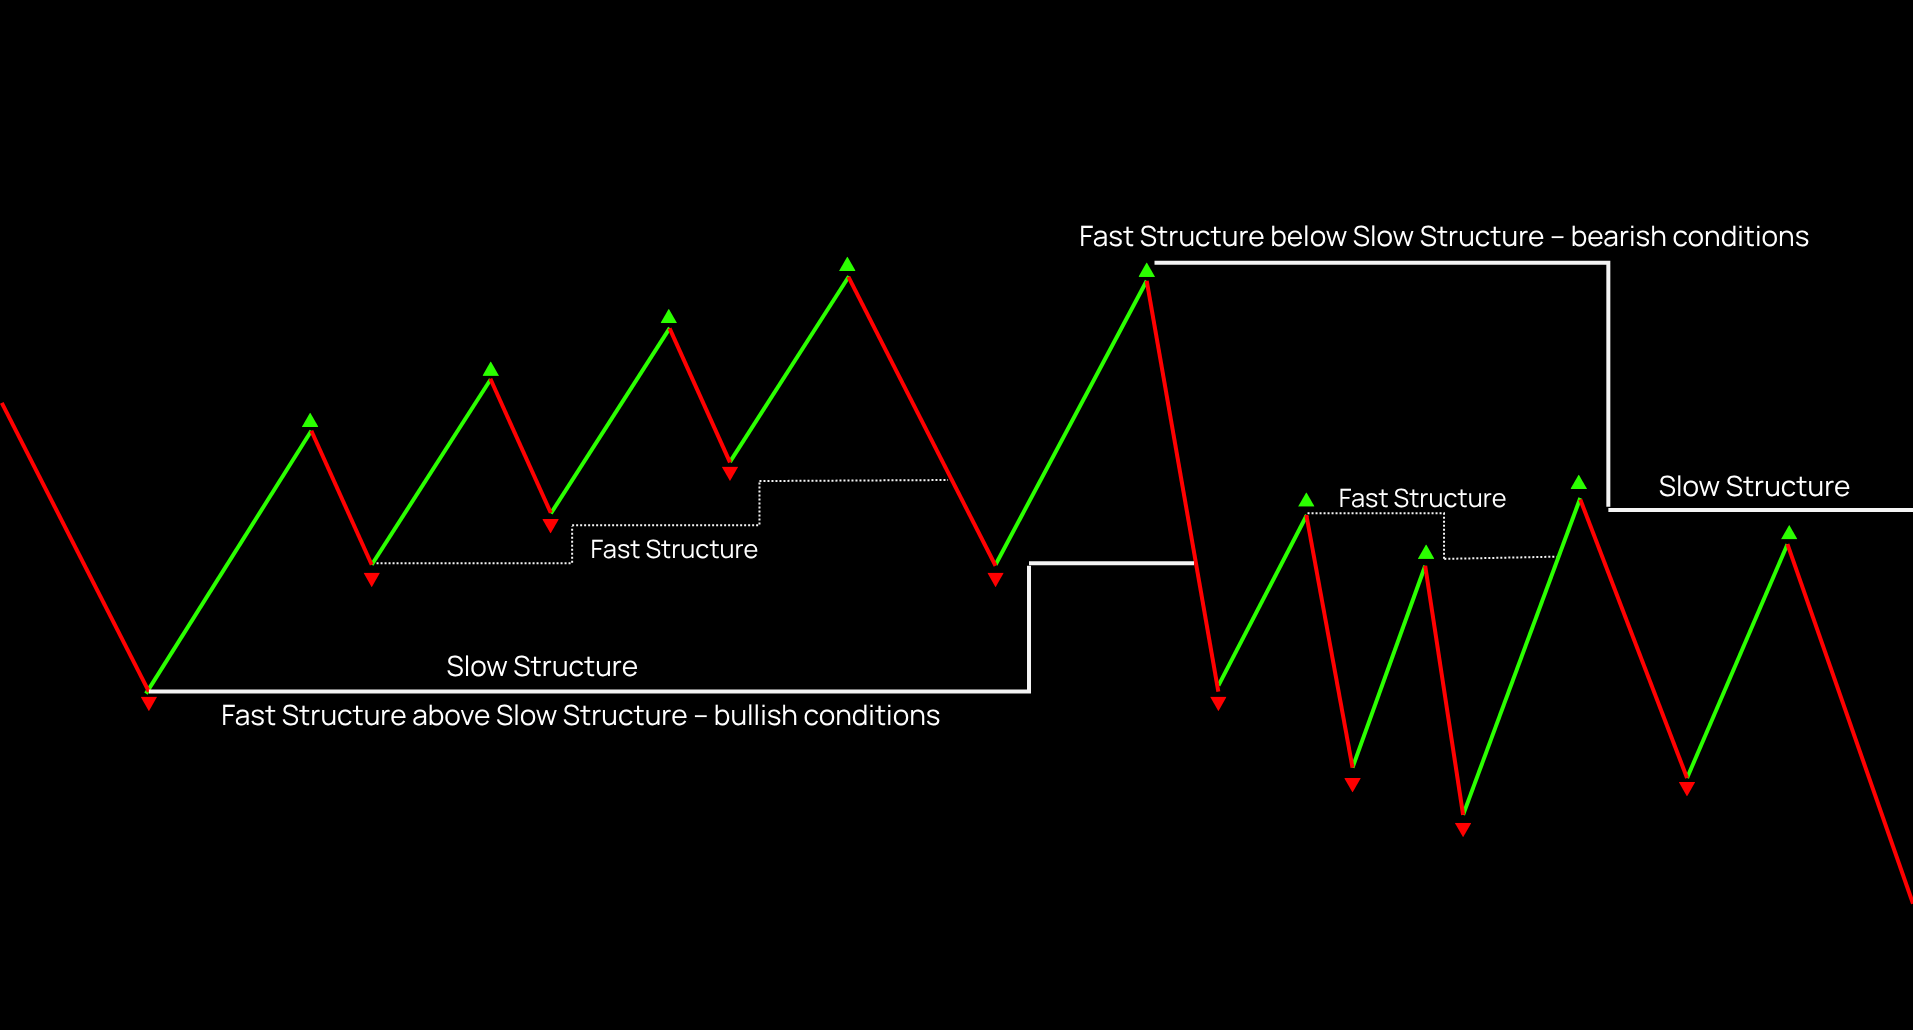
This allows you to avoid analyzing zones in isolation and reduces the risk of trading against the bigger picture.
How Highway Fractal Zone reads the chart
Highway Fractal Zone is designed around one principle: read structure first, then evaluate signals within that structure.
Once the Fractal Zone is formed, you can watch how price behaves around that area. The goal is not simply to see whether price touches the zone, but to understand whether the reaction supports or challenges the current structure.
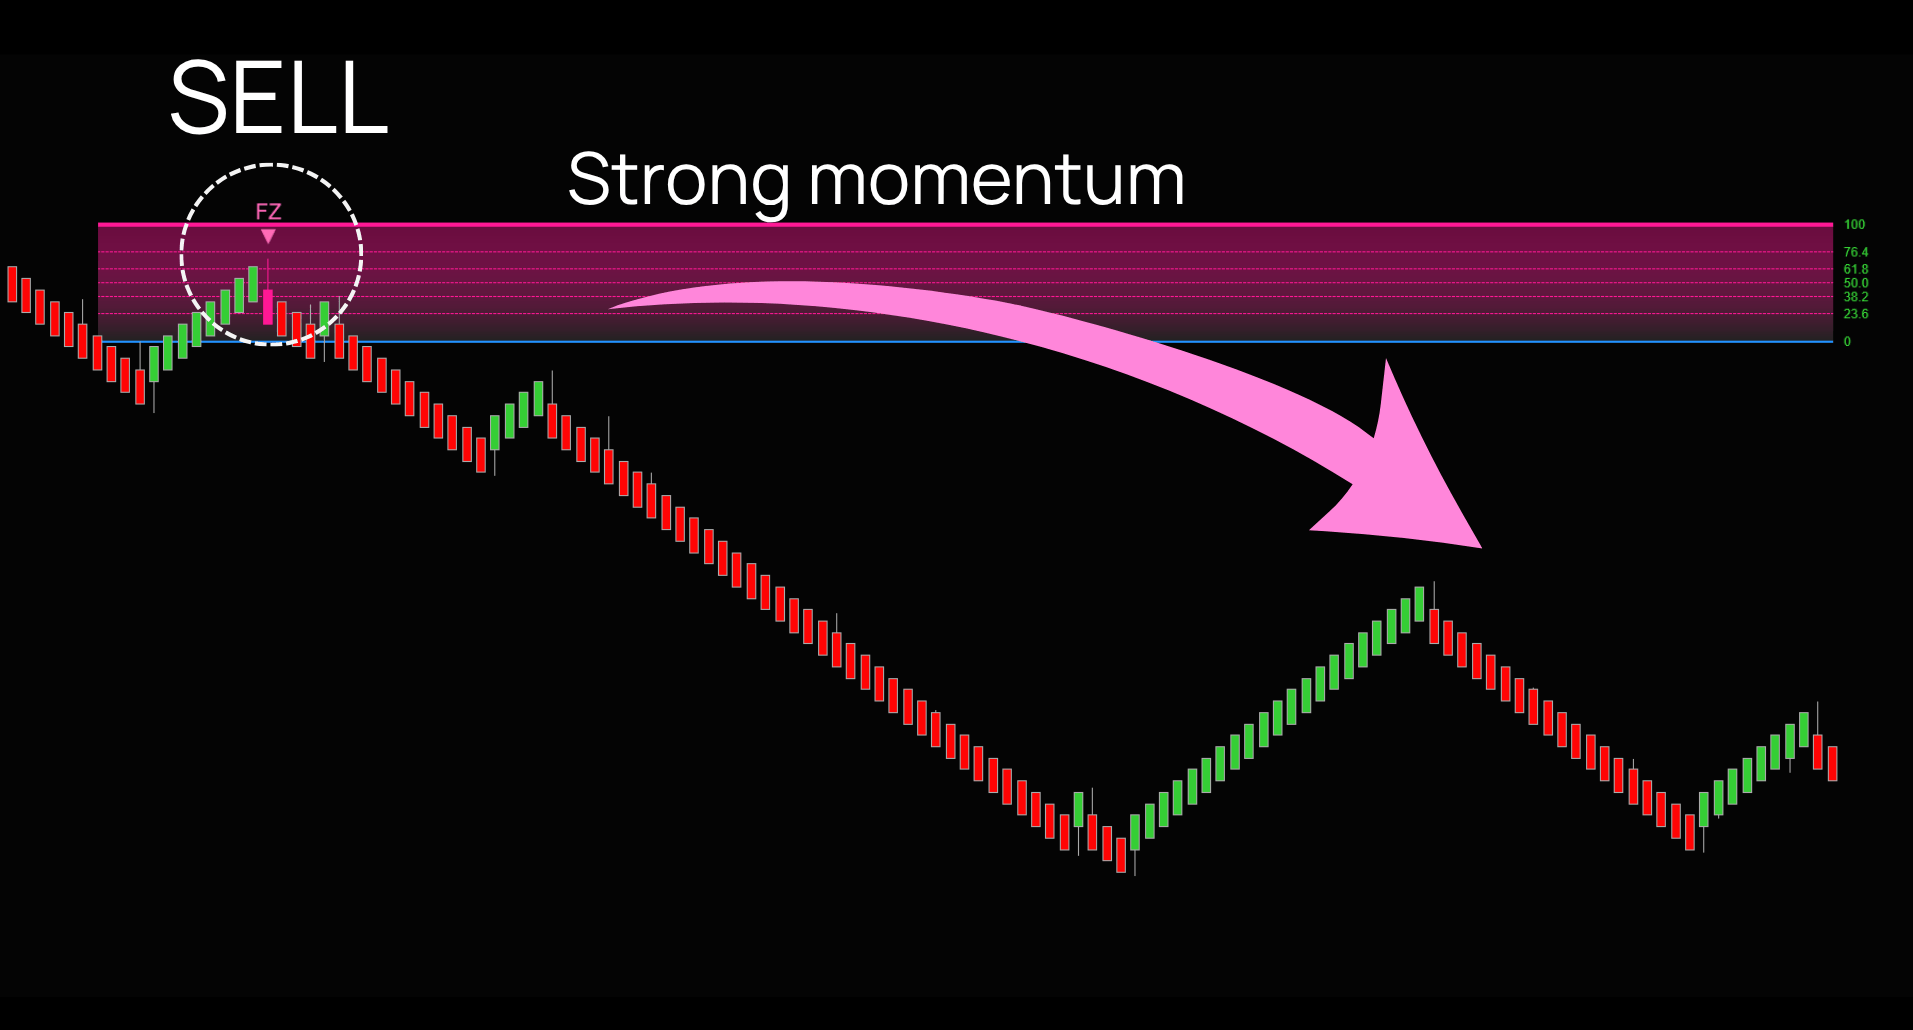
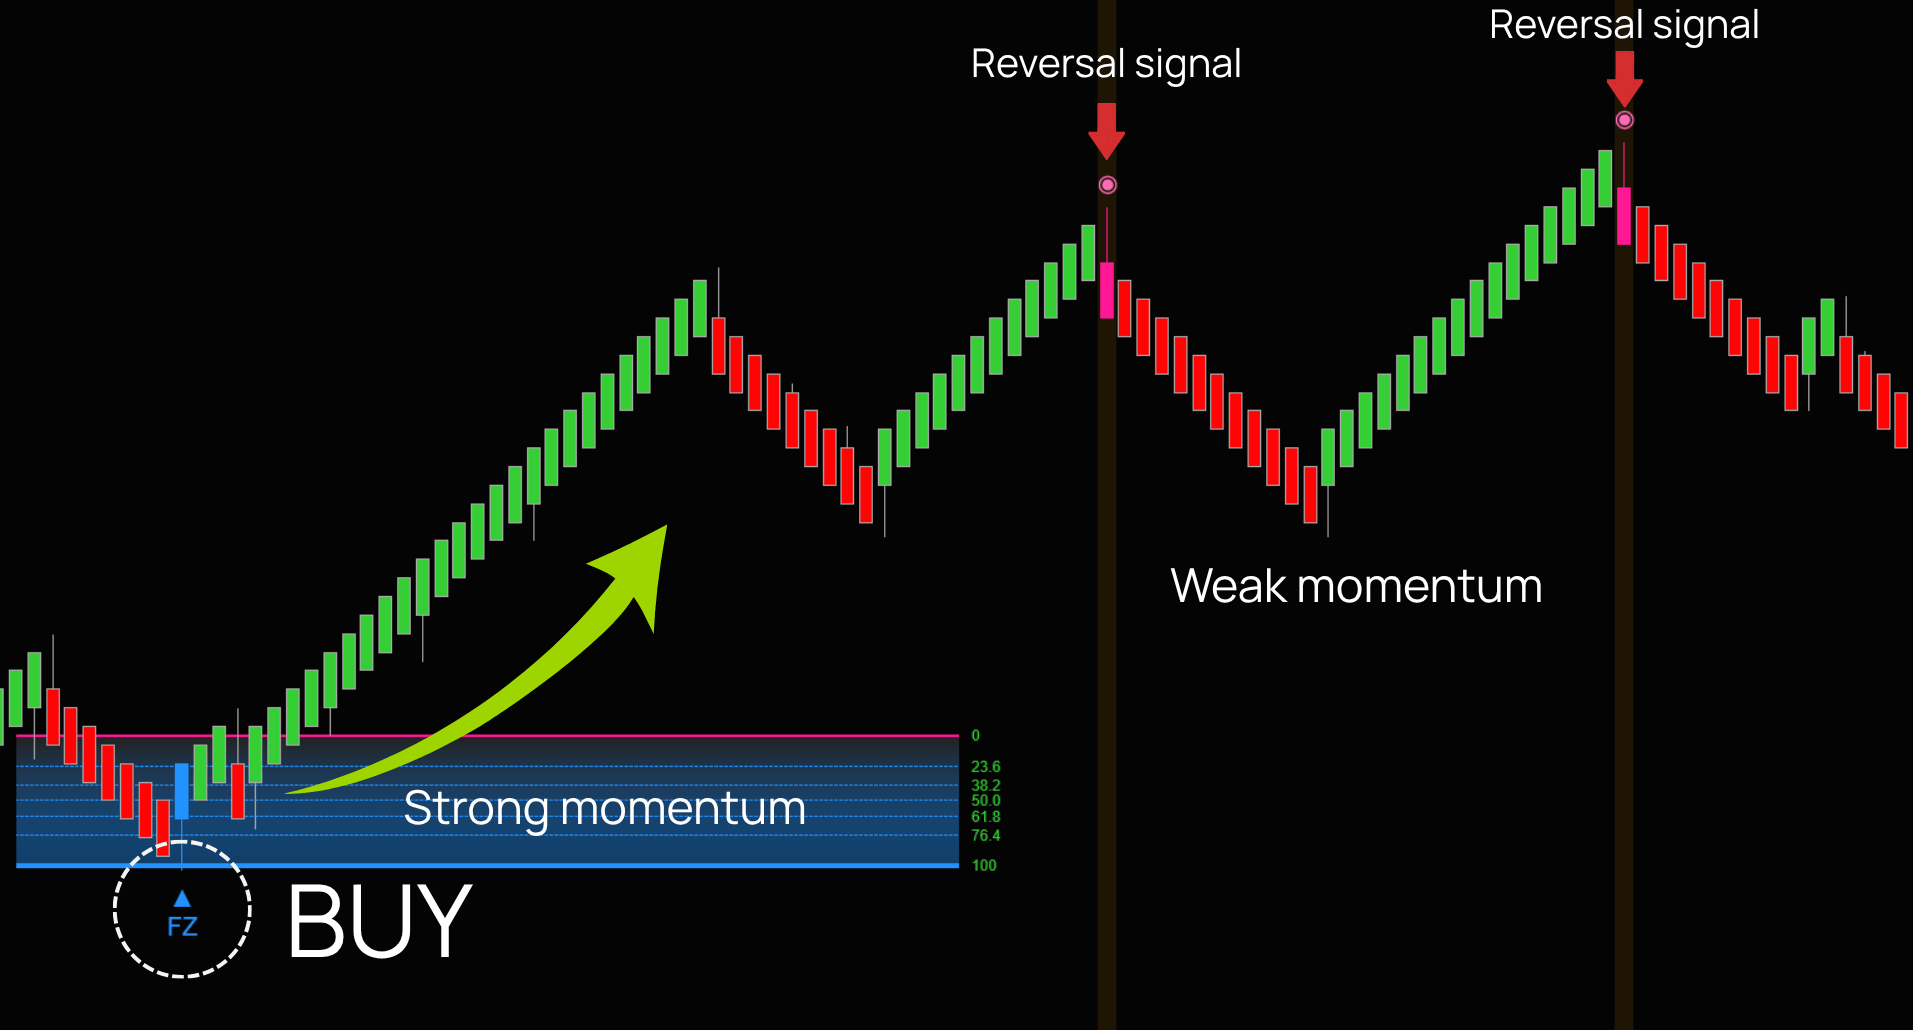
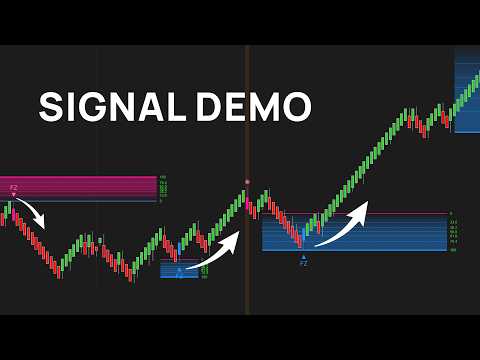
FZ signals highlight meaningful price reactions around Fractal Zones:
- In bullish conditions, they may show where downside continuation fails near support.
- In bearish conditions, they may show where upside continuation fails near resistance.
These signals reveal whether price is respecting or challenging a key zone.
Reversal signals highlight possible exhaustion when the current move begins to weaken. They can appear when momentum fades, retracements become deeper, or price starts challenging areas that previously held firm.
Together, Fractal Zones, Fibonacci levels, FZ signals, and Reversal signals create a structured framework for reading trend quality, pullback behavior, and potential turning points.
If you want a clearer way to identify meaningful zones, evaluate pullbacks, avoid low-value reactions, and understand when a trend is being respected or challenged, Highway Fractal Zone gives you the framework to do it.
For scalpers: Stuck in chop? Discover expansion entries
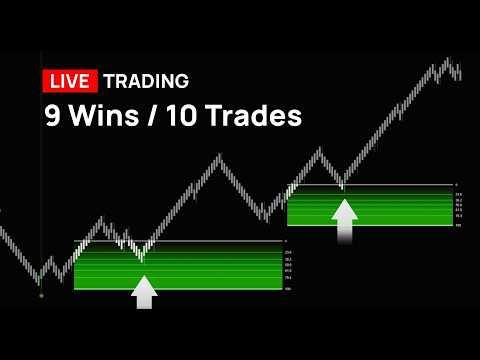
Watch NQ live trading: 10 trades, 10 wins →
Dedicated NinjaScript Signals
- Signal_Trade: 1 = bullish, -1 = bearish, 2 = bullish R, -2 = bearish R
- Signal_Zone: 1 = zone bullish, -1 = zone bearish, 0 = no signal
Product Media
These media materials may have been recorded/captured in favorable markets. Please review our “acceptable marketing practices”.
Videos
Images

Highway Fractal Zone
11 photos


Software Changelog
- 22 Jun 2026 – The indicator was released (built new).
Related products


![[System] Flazh Infinity](https://renkokings.com/wp-content/uploads/Flazh-Infinity-avatar.png)

![[System] V-Elementra](https://renkokings.com/wp-content/uploads/V-Elementra-avatar-Renkokings.png)