Are you a new or struggling trader and want to be a professional trader?
If so, we can help you and provide you with the necessary tools for you to succeed in your goals.
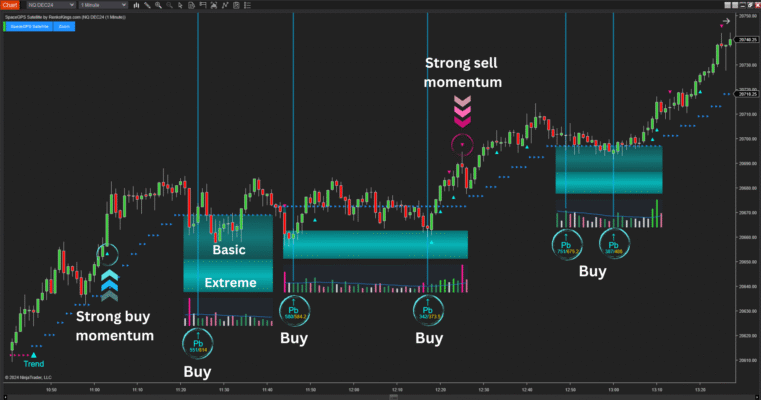
Check out this killer combo on Reko charts 👉 [Sumo Pullback$ + Imbalance Volume Sensor]

🔥 Scalpers, this one’s for you... 🔥
Get your favorite scalping indicators & systems before the deal ends in 2 days!