
Curated indicator combos available at the strongest exclusive offers. Explore now →
[System] V-Elementra
$1,996
Description
** The V-ELEMENTRA system works across different chart types, but delivers its best performance on Renko charts.
V-Elementra is a 5-in-1 trading system, delivering 5 core signal types that combine into a comprehensive framework for serious traders. It offers a flexible framework that supports multiple trading styles and market conditions:
- Trend Following
- Trend Fading
- Trading in trending or choppy markets
- Scalping, day trading, or swing trading
Key features
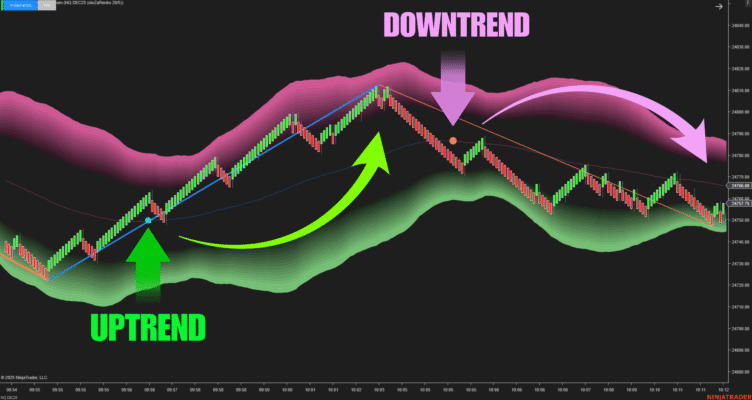
1. Trend detection
Identifying the market trend is a crucial step in every trade, guiding traders on when to prioritize buying or selling. V-Elementra provides trend information directly through the Trend Plot:
- Green Trend Plot indicates an uptrend
- Pink Trend Plot indicates a downtrend
By identifying the trend, the system also improves the reliability of its pullback signals, including early and deep pullbacks.
.
2. Pullback signal
V-Elementra provides 2 types of pullback signals to help you identify reliable entry points during market corrections: Early Pullback and Deep Pullback.
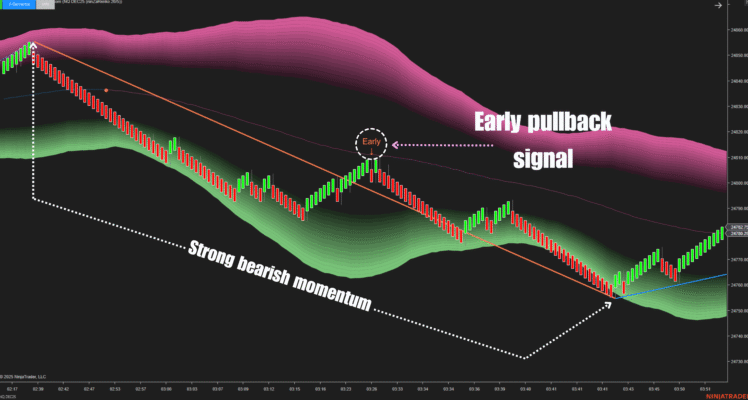
- Early Pullback Signal
(Best used in fast-moving markets with strong momentum)
The Early Pullback Signal appears when the price is approaching the Trend Plot, indicating that the market is making a shallow correction within a strong momentum phase.
It helps you capture early entries instead of waiting for a deeper retracement that may never come.
Why this matters:
In strong-momentum markets, pullbacks are often too weak to reach “ideal” entry zones. Many traders end up missing trades while waiting for a deeper correction. The Early Pullback Signal ensures you stay aligned with momentum and don’t miss these early-stage opportunities.
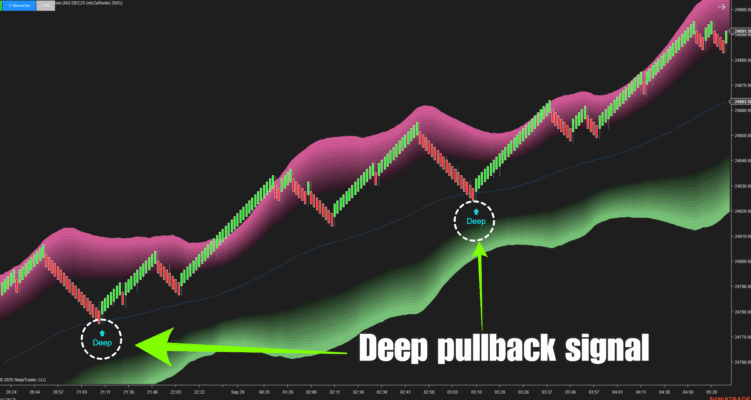
- Deep Pullback Signal
(Best used in slow or consolidating markets with limited momentum)
The Deep Pullback Signal appears when the price has moved beyond the Trend Plot, signaling a stronger correction suitable for slower or low-momentum markets.
This signal provides entries at more favorable prices when the market is consolidating or moving without breakout momentum.
Why this matters:
In low-momentum environments, price tends to pull back deeper before continuing its move. The Deep Pullback Signal helps you take advantage of these extended retracements for better entry positioning.
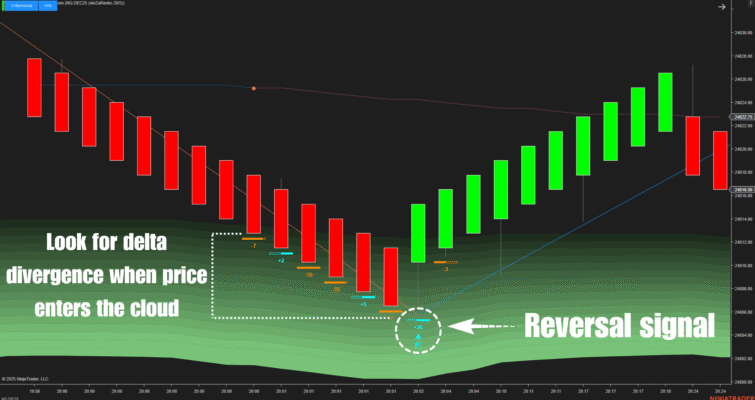
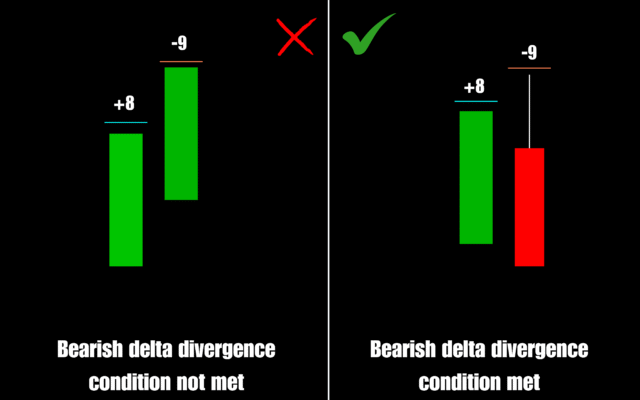
3. Reversal signal (R)
This signal type is designed to detect potential turning points through Volume Delta divergence.
It appears when price enters the cloud and shows a divergence between price and delta volume within 2 consecutive bars, where the 2nd bar must be a Reversal bar, forming the R signal itself.
This mechanism allows the system to spot moments when market strength weakens despite continued price movement, signaling that a reversal could be underway.
The Reversal Signal (R) also serves as a high-confidence exit signal, especially useful when protecting profits during weakening trends.
Why this matters:
Price and delta volume usually move in sync – when price rises, buying pressure strengthens, and vice versa. However, when delta volume moves in the opposite direction, it often reveals hidden exhaustion behind the current move.
The Reversal Signal (R) helps you detect these subtle shifts early, enabling timely trade entries or exits before a confirmed reversal unfolds.
4. Dynamic Support/Resistance
The Dynamic Support/Resistance zones are represented by 2 cloud bands – the upper band acting as Resistance and the lower band as Support.
Beyond identifying key price zones, these clouds also visualize market momentum:
- Weak momentum: when price stays away from the clouds
- Strong momentum: when price begins to enter the clouds
- Very strong momentum: when price breaks through the clouds
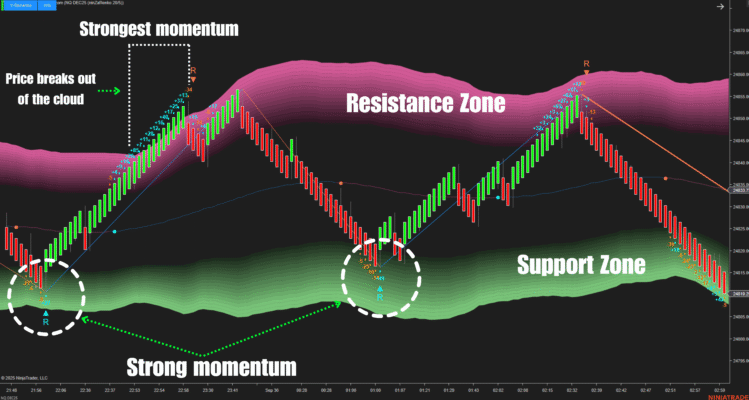
When price approaches or moves into these cloud zones, the probability of a reversal increases significantly. This is where the Reversal Signal (R) often forms, providing confirmation for potential turning points within these dynamic areas.
Instead of relying on static support/resistance levels, this adaptive cloud structure updates with price action, allowing traders to see real-time shifts in market strength and balance between buyers and sellers.
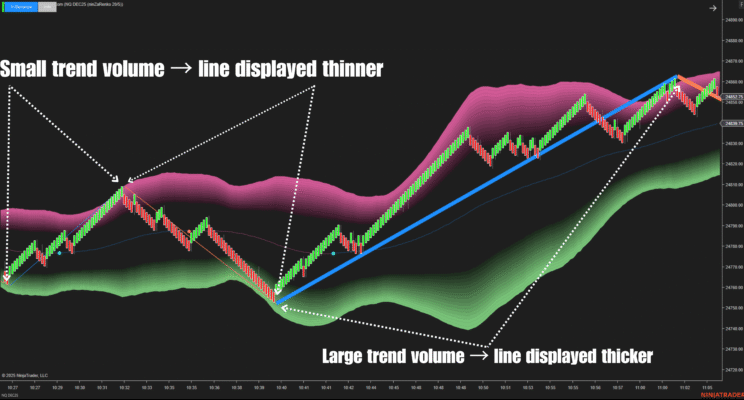
5. Zigzag Volume Structure
The Volume Line Structure visualizes how volume behaves across each price leg. The system measures total volume within every zigzag swing – connecting the highest point of the upper band to the lowest point of the lower band.
The line thickness dynamically reflects the total volume of each swing:
- Thicker lines represent swings with higher total volume
- Thinner lines indicate swings with lower total volume
This visualization helps you:
- Clearly see the up-and-down structure of price through each zigzag leg
- Identify whether a swing is supported by strong or weak volume
- Evaluate trend strength and potential reversals when a structure break occurs with unusually high volume
By combining structure and volume into a single visual element, traders can quickly assess the conviction behind each price move and anticipate major shifts in market control.
Dedicated NinjaScript signals:
- Signal_Trend: 1 = uptrend, -1 = downtrend, 0 = no trend
- Signal_Trade: 1 = uptrend start, -1 = downtrend start, 2 = bullish reversal, -2 = bearish reversal, 3 = bullish early, -3 = bearish early, 4 = bullish deep, -4 = bearish deep, 0 = no signal
A Breakout isn’t defined by price alone. What happens next?
Get Noble POC Band today & receive our 2 latest Renko bars as a bonus →
Media

V-Elementra
20 photos


Changelog
- 24 Dec 2025 – An issue that “Captain Optimus Strong” couldn‘t get a signal was fixed; the “No Tick Replay” technology was applied.
- 01 Oct 2025 – The system was released (built new).
A Breakout isn’t defined by price alone. What happens next?
Get Noble POC Band today & receive our 2 latest Renko bars as a bonus →
Related products
Sale!

Sale!

Sale!

Sale!
Sale!

Sale!
Sale!

Sale!