Curated indicator combos available at the strongest exclusive offers. Explore now →
Sale!

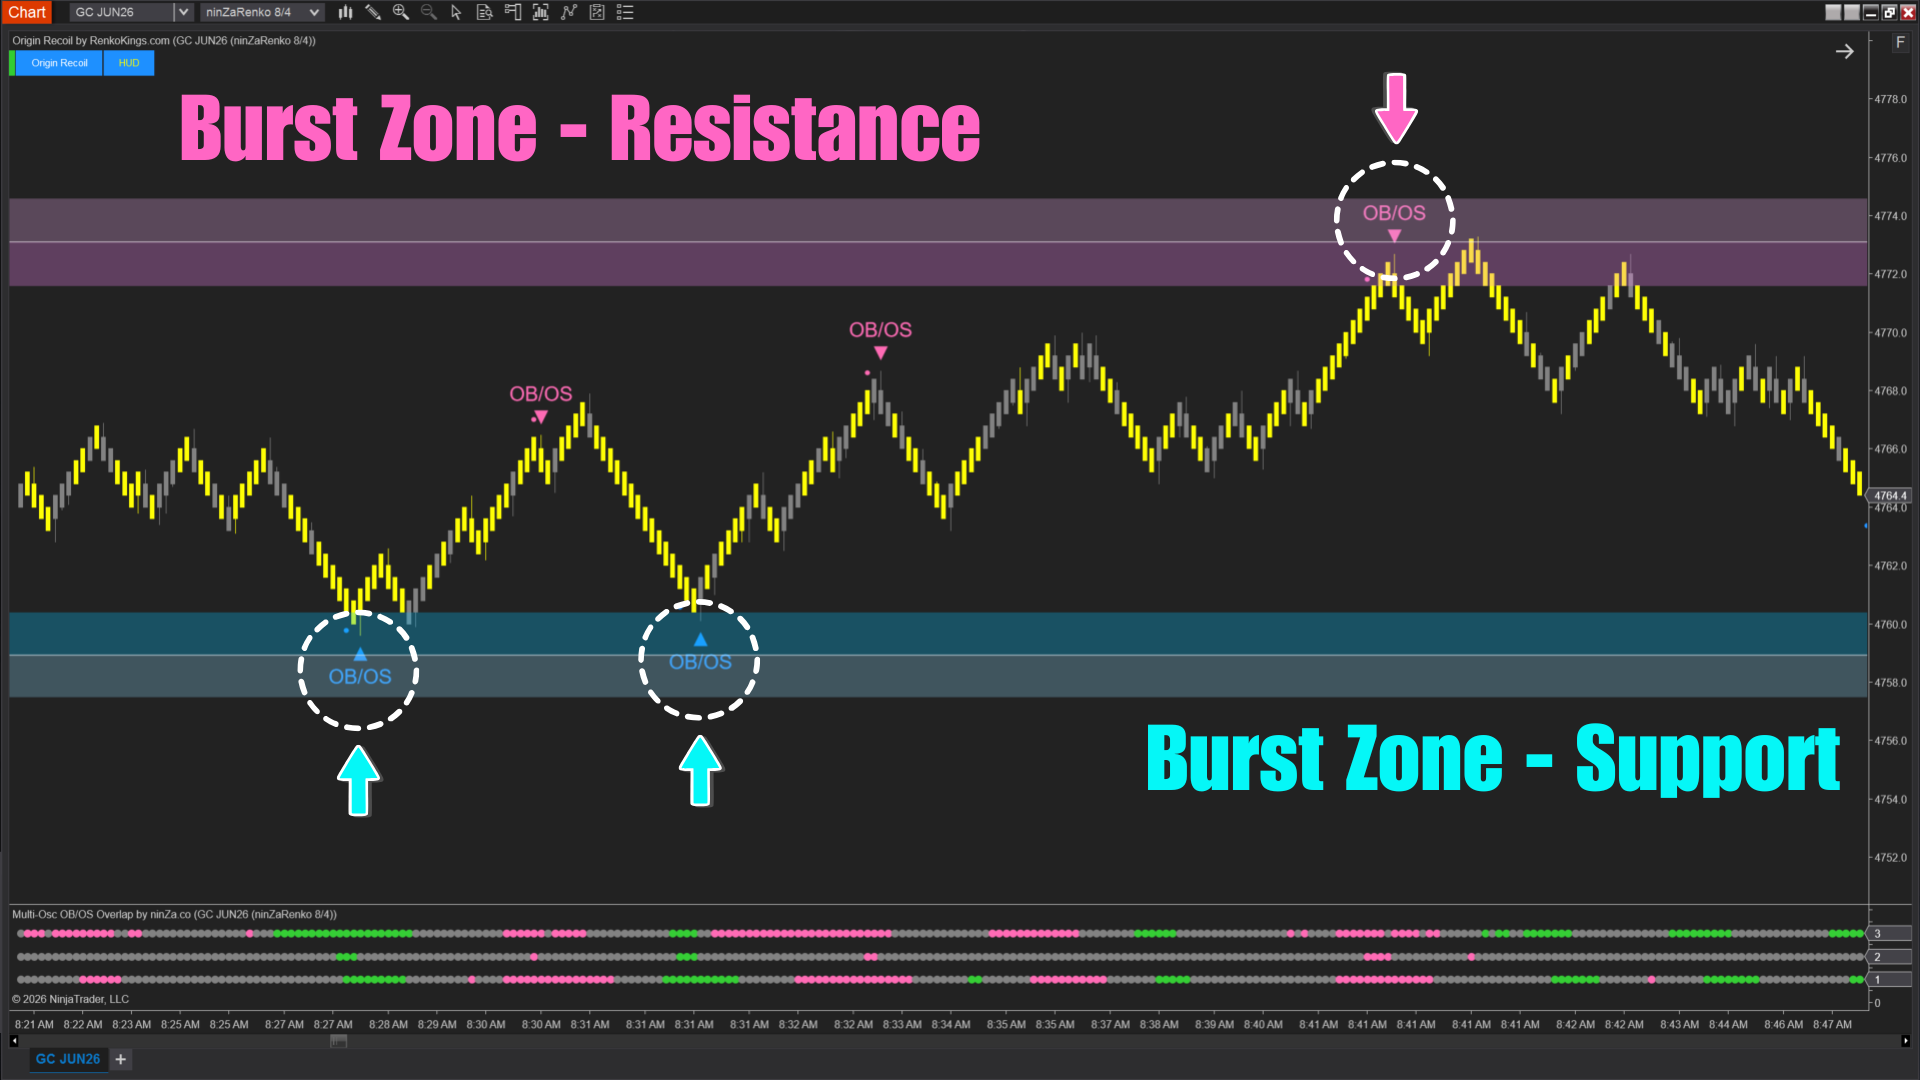
[AbsP] MEO #4: Origin Recoil + Multi-Osc OB/OS Overlap
Original price was: $1,192.$400Current price is: $400.
This mashup is available at a special price for a limited time. Once it’s gone, it won’t be coming back.
Description
See momentum speed and confirm overbought/oversold conditions more clearly with Origin Recoil + Multi-Osc OB/OS Overlap
Measure the true speed behind every price move with Origin Recoil.
Confirm Overbought/Oversold overlap across multiple oscillators with Multi-Osc OB/OS Overlap.
Trader reality
Most traders focus heavily on:
- Structure
- Support and resistance
- Breakouts
- Candle patterns
But one important dimension is often ignored:
SPEED
On most chart types, candles appear regardless of how meaningful the underlying activity actually is.
Especially on Renko charts:
- Every brick is the same size
- Fast aggressive moves can look identical to slower moves
- The intensity behind price movement disappears completely
At the same time, traders using oscillators often face another issue:
One oscillator alone can produce unreliable Overbought/Oversold readings.
This creates confusion such as:
- Is momentum actually strong?
- Is price accelerating or slowing down?
- Is this Overbought/Oversold condition meaningful?
- Is momentum continuing or fading?
Core mechanism (what → why → result)
This combo combines:
Momentum speed analysis + Multi-oscillator overlap confirmation
What it does:
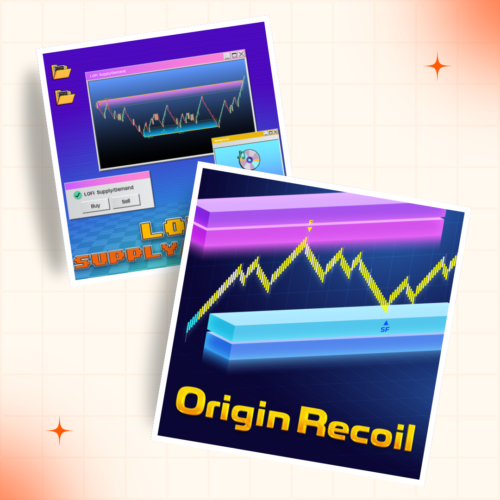
- Origin Recoil measures the speed at which candles form and detects abnormal acceleration
- Multi-Osc OB/OS Overlap combines MFI, RSI, and Stochastic to identify overlapping Overbought/Oversold conditions
Why it matters:
Instead of relying only on:
- Price structure
- Single oscillator readings
- Traditional candle analysis
You can now evaluate:
- Whether momentum is increasing or fading
- Whether aggressive participation is entering the market
- Whether multiple oscillators align in Overbought/Oversold territory
Result:
- Clearer momentum visibility
- Cleaner Overbought/Oversold confirmation
- Better visual understanding of market conditions
- Easier signal reading directly on the chart
Origin Recoil – See the true strength behind every price move
Origin Recoil focuses on something most indicators ignore:
The speed at which candles form – down to the millisecond
The indicator continuously:
- Measures candle formation speed
- Compares current speed to recent market behavior
- Detects when acceleration becomes abnormal
When abnormal acceleration appears, Origin Recoil forms a:
Burst Zone
These zones reveal where:
- Momentum increases significantly
- Aggressive participation enters the market
- Price begins moving faster than normal conditions
Fast Zone vs Superfast Zone
Origin Recoil classifies Burst Zones into 2 categories:
Fast Zone
- Strong momentum relative to recent conditions
- Often allows deeper pullbacks
- Common in less-defined or sideways conditions
Superfast Zone
- Extremely aggressive acceleration
- Often appears in strong trending conditions
- Pullbacks tend to remain shallow
This helps traders distinguish between different levels of momentum strength.
Momentum evolution inside the move
Each Burst Zone contains 2 internal layers:
- If the second half forms faster → momentum is accelerating
- If the first half forms faster → momentum is fading
This helps traders evaluate:
- Whether the move is gaining strength
- Or already losing momentum
Fast & Superfast signals
Origin Recoil also provides:
Fast Signals
Generated when price revisits a Fast Zone.
Typically seen in:
- Sideways markets
- Developing momentum conditions
- Deeper pullback environments
Superfast Signals
Generated when price revisits a Superfast Zone.
Typically seen in:
- Strong trends
- Sustained aggressive momentum
- Shallow pullback conditions
The indicator also visualizes candle speed through color changes, helping traders identify whether candles form slowly, quickly, or extremely fast.
Multi-Osc OB/OS Overlap – Multi-oscillator overbought/oversold confirmation
Multi-Osc OB/OS Overlap combines:
- Money Flow Index (MFI)
- Relative Strength Index (RSI)
- Stochastic
The purpose of this combination is simple:
Increase the probability of identifying correct Overbought/Oversold areas
How it works
The indicator displays oscillator states using color-coded lines:
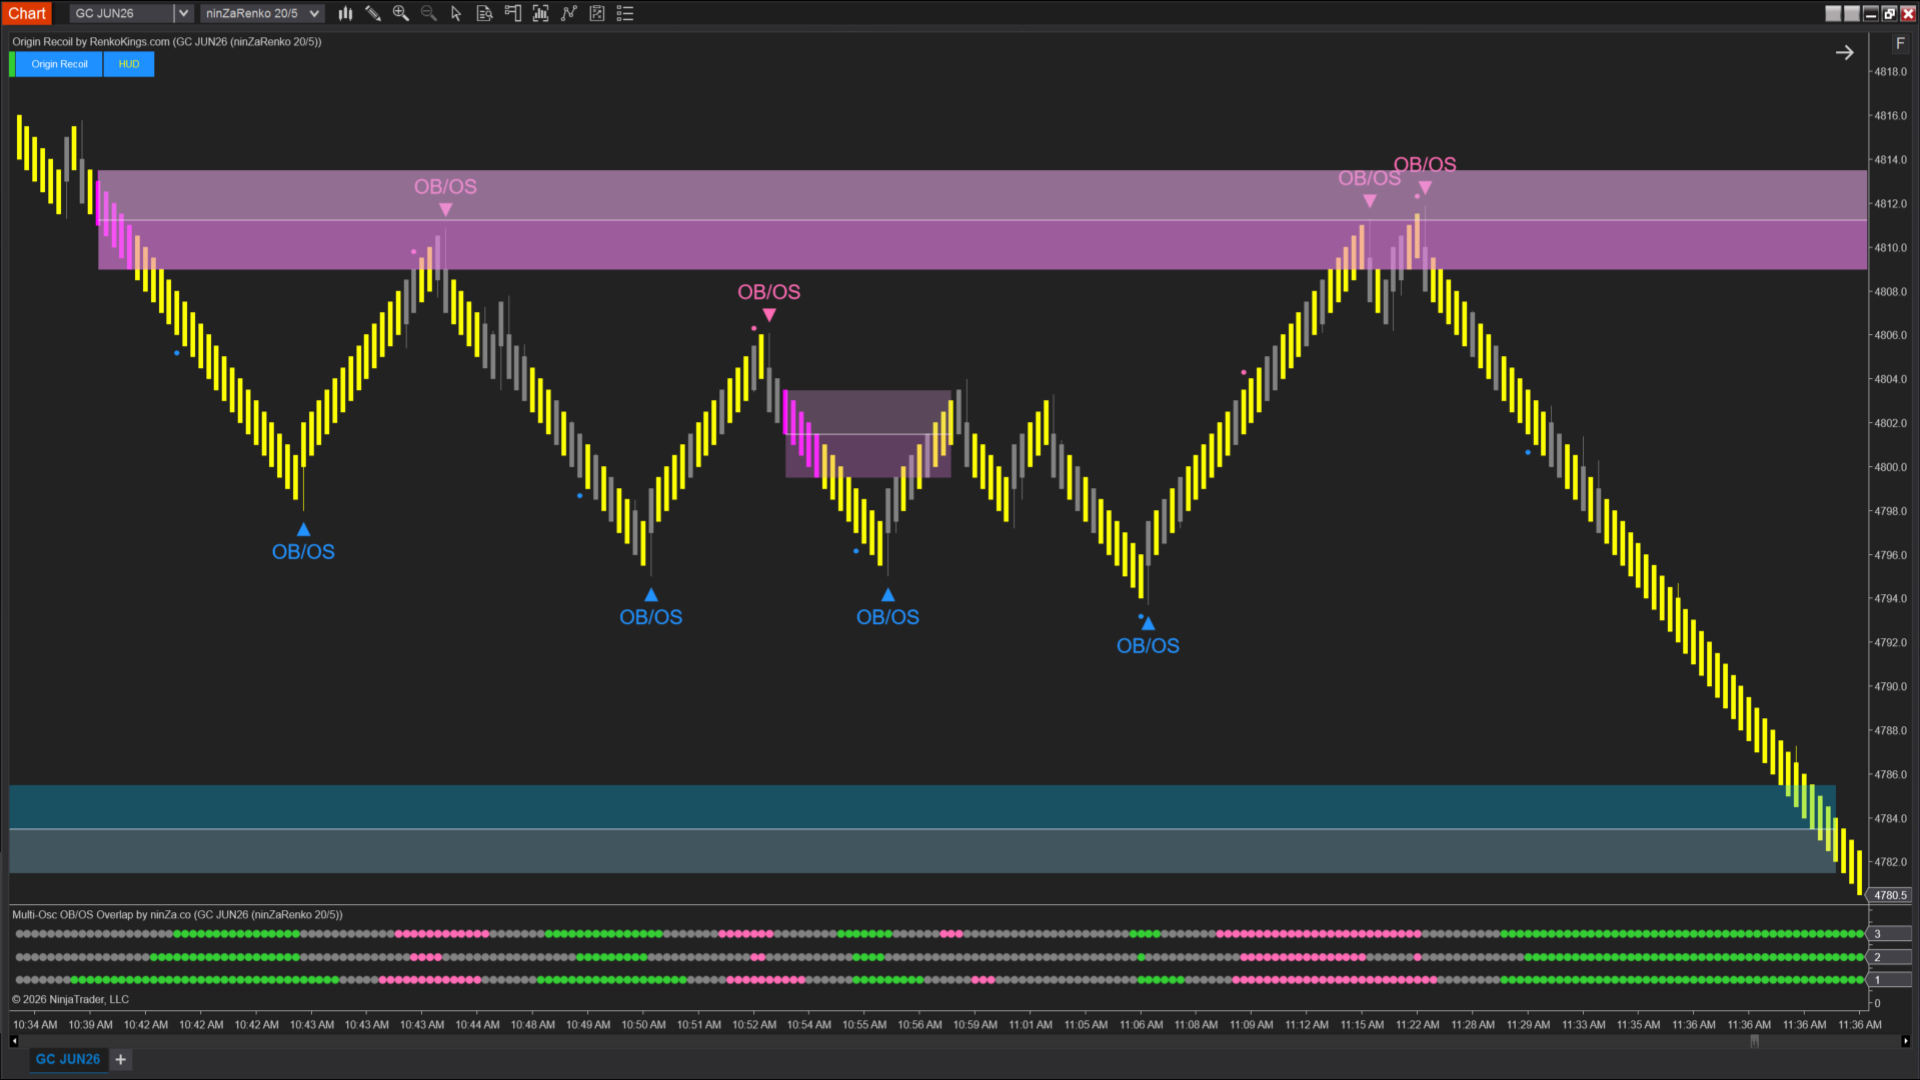
- Green → Oversold
- Pink → Overbought
- Grey → Neutral
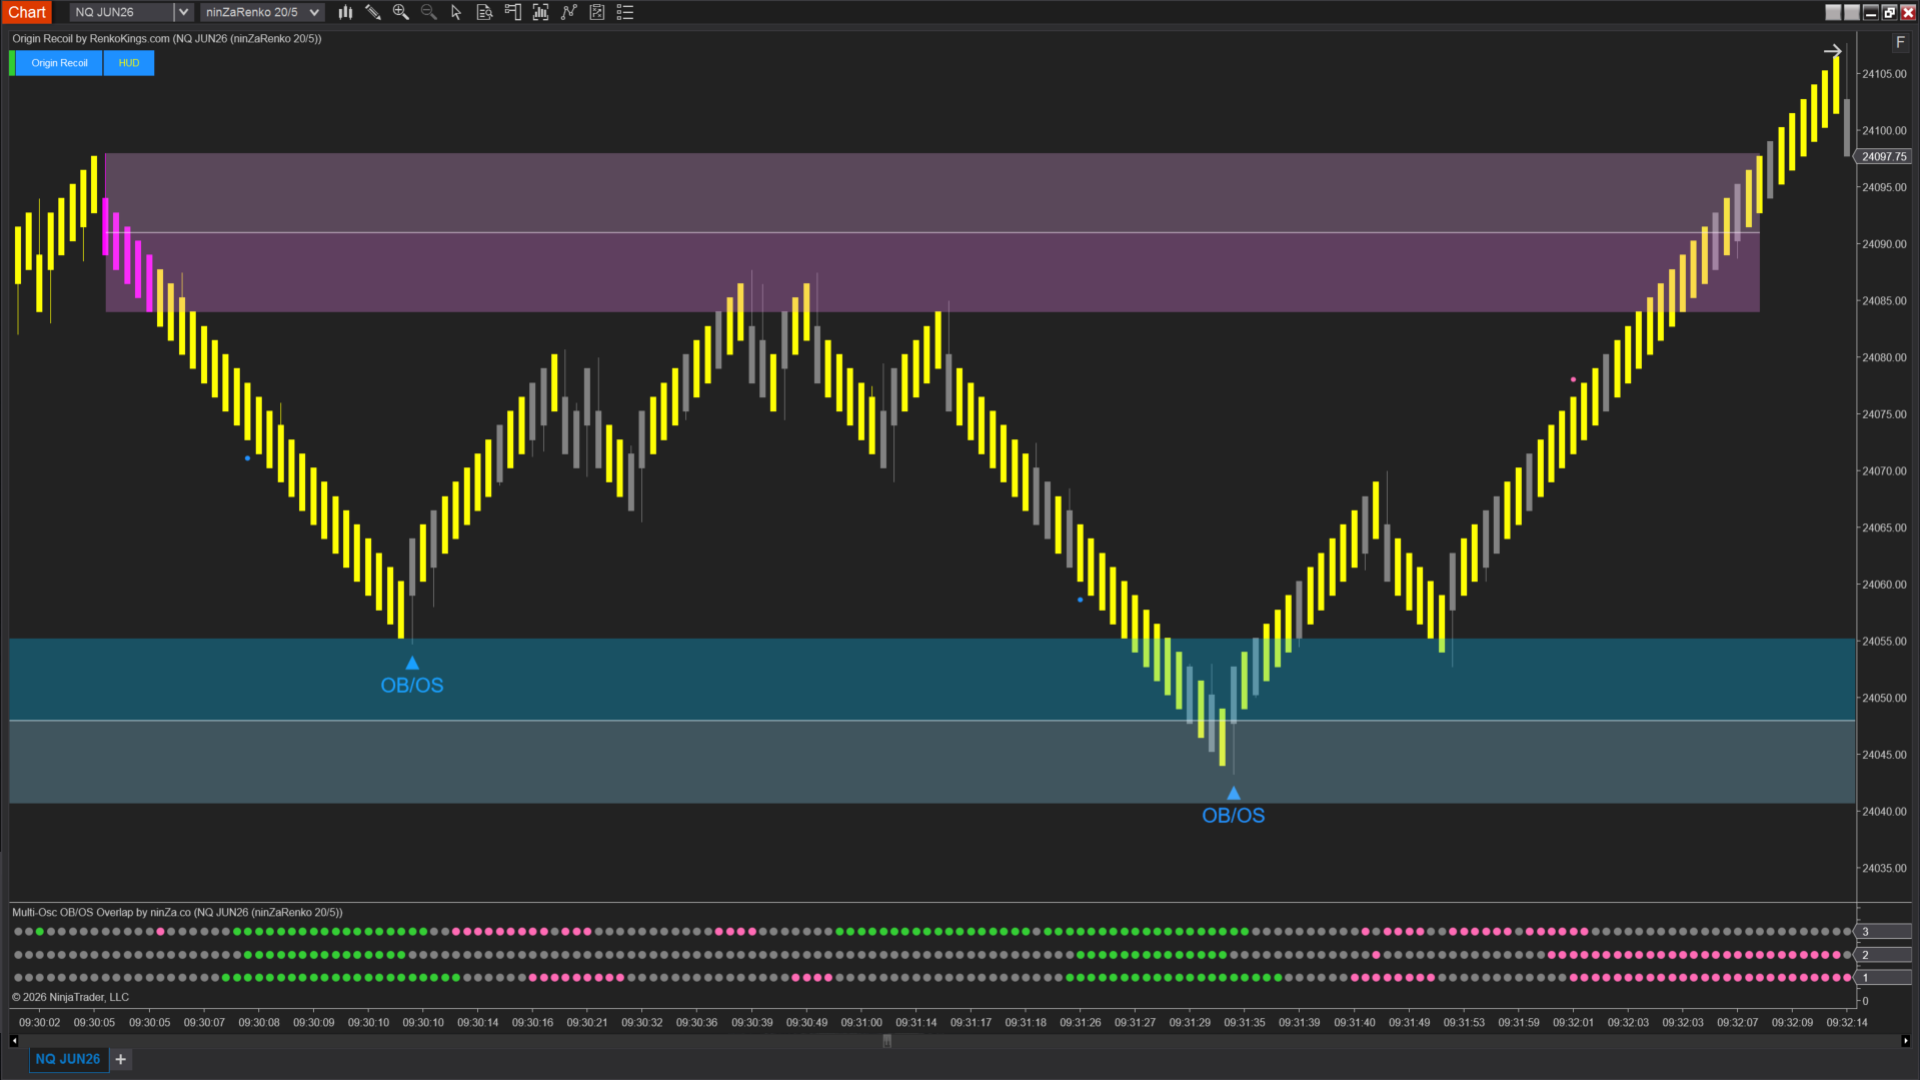
When all 3 oscillators overlap in Overbought or Oversold conditions:
- The chart background is painted automatically
- Chart markers appear
- Overlap zones become easier to identify visually
This creates a much cleaner experience compared to applying multiple oscillators separately on the chart.
Adjustable threshold settings
You can configure:
- Threshold High
- Threshold Low
for:
- MFI
- RSI
- Stochastic
separately.
Increasing threshold values:
- Reduces the number of signals
- May improve signal accuracy
Combo edge
Step 1 – Measure momentum speed
Use Origin Recoil to identify:
- Burst Zones
- Fast Zones
- Superfast Zones
- Momentum acceleration or fading
Step 2 – Confirm OB/OS overlap
Use Multi-Osc OB/OS Overlap to confirm:
- Multiple oscillator alignment
- Overbought overlap
- Oversold overlap
What this changes
- No more relying on a single oscillator alone
- No more treating all momentum moves equally
- Better visual clarity directly on the chart
- Easier recognition of acceleration and Overbought/Oversold overlap conditions
Special offer
Origin Recoil: $600 value
Multi-Osc OB/OS Overlap: $600 value
1-year product updates: $240 value
Personalized support: $50 value
Total value: $1,460 → Today only: $400
Related products
Sale!

Sale!
![[AbsP] MEO #9: Origin Recoil + Imbalance Volume Sensor](https://renkokings.com/wp-content/uploads/origin-recoil-Imbalance-Volume-Sensor-edsfcsdfsdfsadasdasd.png)
Sale!
Sale!
Sale!
![[AbsP] MEO #11: Origin Recoil + Noble Cloud](https://renkokings.com/wp-content/uploads/origin-recoil-fvrsdgvdzsfcdxasdas.png)
Sale!
![[AbsP] MEO #12: Origin Recoil + Support/Resistance Radar](https://renkokings.com/wp-content/uploads/origin-support-resistance-jfd-500x500.png)
Sale!
![[AbsP] MEO #8: Origin Recoil + Sumo Pullback$](https://renkokings.com/wp-content/uploads/origin-recoilsumo-pullback-fresdsfsdfsdfsdfsdffgvfdgghbdgdsfg.png)
Sale!