
Chapter 4: The Precision OB/OS Solution trading checklist
When trading, you do not need to guess which indicator looks more convincing than another. You simply need to follow a fixed sequence. Start with the market context, then look for the Keltner reversal candle. Only after that should you check Momentum and RSI. If any step is missing, the setup is incomplete, even if the candle looks strong or price seems ready to move without you.
4.1. BUY Setup – From Oversold territory to a buy signal
Step 1 – Price drops sharply and RSI enters Oversold
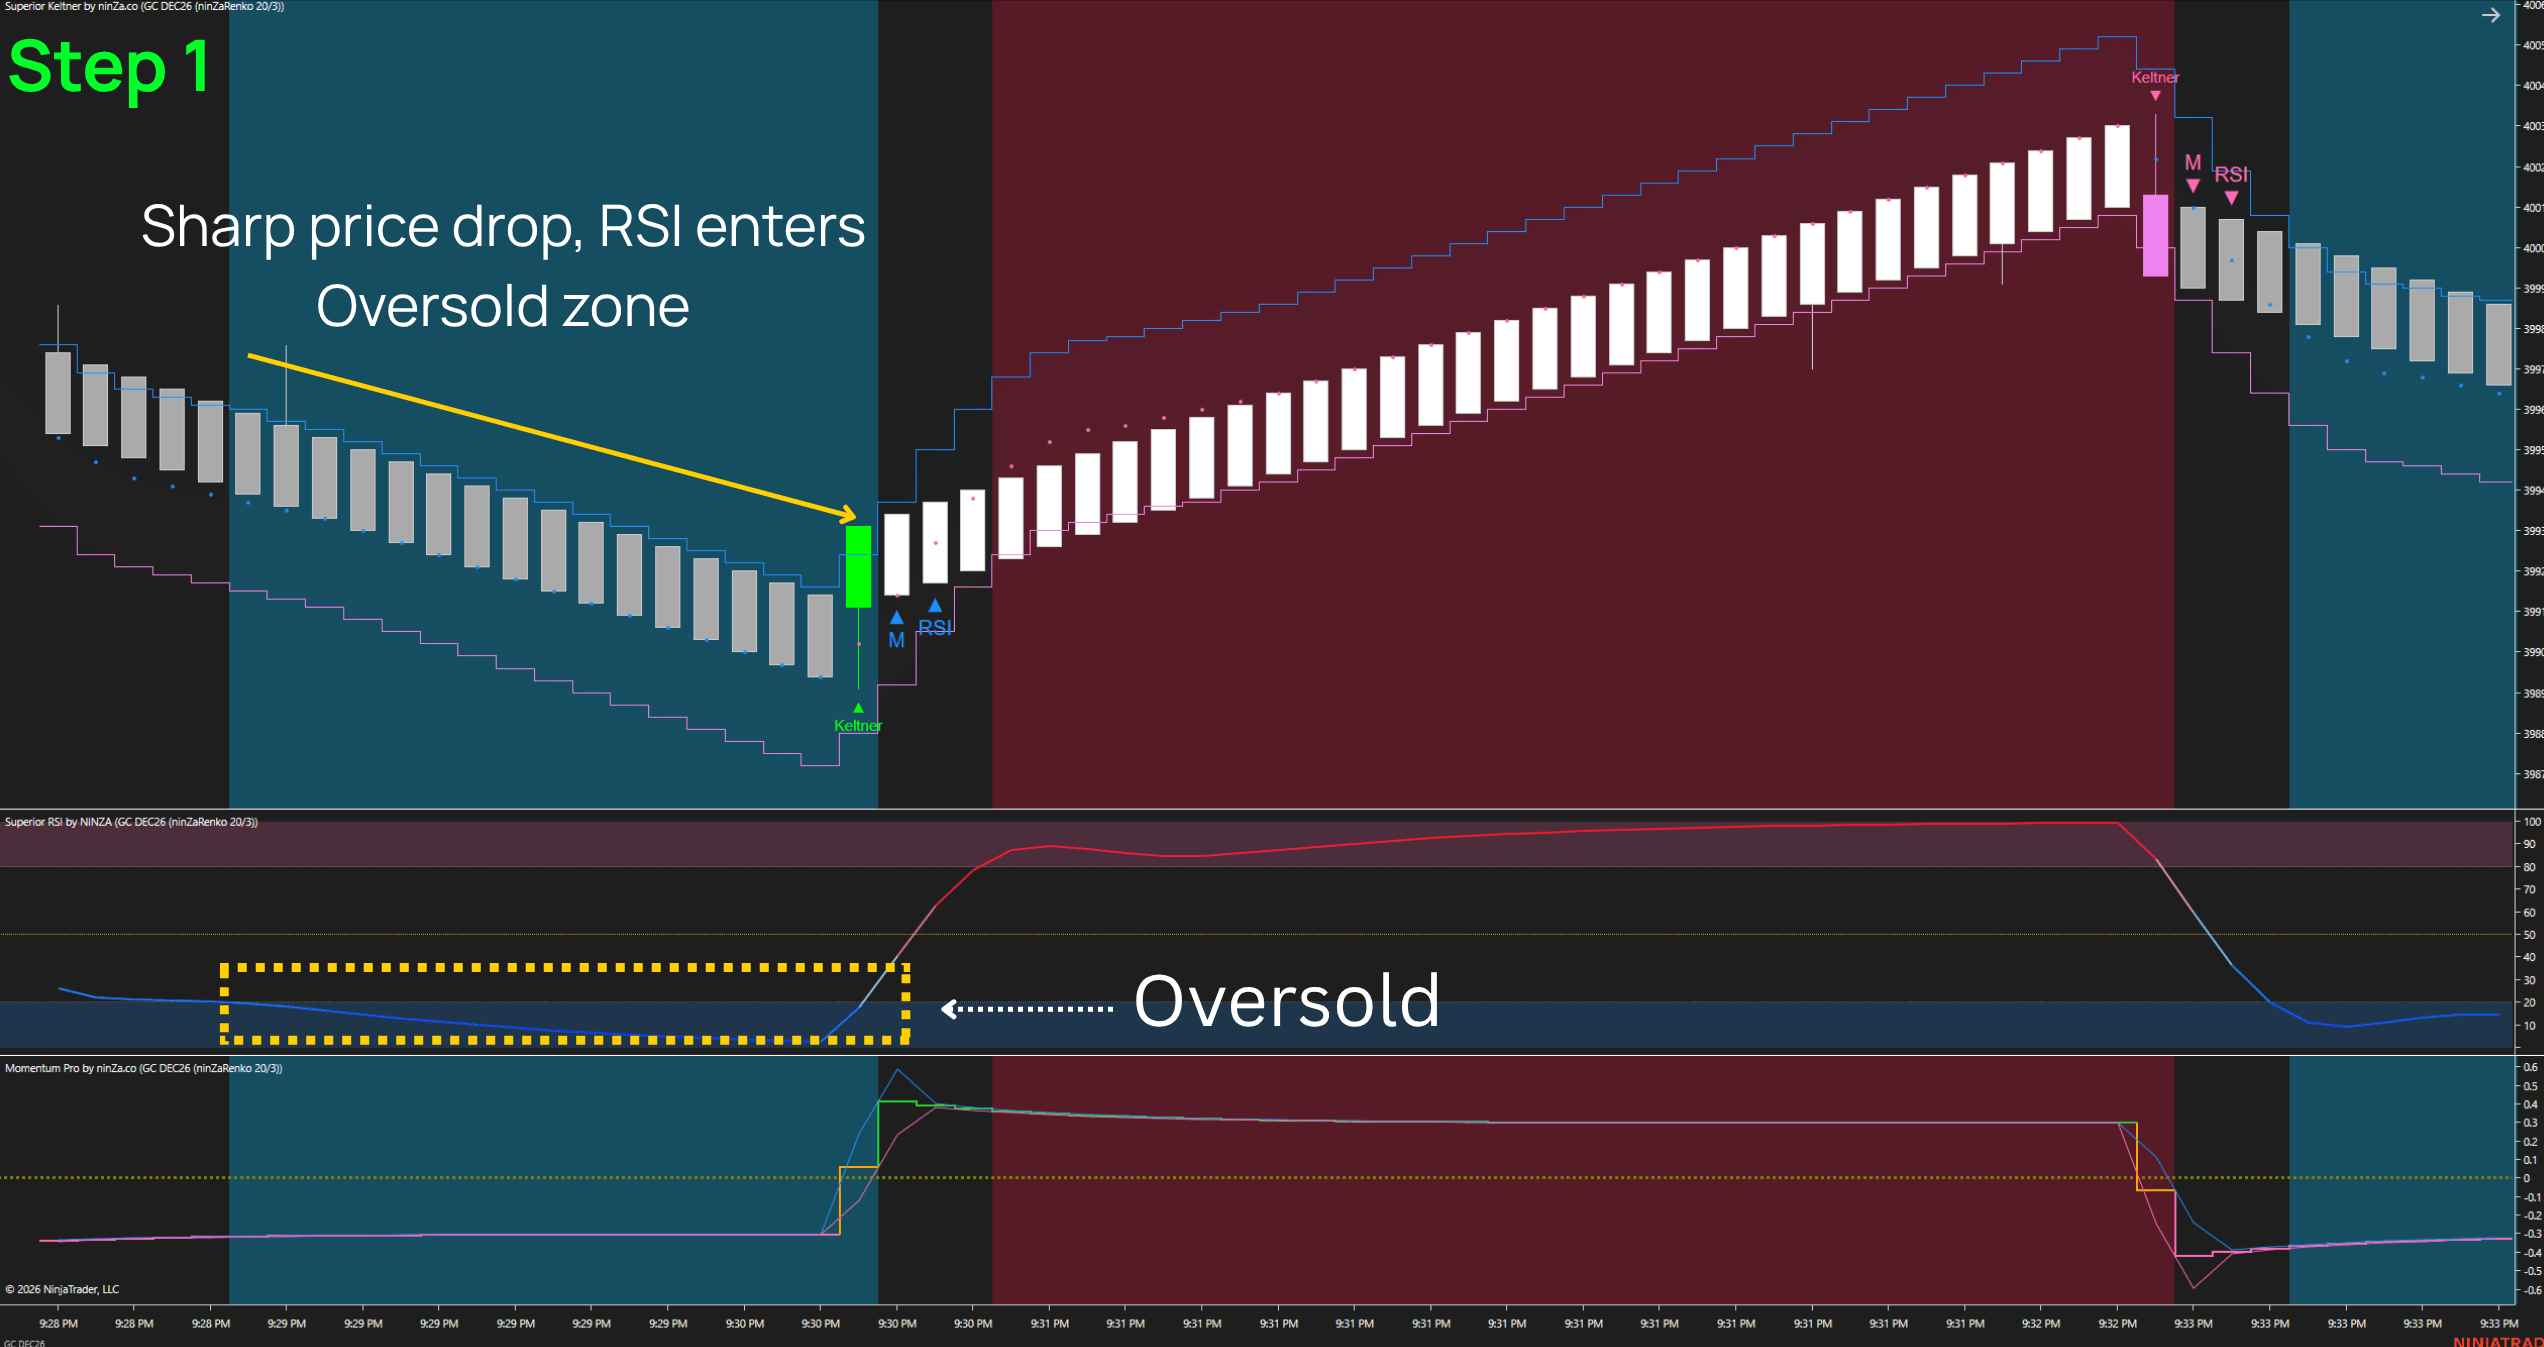
On the Renko chart, price is moving lower in a clear sequence of bearish bricks. The Lower Band of Superior Keltner slopes steeply downward, while the Upper Band tracks closely along the bearish bricks. At the same time, Superior RSI enters Oversold (OS) territory. When these conditions align, traders begin watching for a potential Buy opportunity. However, there is still no reason to enter a Buy simply because RSI has fallen to a low level.
Step 2 – A Bullish brick closes above the upper Keltner band
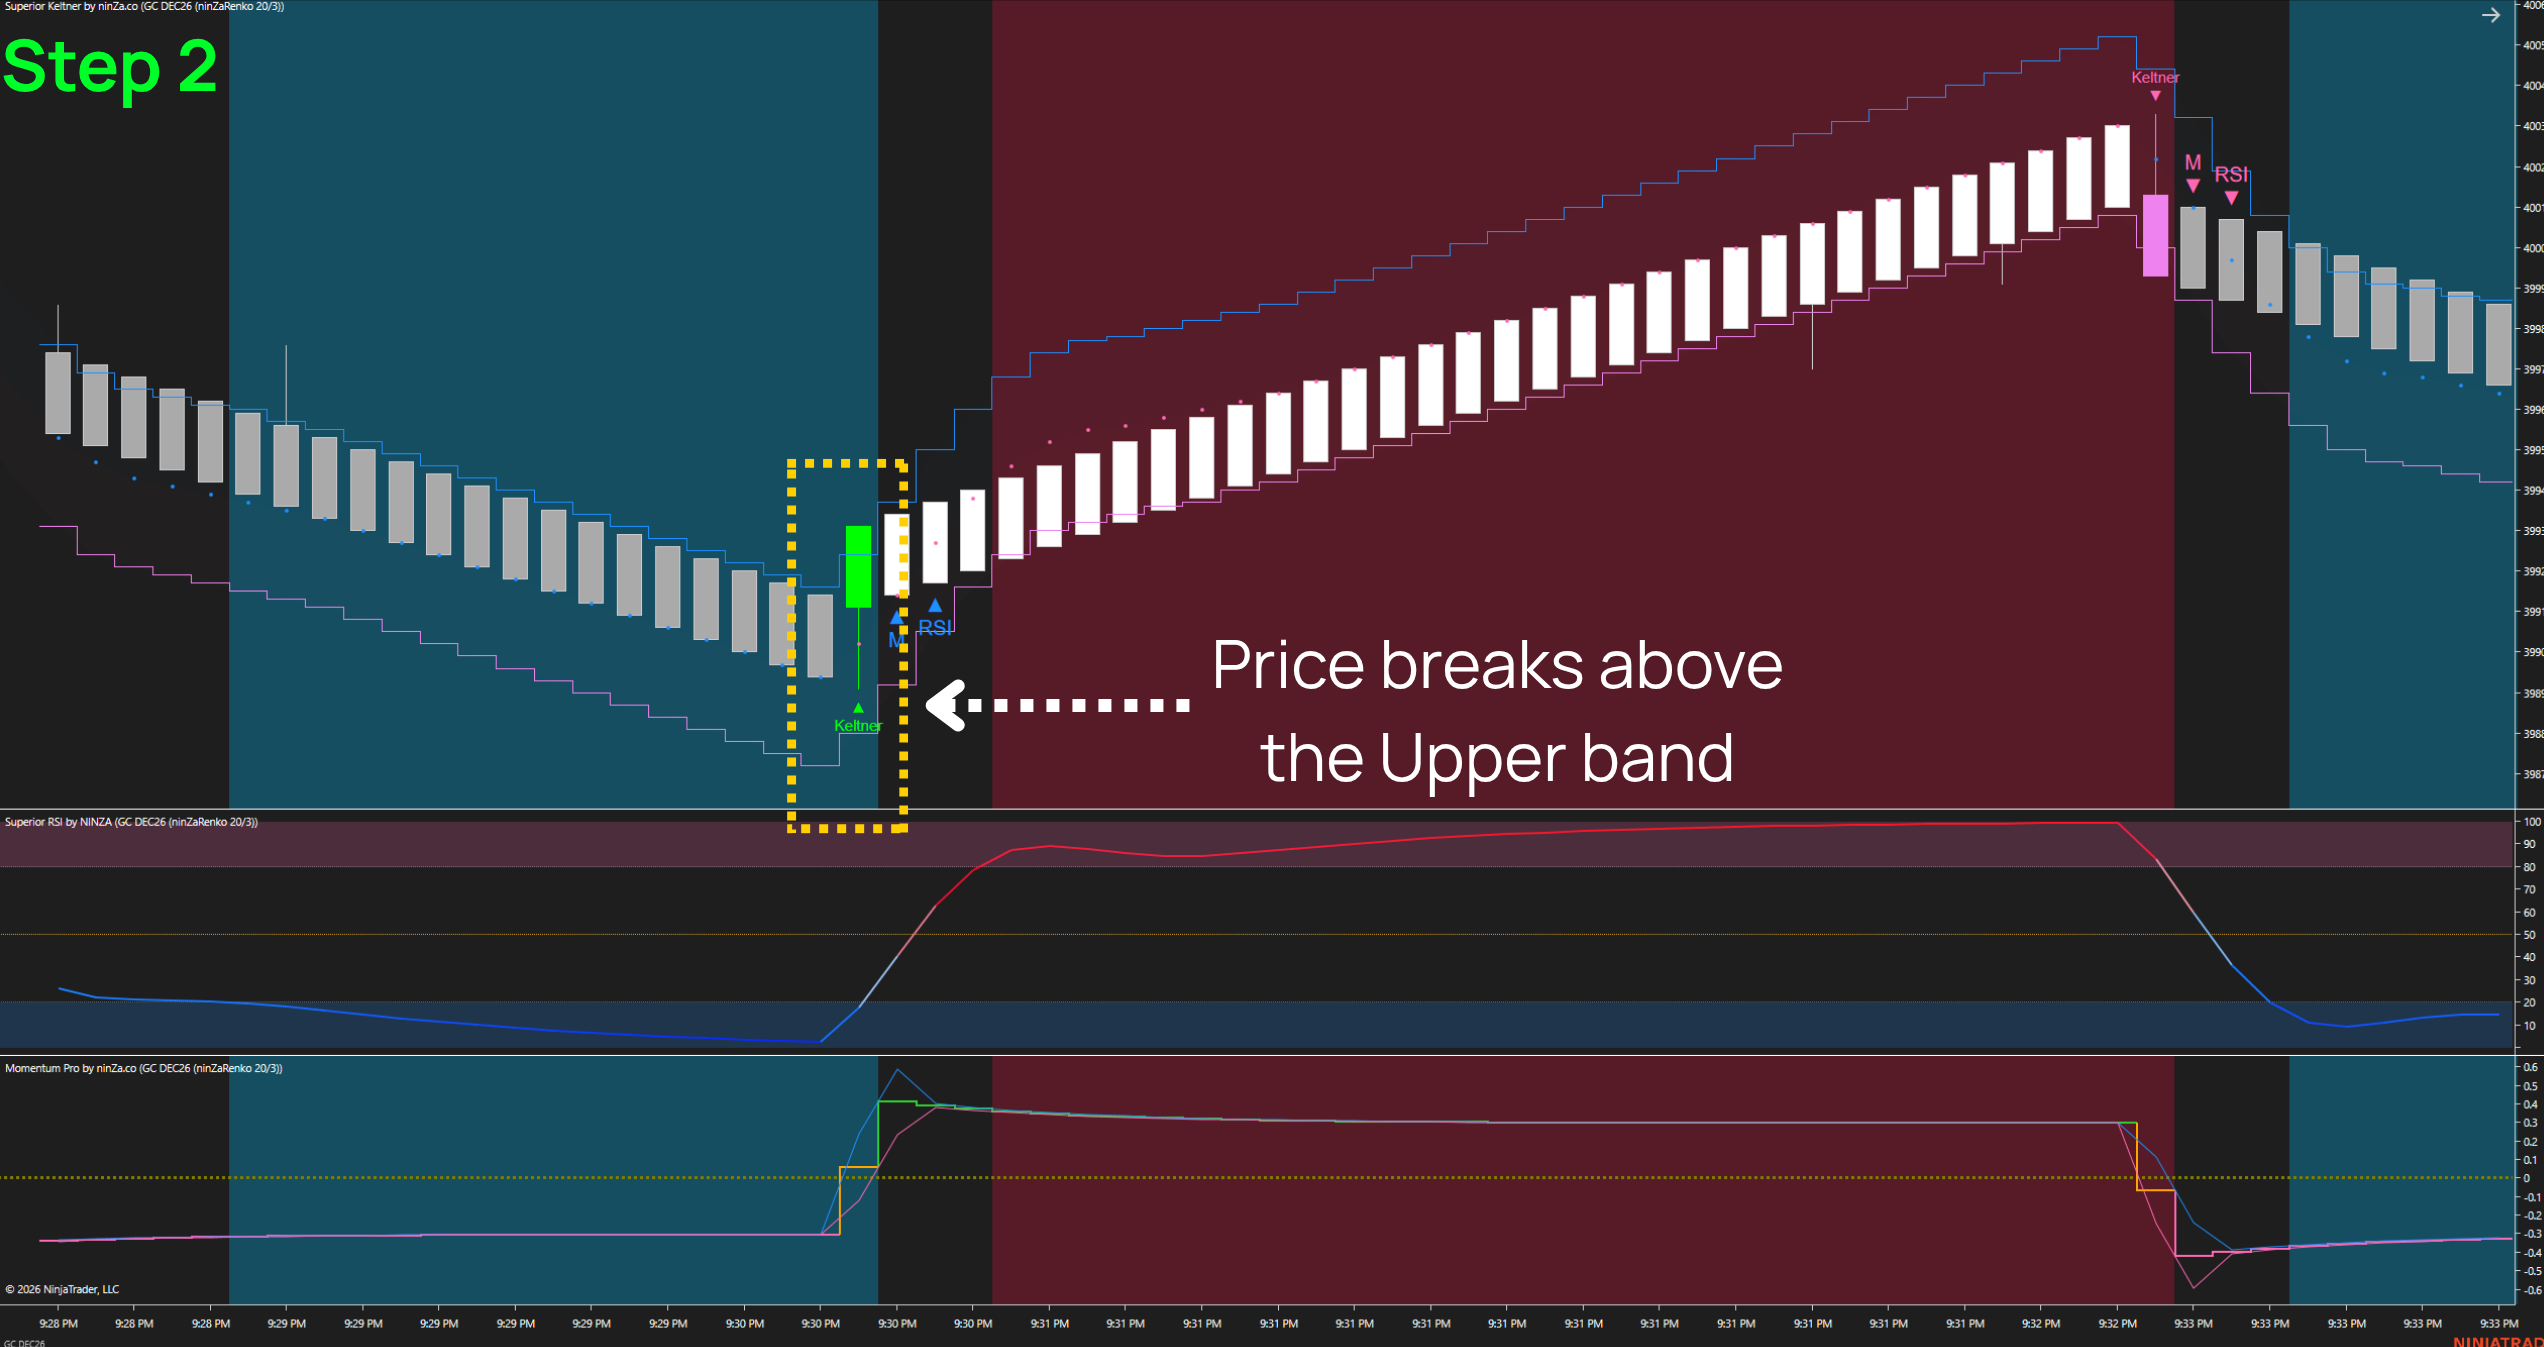
While RSI remains in the Oversold territory, wait for a bullish Renko brick to reverse and close above the Upper Band of Superior Keltner. This is the first reversal signal. Remember that the brick must close above the band. A touch, a brief move beyond the band followed by a return, or a brick that is still forming does not qualify. A valid signal should be clearly visible on the chart, without requiring the trader to guess.
Step 3 – The momentum plot crosses above the zero line
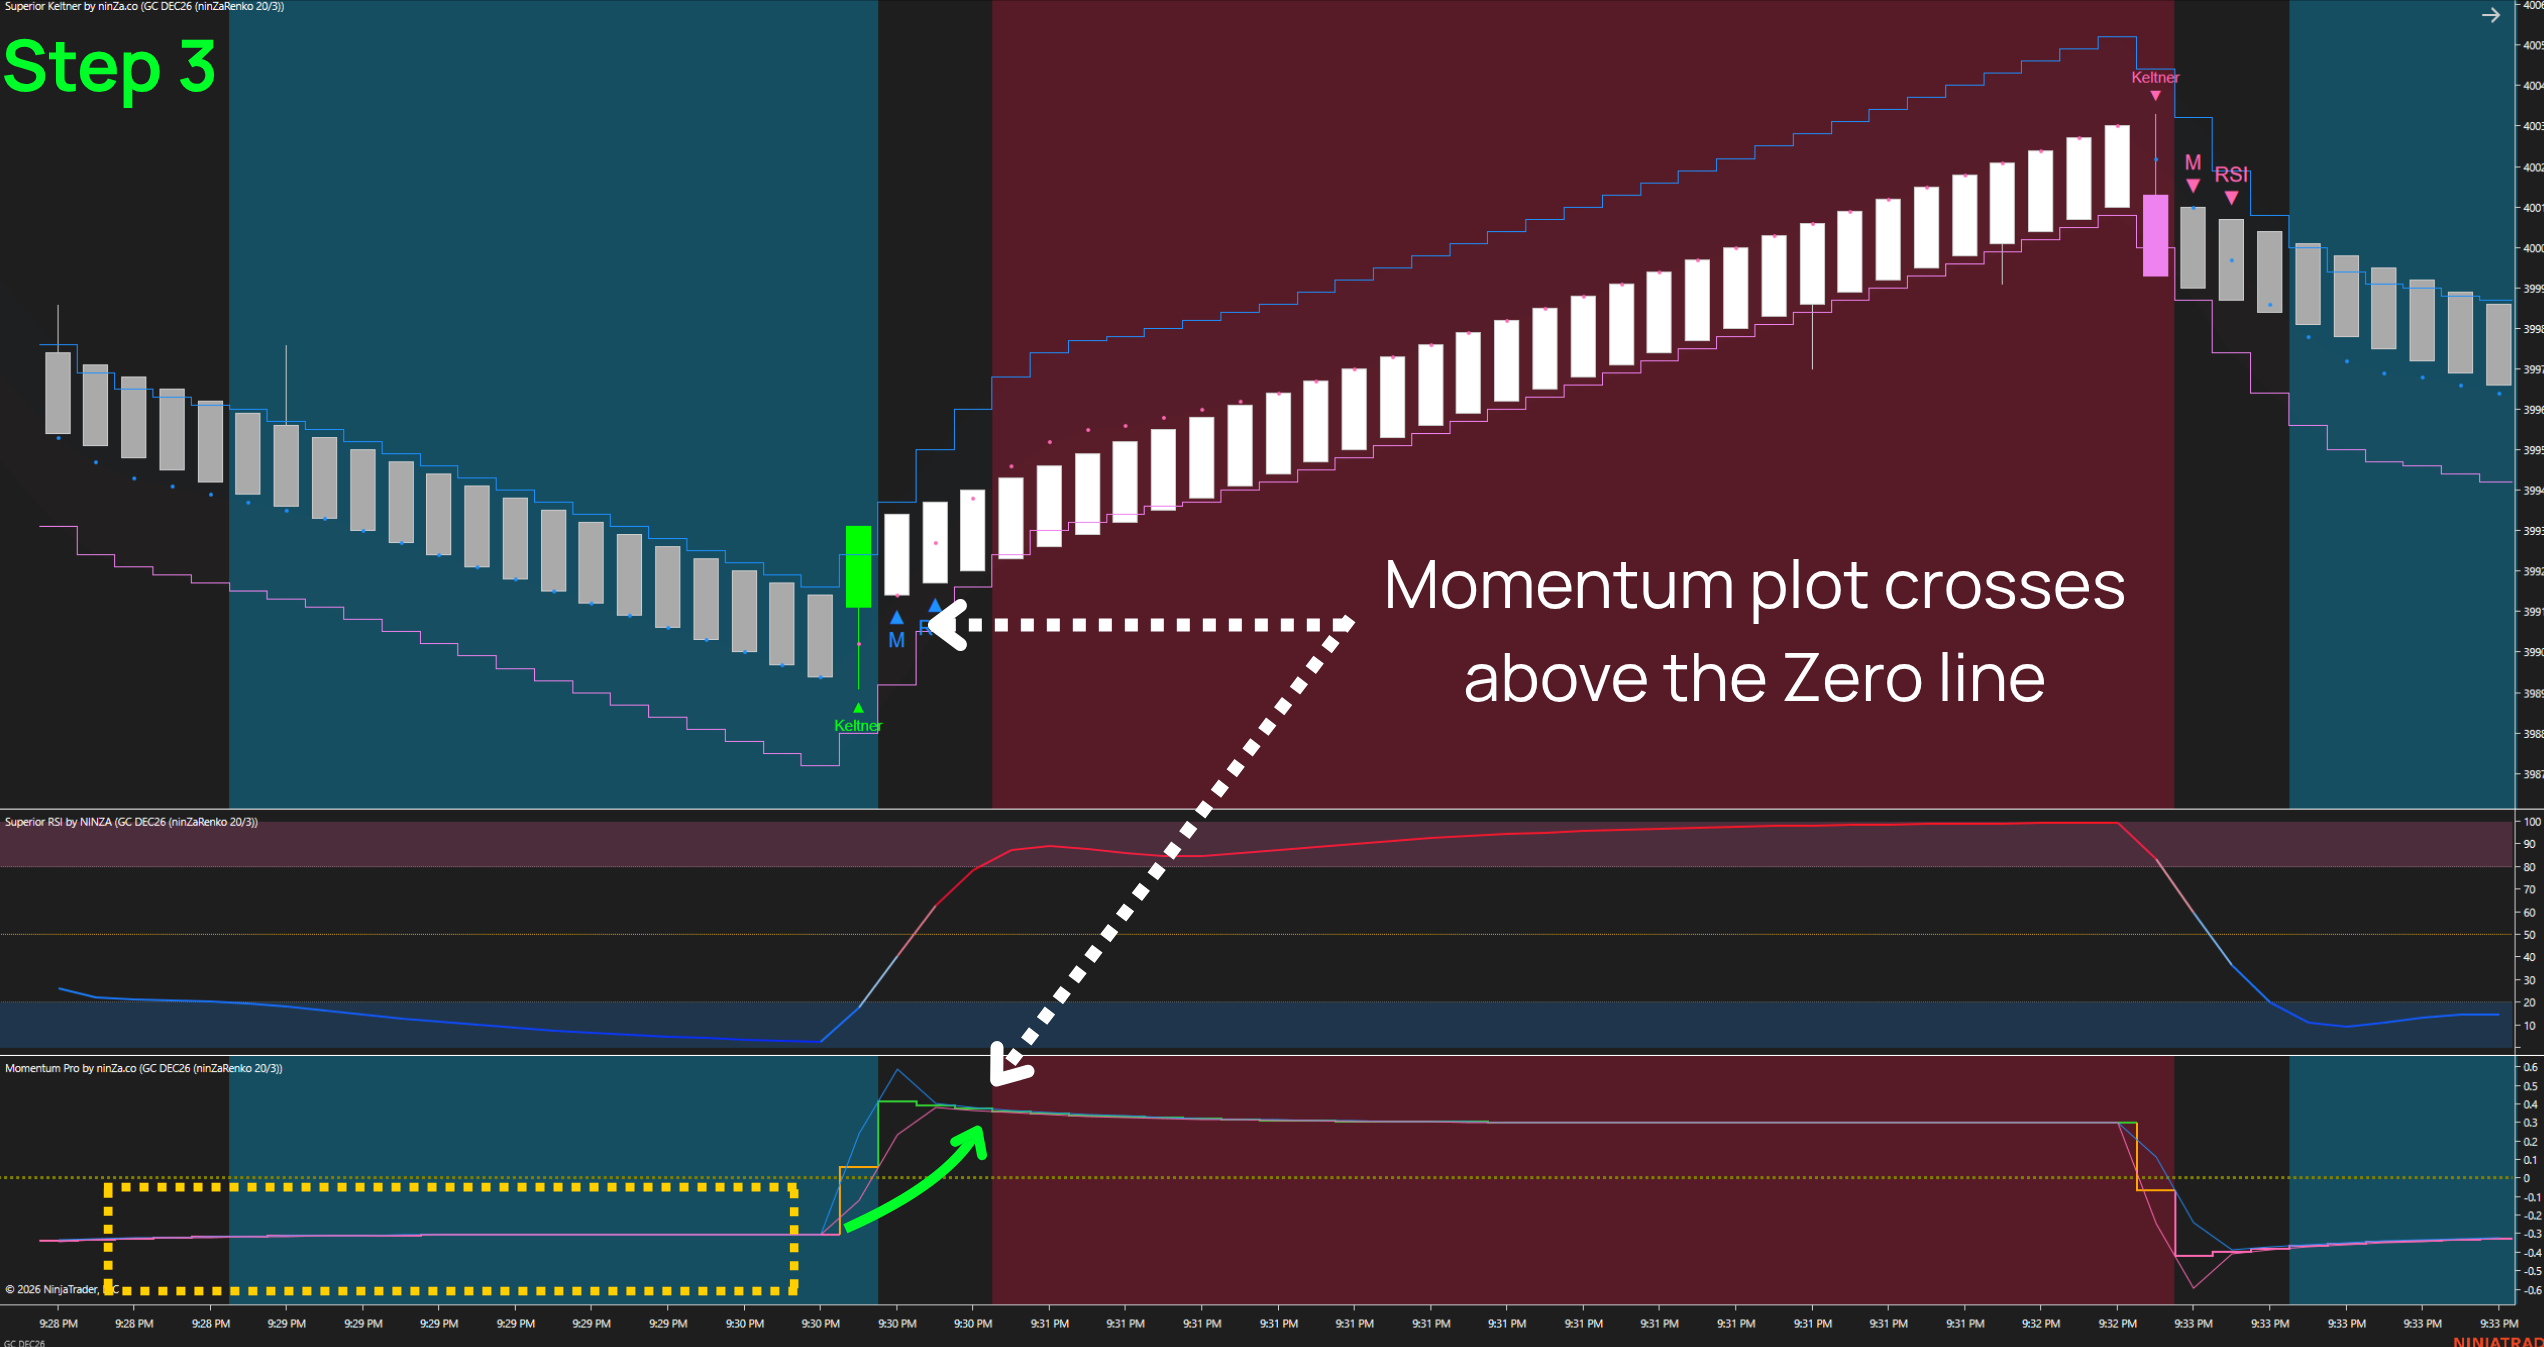
After the Keltner signal appears, look at the Momentum Pro panel below the chart. The Momentum Plot must cross from below to above the Zero Line, indicating that momentum is shifting in favor of buyers. At this step, use the Momentum Plot itself – not the Upper or Lower Bound lines or any other trend signal from the indicator.
Step 4 – RSI crosses above 50 from Oversold
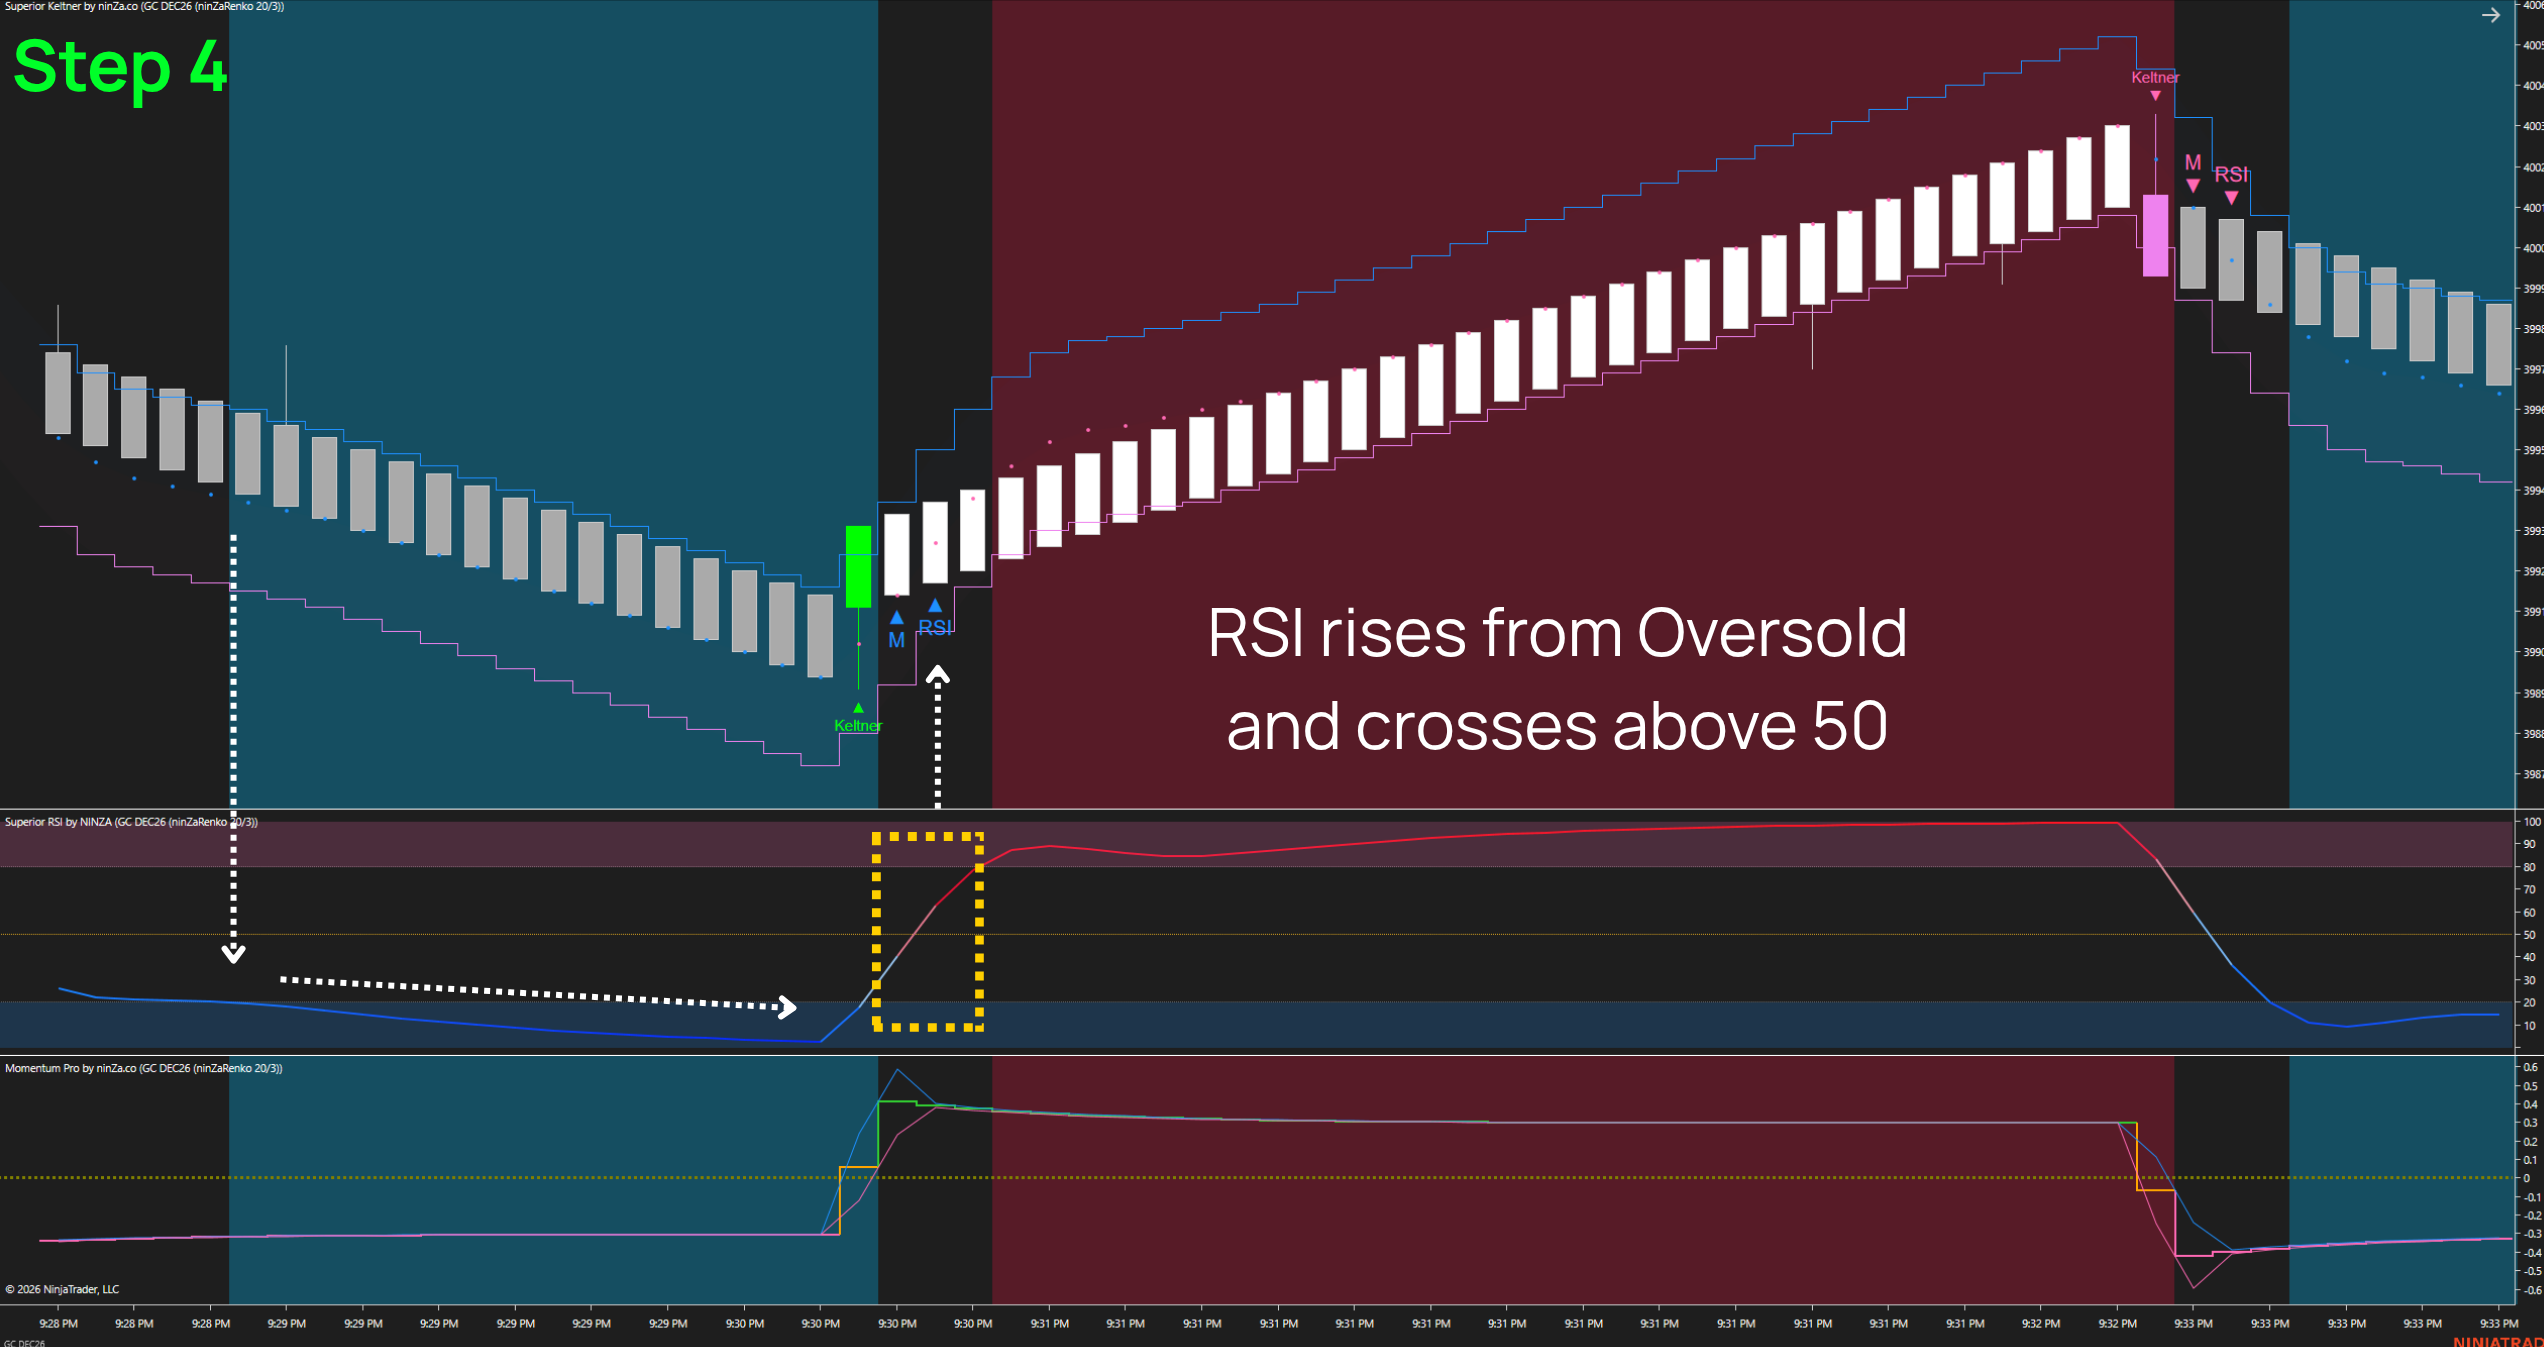
Finally, RSI moves up from OS territory and crosses above the Middle Line (50). The Buy checklist is complete only when all four steps occur in the correct order. At this point, traders can consider an Entry after reviewing the available room for the Stop and Target. If price has already moved too far before RSI confirms the setup, it may still be better to skip the trade, even when all checklist conditions have been met.
BUY Setup Checklist
- Step 1: Price declines, the Lower Band slopes downward, the Upper Band tracks the bearish bricks, and RSI enters OS.
- Step 2: While RSI remains in OS, a bullish Renko brick closes above the Upper Band.
- Step 3: The Momentum Plot crosses above the Zero Line after Step 2.
- Step 4: RSI crosses above 50 from OS after Step 3 → Consider a Buy Entry.
4.2. SELL Setup – From Overbought territory to a sell signal
Step 1 – Price rises sharply, and RSI enters Overbought
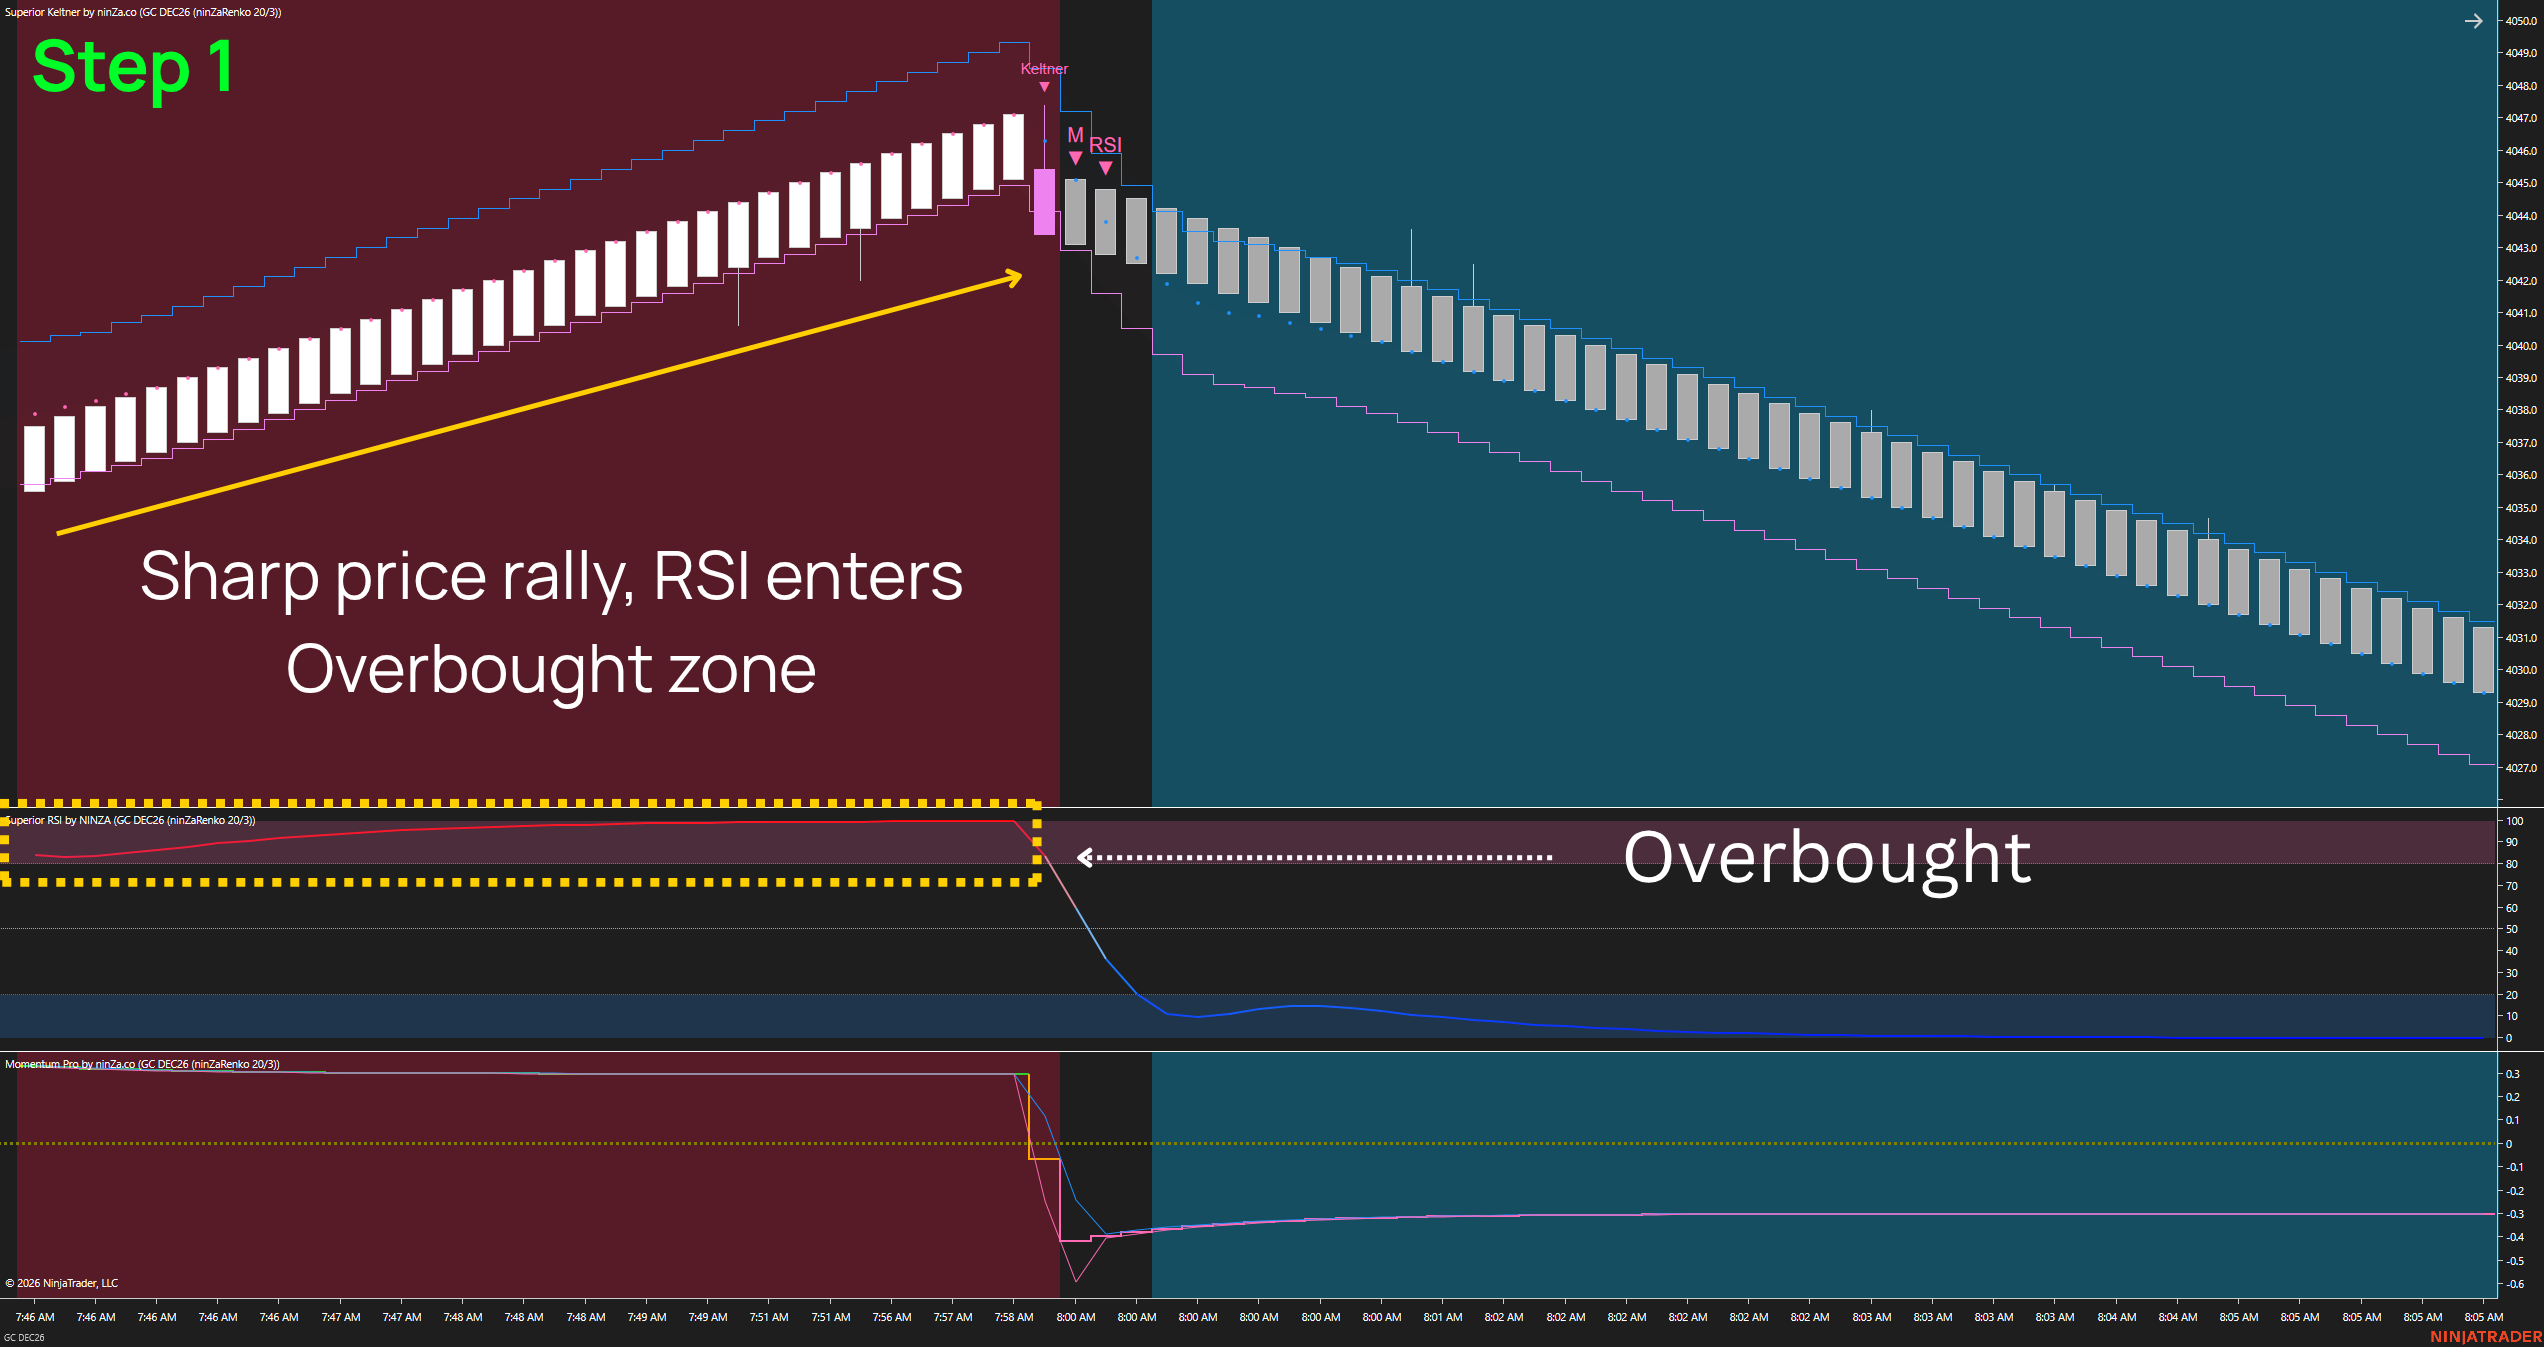
Price is moving higher in a clear sequence of bullish Renko bricks. The Upper Band of Superior Keltner slopes upward, while the Lower Band tracks closely along the bullish bricks. Superior RSI enters Overbought (OB) territory. This is the point to start watching for a potential Sell opportunity, not a signal to sell immediately at the high.
Step 2 – A Bearish brick closes below the lower Keltner band
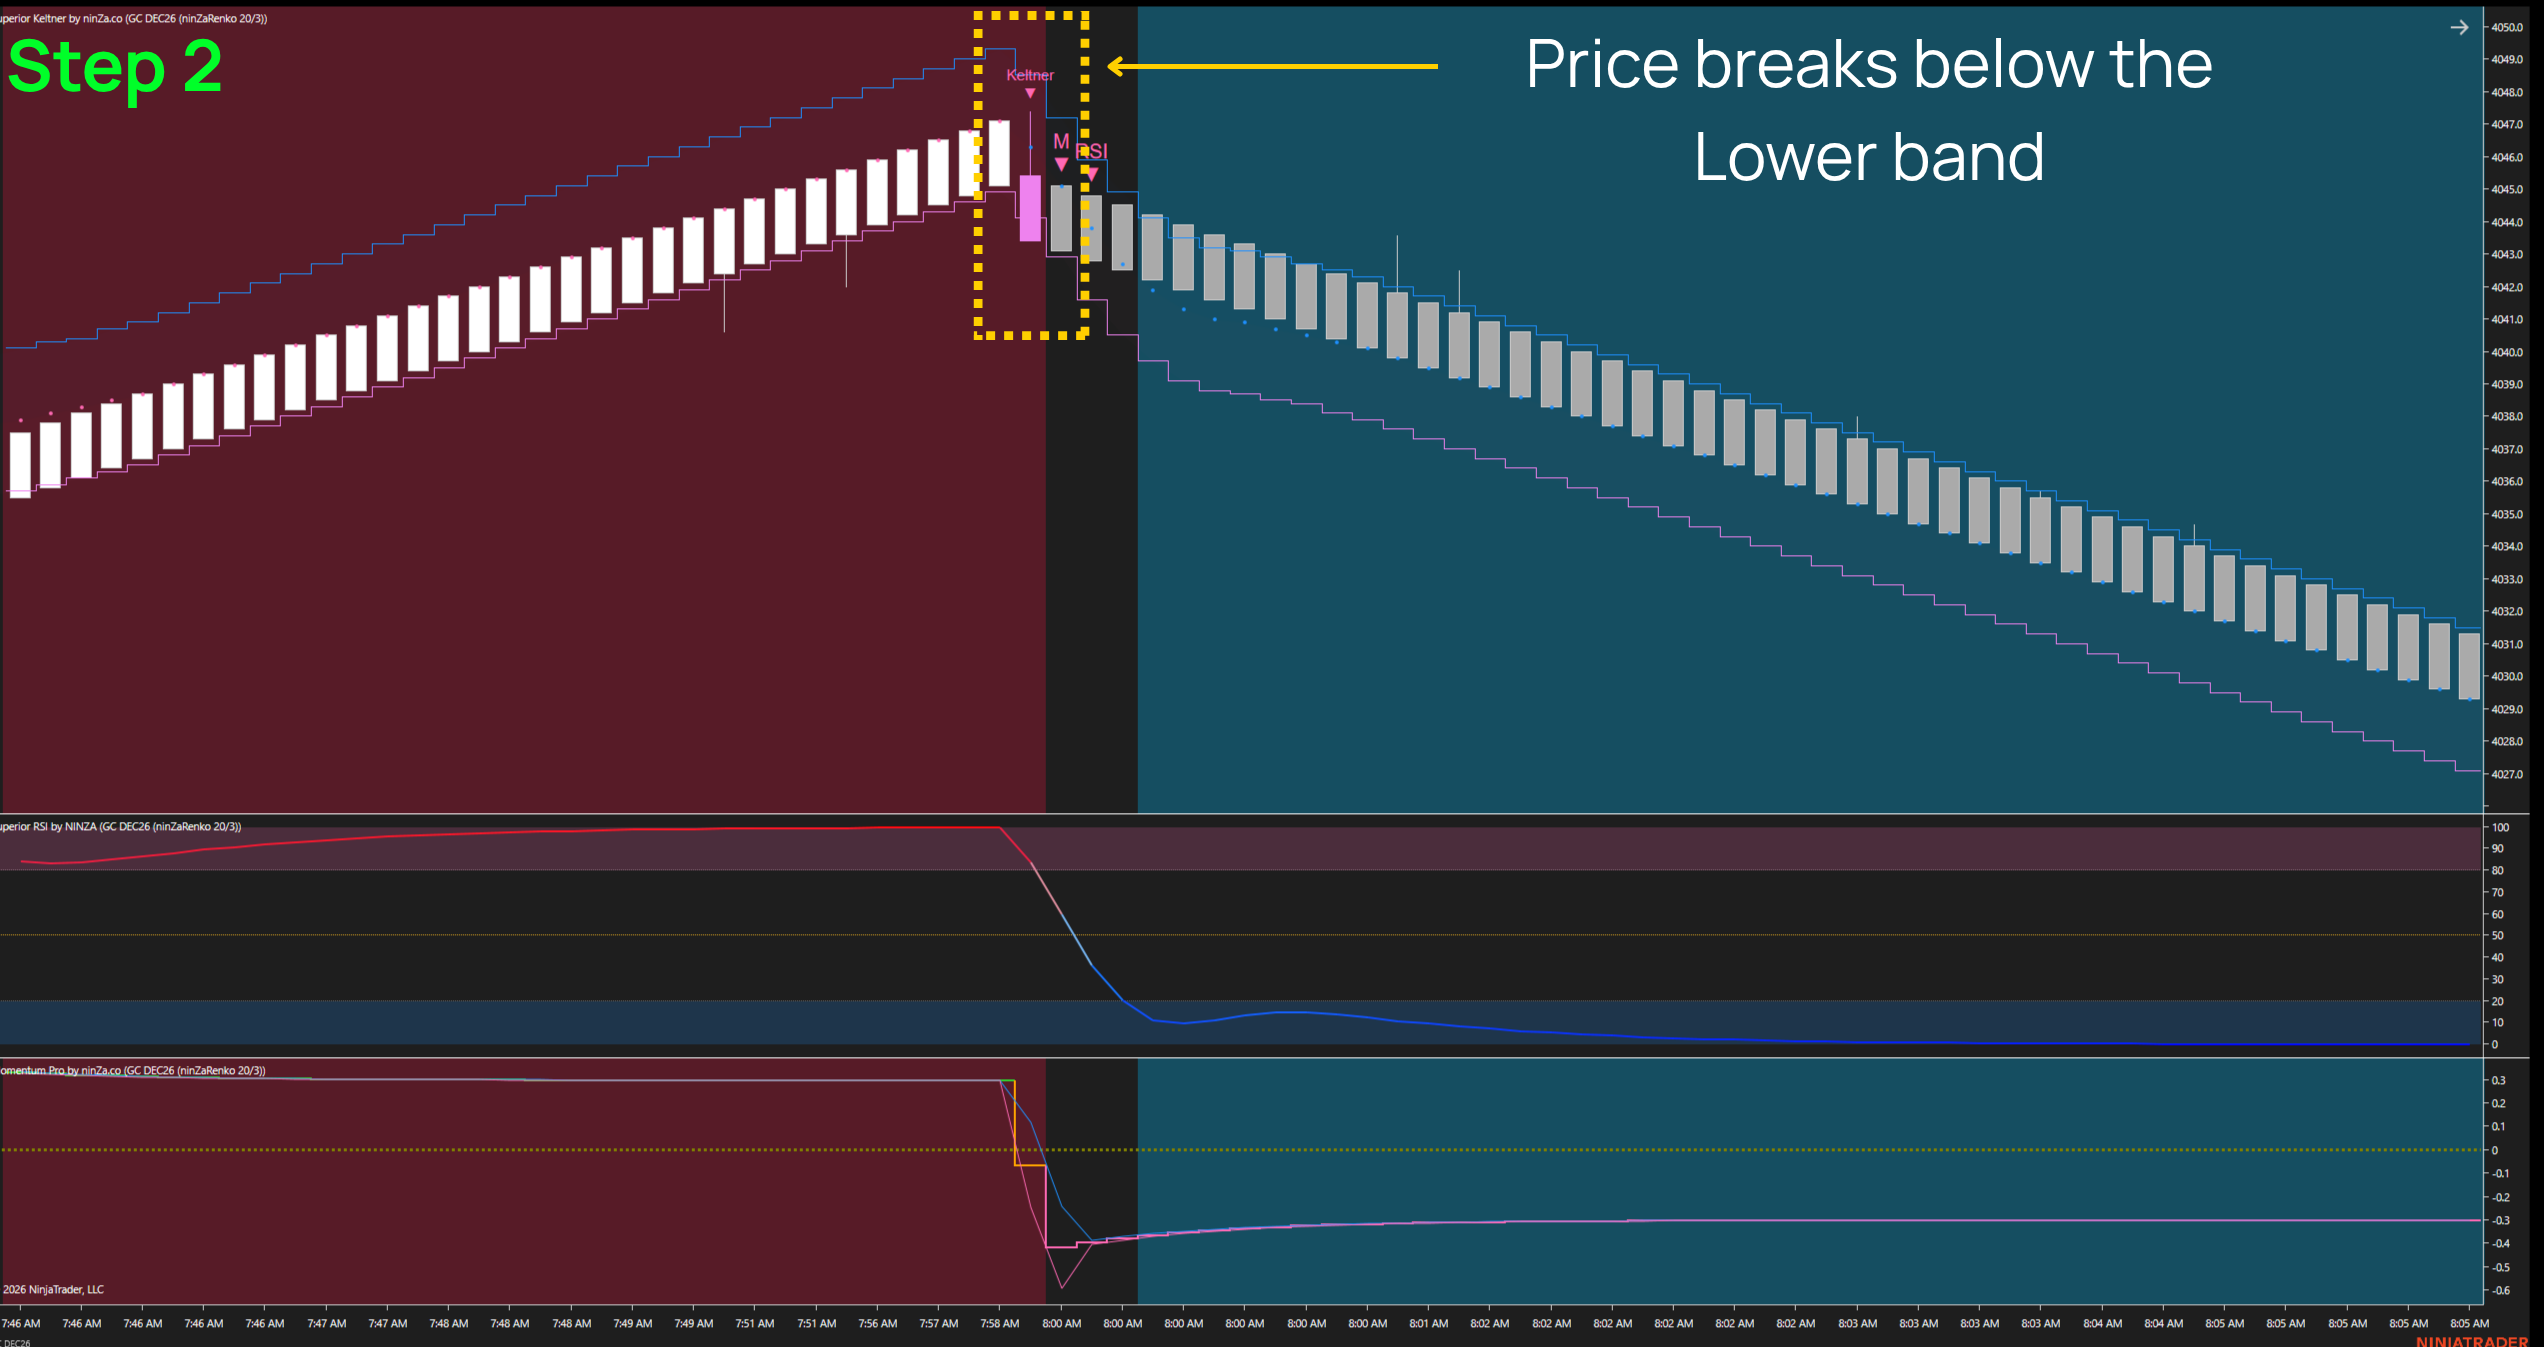
While RSI remains in OB territory, wait for a bearish Renko brick to reverse and close below the Lower Band. A brick that briefly moves through the band but does not close below it does not qualify. If Step 2 is not clearly met, do not look for reasons to enter a Sell early.
Step 3 – The momentum plot crosses below the Zero line
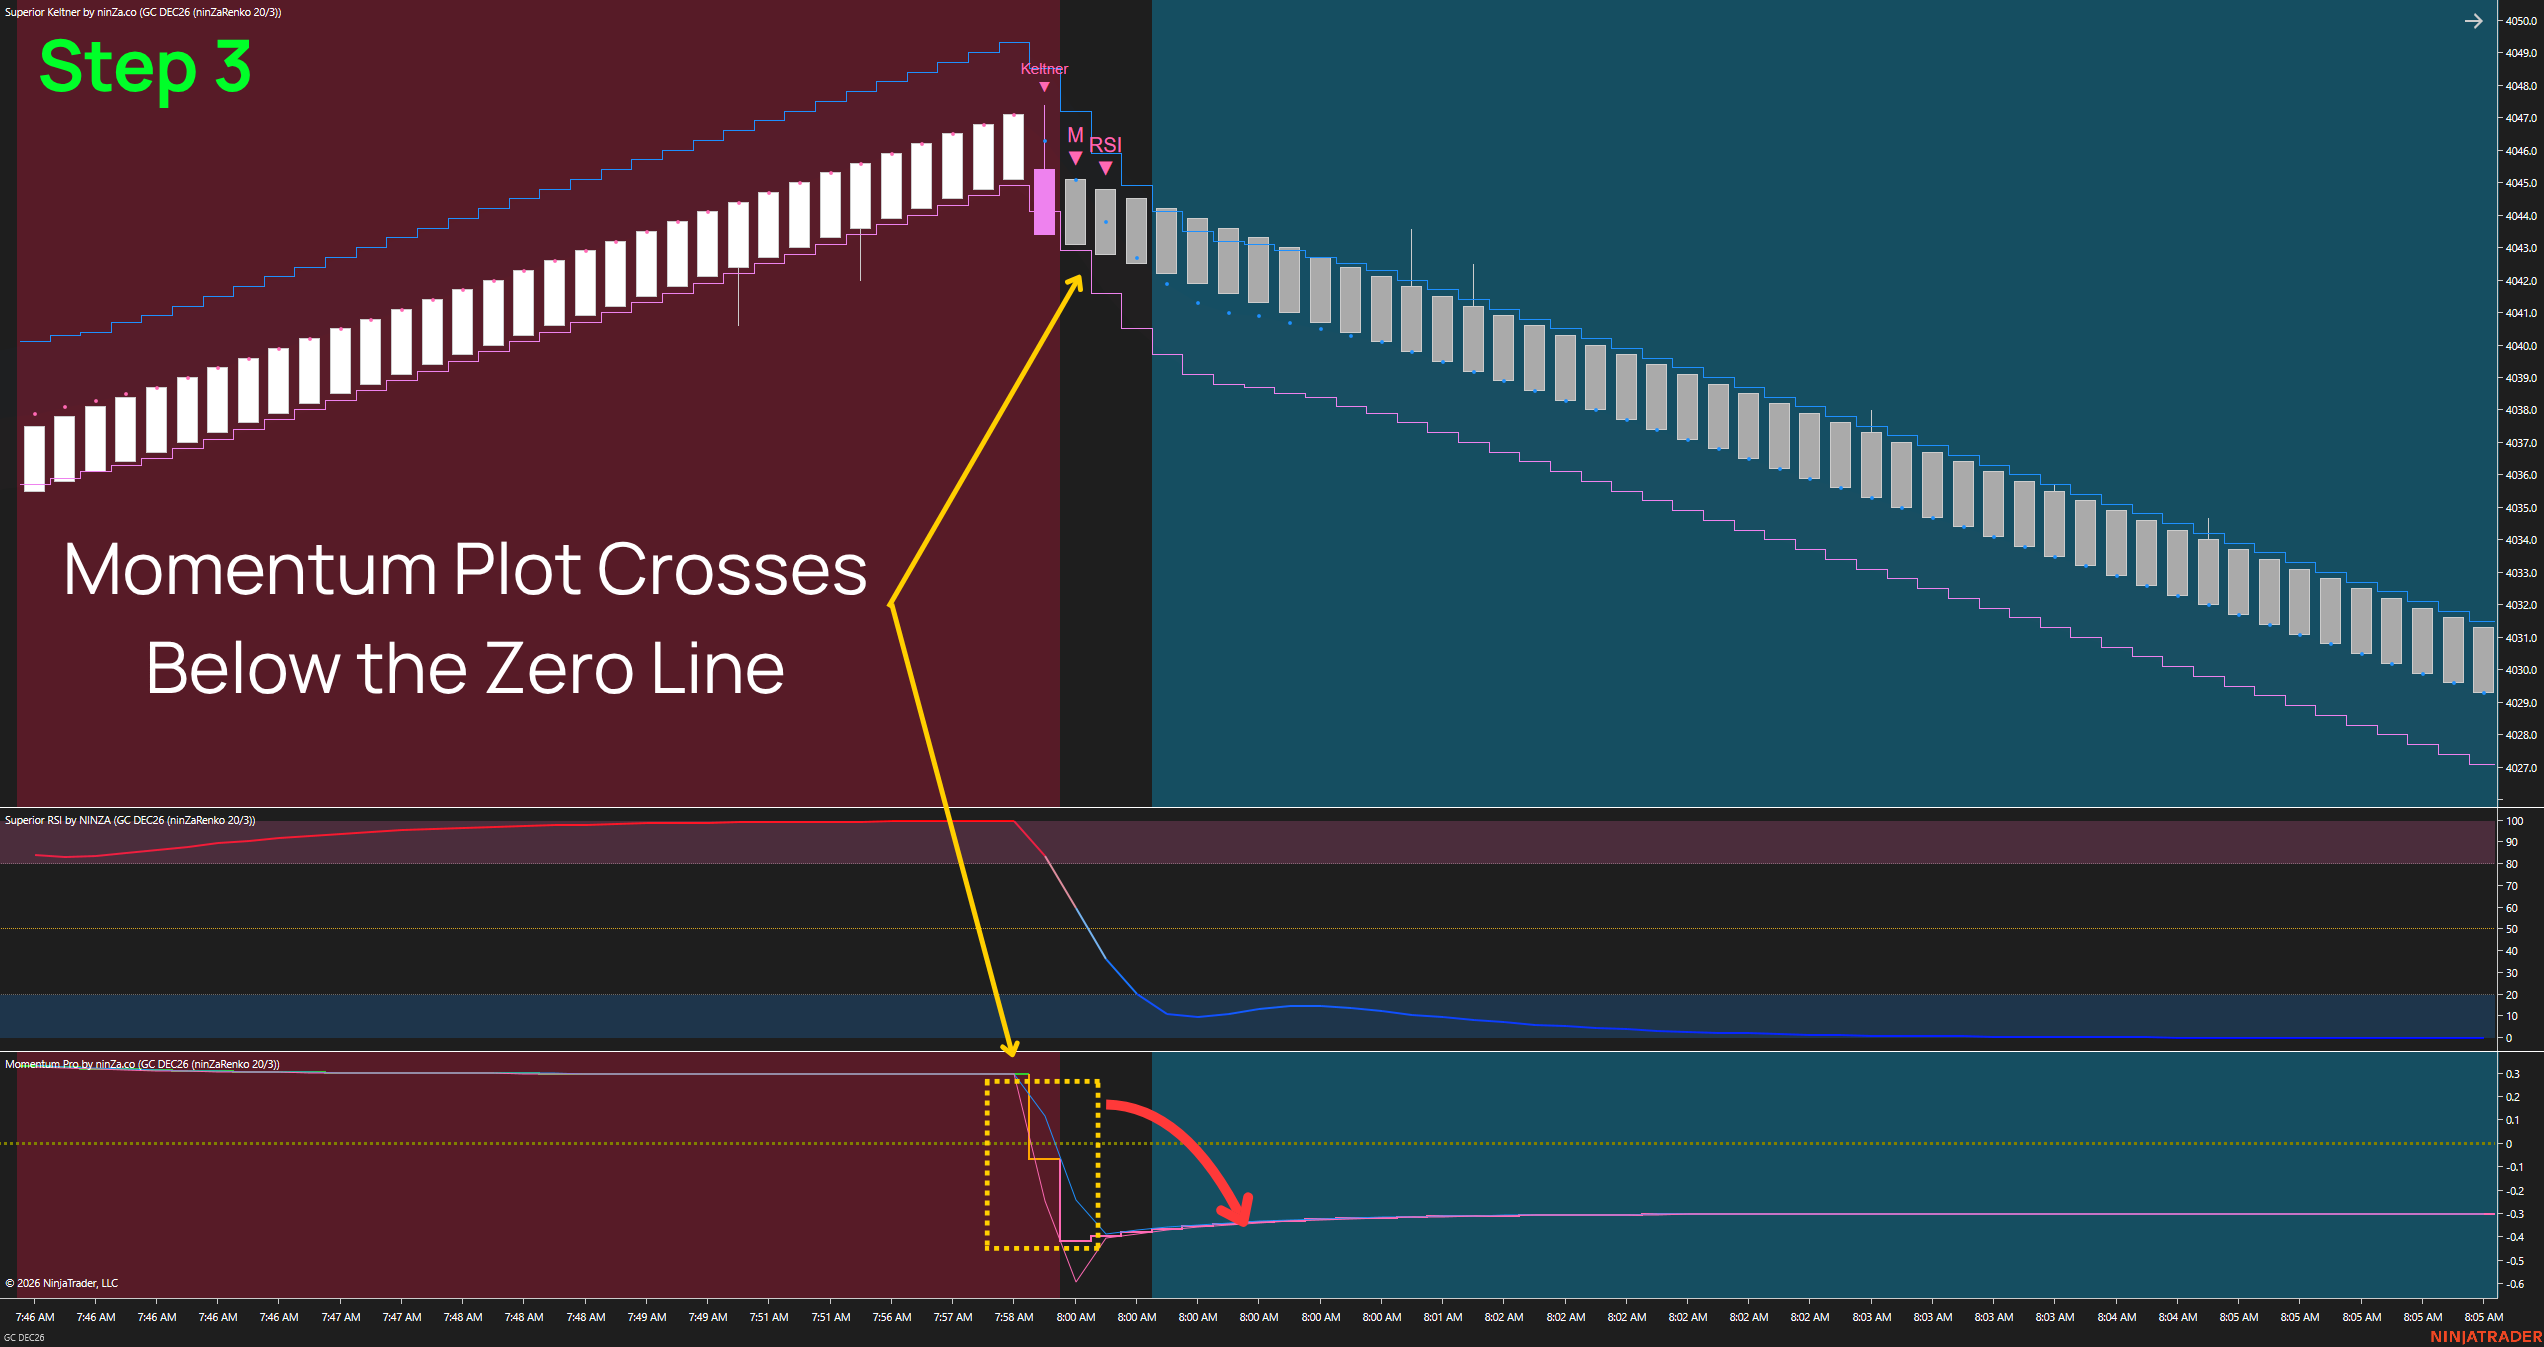
After the Keltner signal, the Momentum Plot must cross from above to below the Zero Line. This indicates that momentum is shifting in favor of sellers. Use only the Momentum Plot crossover for this step, not signals from the other Bound lines.
Step 4 – RSI crosses below 50 from Overbought
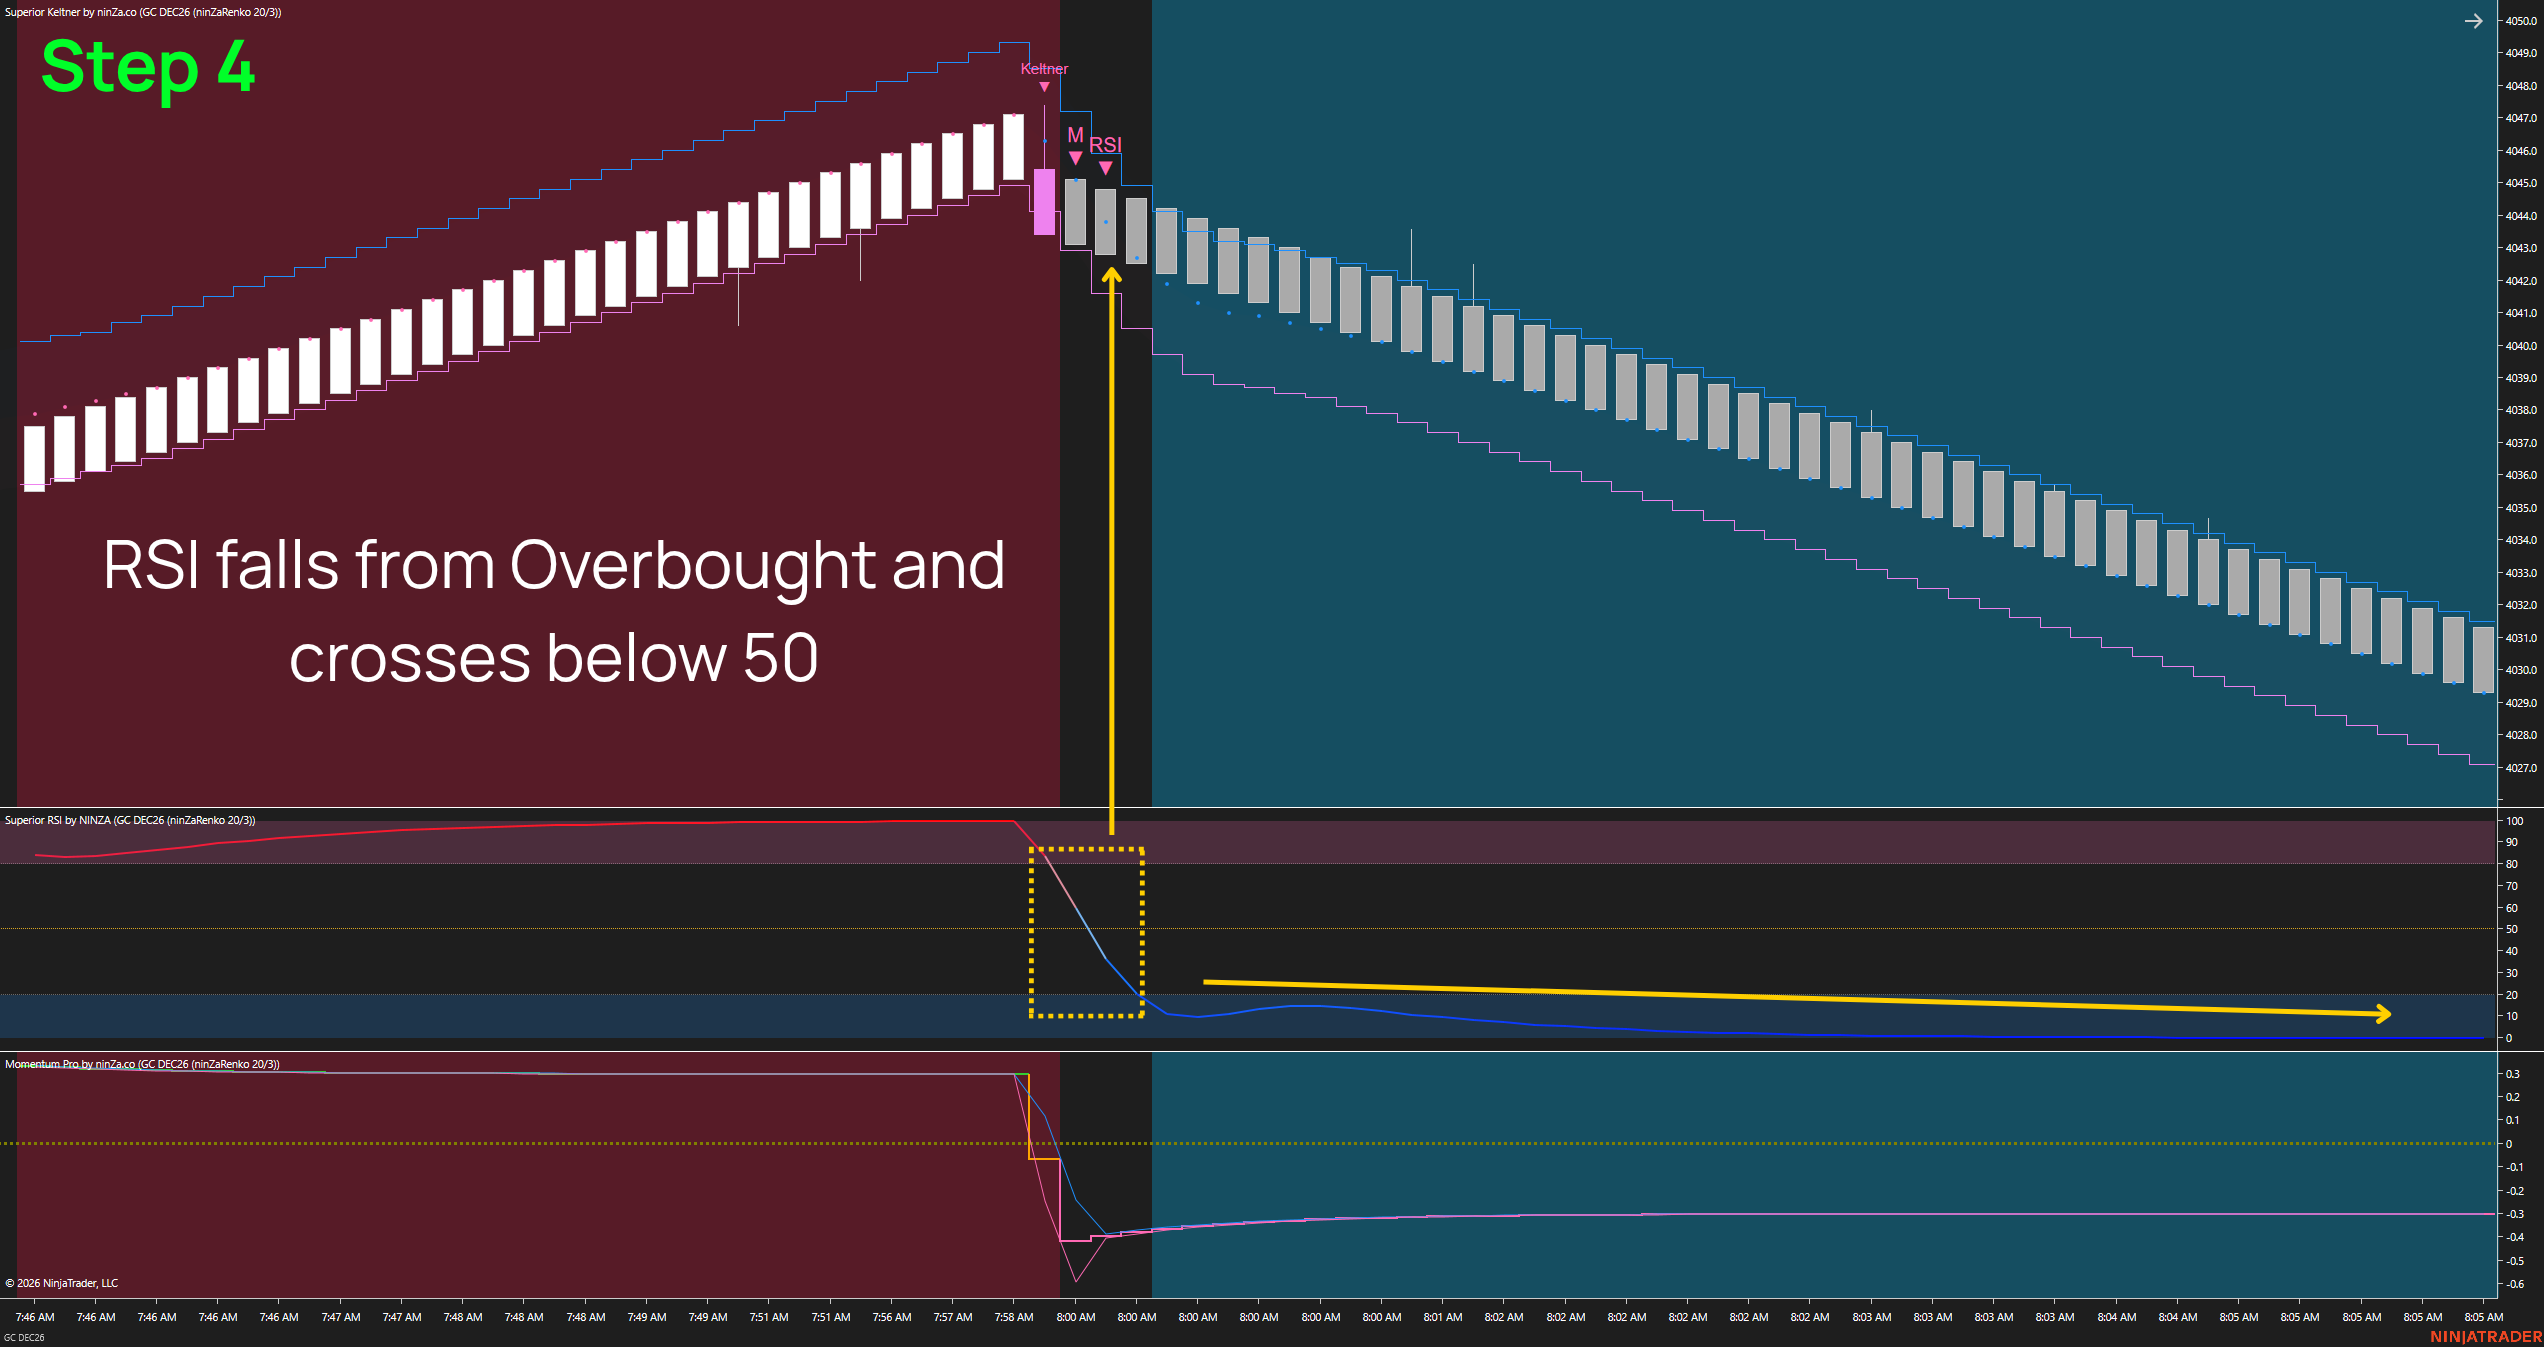
Finally, RSI moves down from OB territory and crosses below the Middle Line (50). Only then is the four-step Sell checklist complete. Traders can consider a Short entry if the Entry, Stop, and Target levels still offer a reasonable trade opportunity.
SELL CHECKLIST
- Step 1: Price rises, the Upper Band slopes upward, the Lower Band tracks the bullish bricks, and RSI enters OB.
- Step 2: While RSI remains in OB, a bearish Renko brick closes below the Lower Band.
- Step 3: The Momentum Plot crosses below the Zero Line after Step 2.
- Step 4: RSI crosses below 50 from OB after Step 3 → Consider a Sell Entry.
4.3. Follow the sequence, not just the signals
Imagine that RSI crosses above 50 first, but Momentum Pro does not cross the Zero Line until later. Even if both now support a Buy, that earlier RSI crossover does not qualify as the final confirmation because the checklist requires it to occur after Momentum. Similarly, if Momentum crosses zero before the Keltner signal appears, it cannot count as Step 3 for a Step 2 that occurs later.
This rule helps traders avoid piecing together signals that do not belong to the same reversal sequence.
The spacing between steps matters, too. If Keltner signals a reversal near the bottom but RSI does not cross above 50 until many bricks later, the Entry may no longer be attractive. Don’t just ask, “Are all four conditions met?” Also ask, “How far has price already moved?” How many bricks constitute a late Entry should be determined through testing, not an arbitrary threshold.
Continue reading →
Chapter 5: Reading real charts: Clean signals and when to skip