
Chapter 5: From entry to exit – Managing risk
An entry checklist is only the first part of a trade. This chapter focuses on how to define invalidation points, targets, and position management in a way that stays consistent with a validated setup. Suggestions on timing, filtering, and practice methods are covered separately in Chapter 6.
5.1. How to Set Stop / Target
Tip 1 – When the market is moving strongly
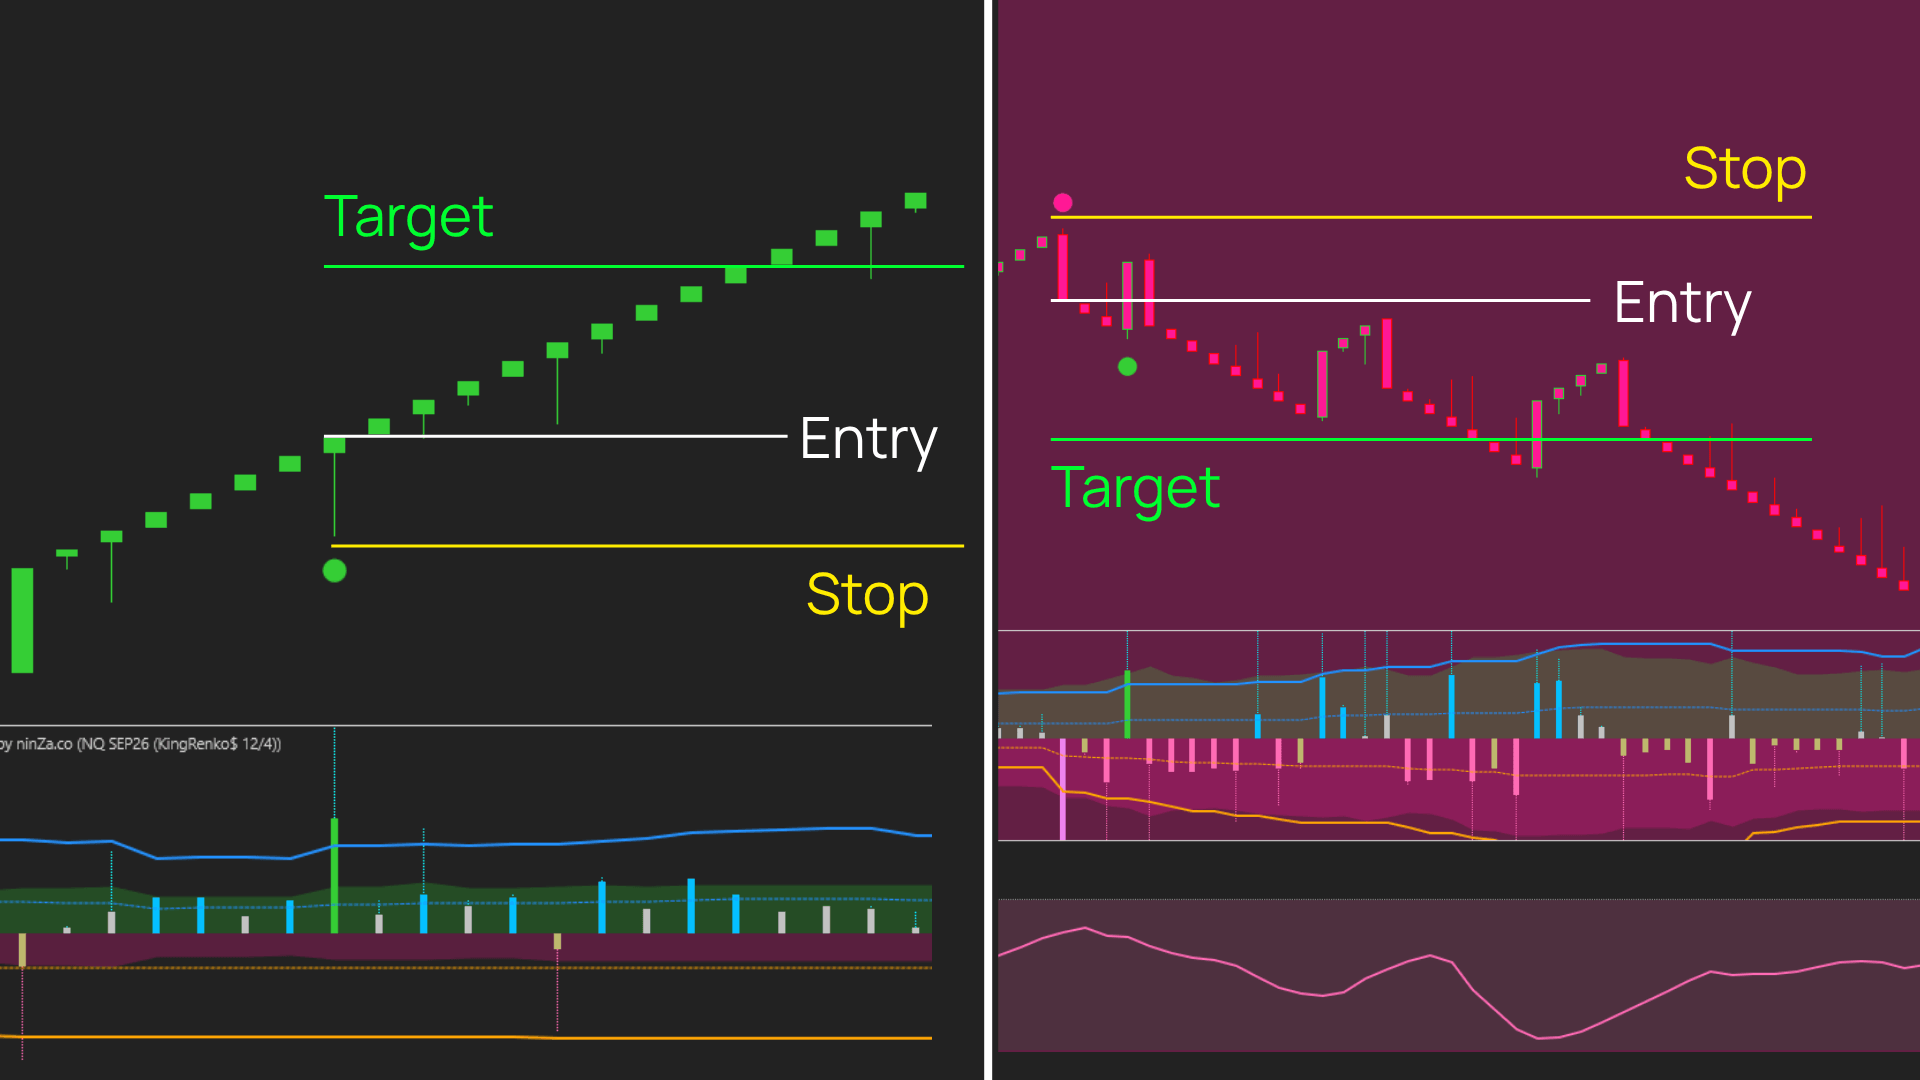
Place the SL just below (or above, for a sell order) the reversal candle or signal candle; place the TP at a 1:1 ratio.
The signal candle can be used as a structural reference point to define where the setup is no longer valid as it was at entry. If price breaks through this point in the opposite direction, the trader should follow the risk plan defined in advance, rather than adjusting the SL emotionally after the position is open.
The 1:1 ratio here is just an example for validation, not the optimal ratio for every market. For each instrument and chart setting, the trader should measure win rate, average win/loss, commission, and slippage to determine which target fits the setup’s expectancy.
Tip 2 – Based on the Renko ratio
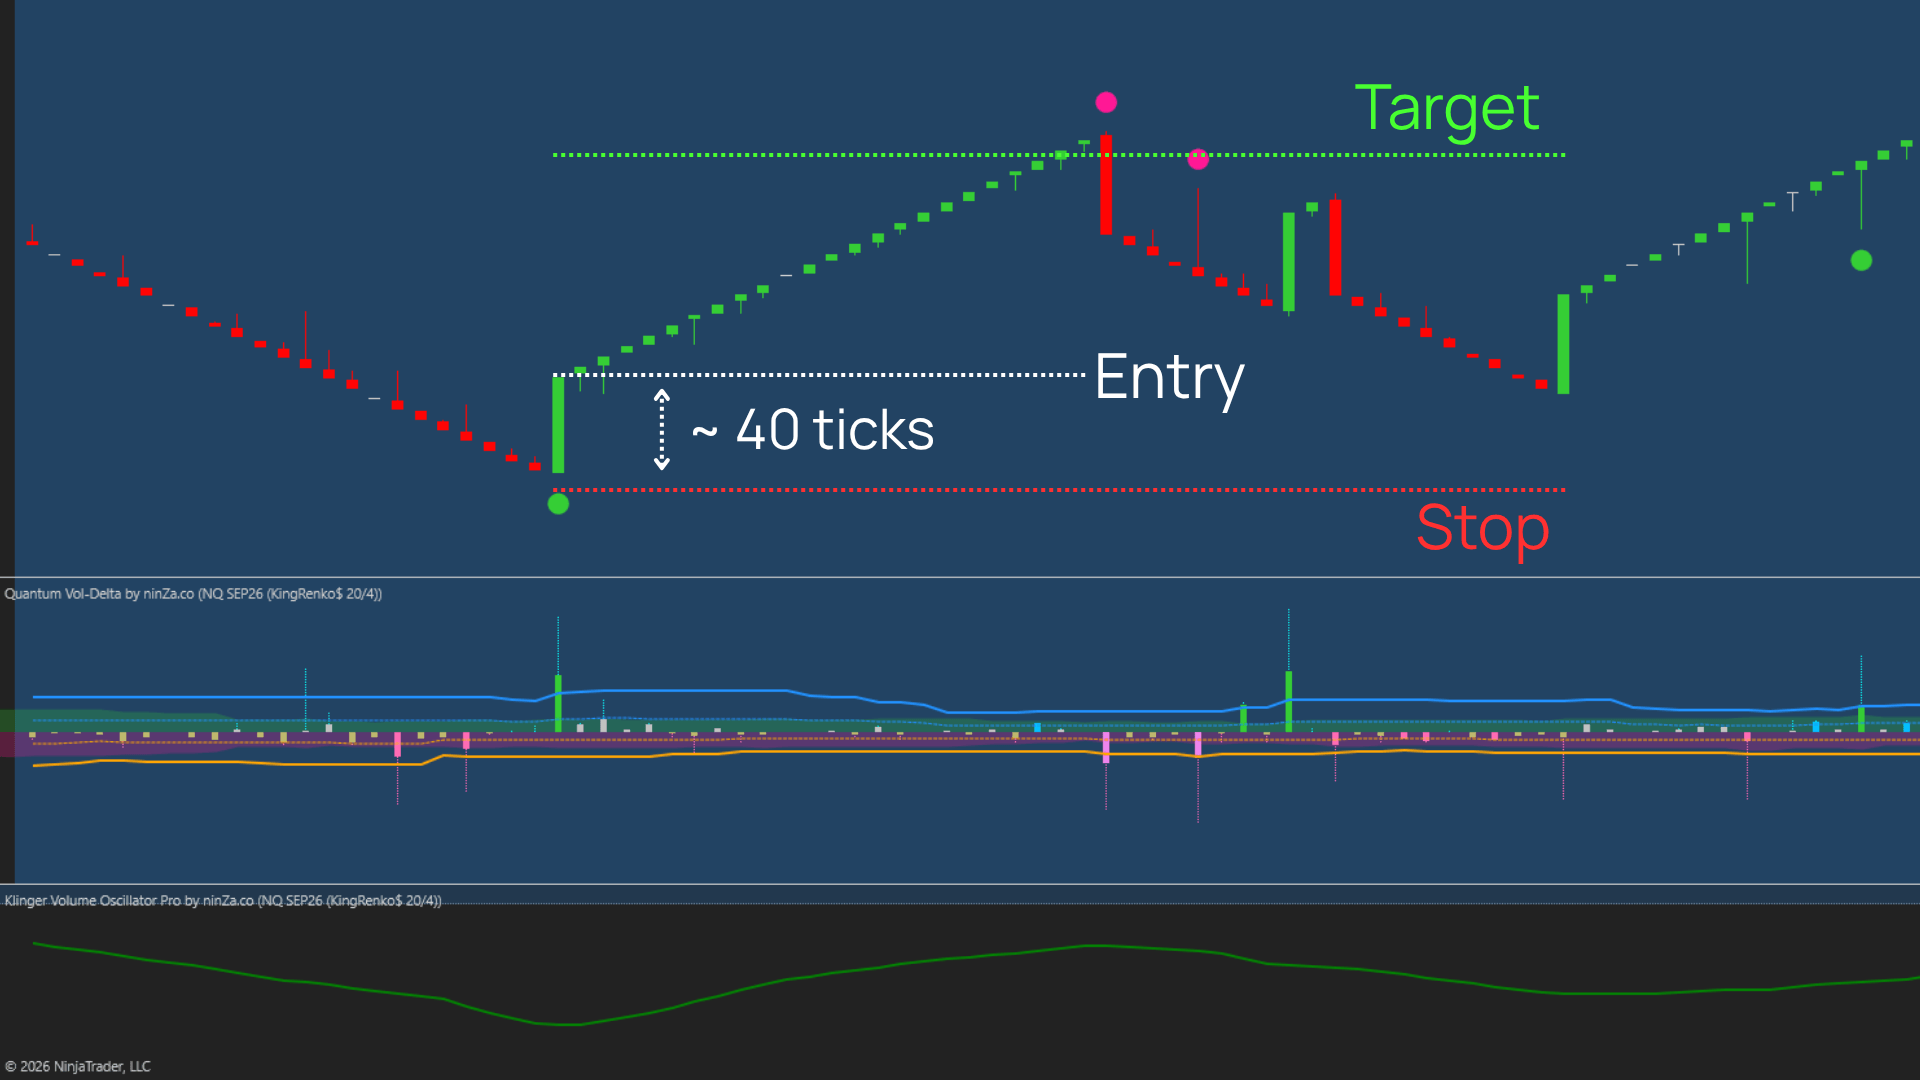
For example, with a Renko setting of Brick size = 20, Trend Threshold = 5: place the SL at approximately Brick size × 2 (≈ 40 ticks); place the TP roughly 45–50 ticks beyond the SL.
Using brick size as a reference unit ties the SL/TP to the structure of the Renko chart, rather than choosing an arbitrary number of ticks. However, a level of Brick size × 2 or a 45–50 tick target should only be treated as a starting point for backtesting. If the instrument or Renko settings change, these levels need to be re-evaluated.
Tip 3 – Trail the SL based on candles with strong Delta in the same direction
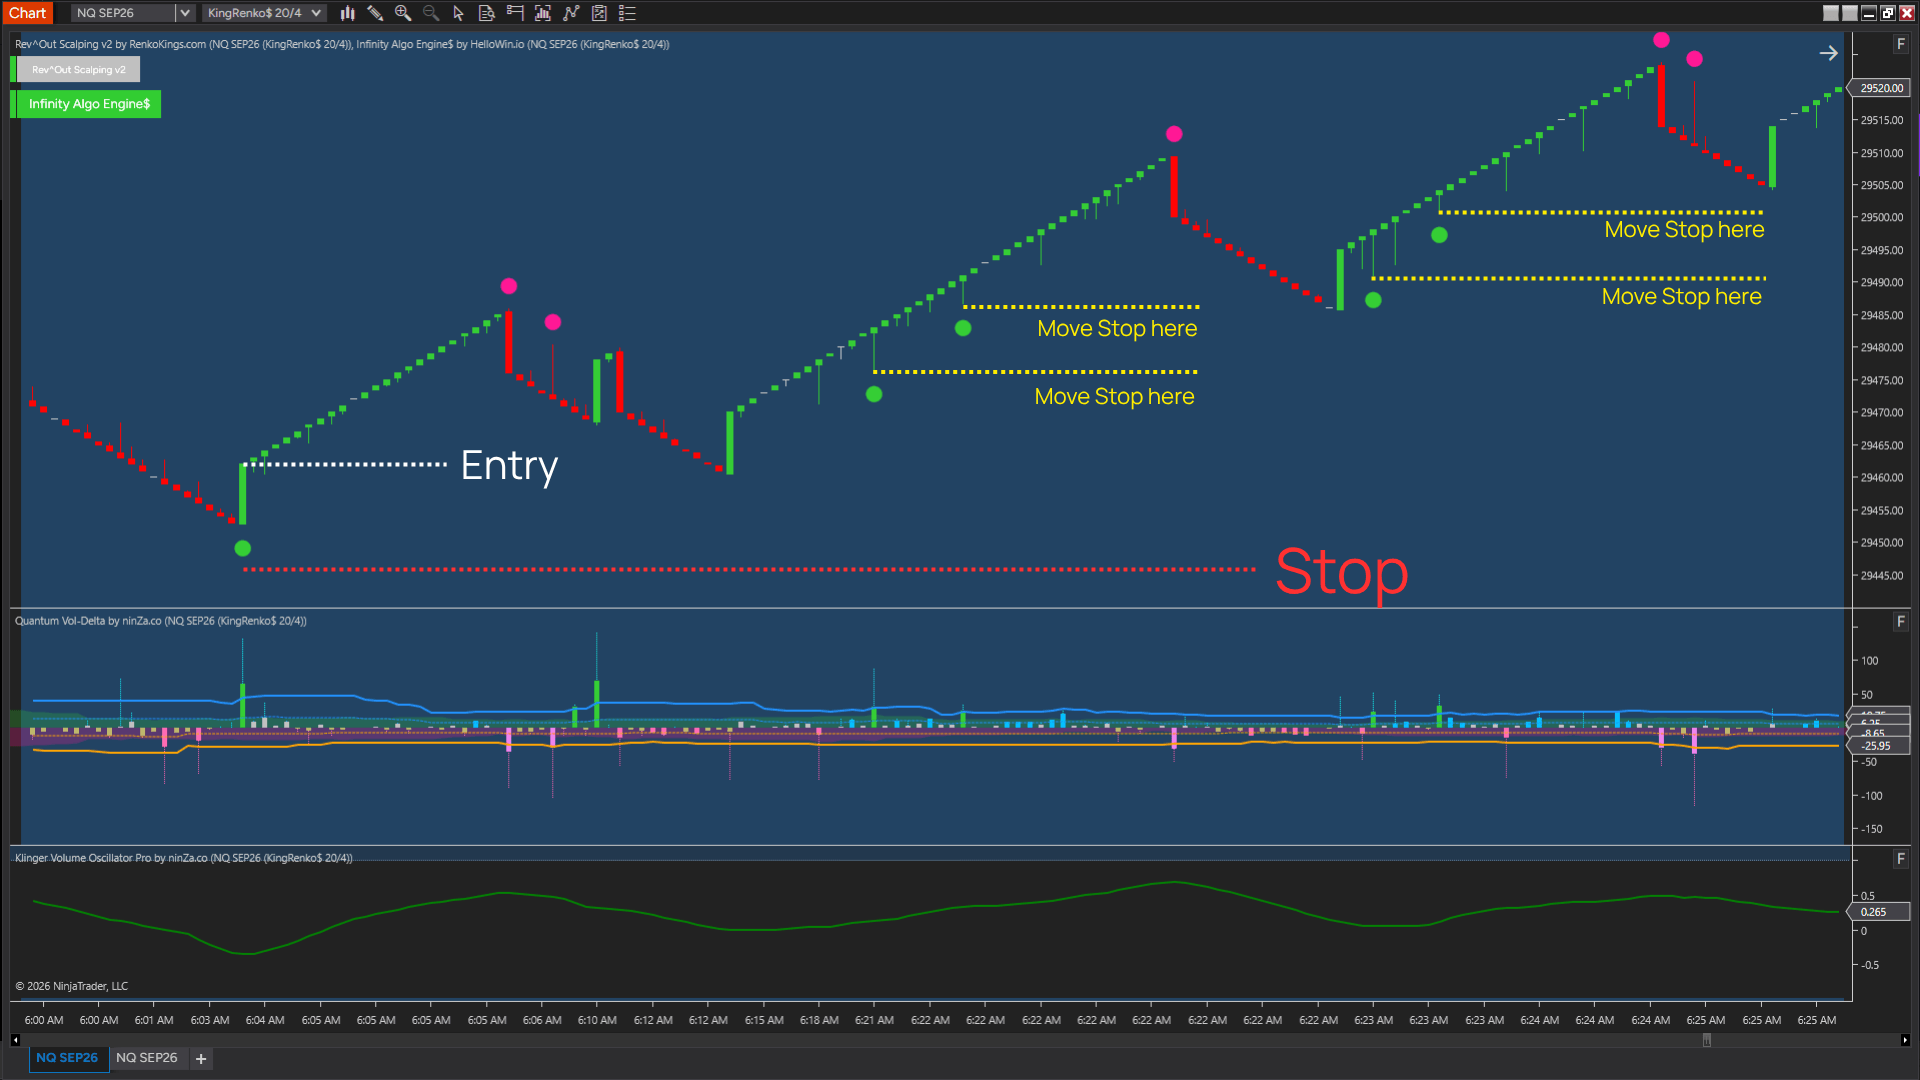
When additional candles with Delta in the same direction appear, the trader can treat them as new information for deciding whether to hold the position or adjust the SL. The specific method for trailing the stop should be defined in advance and validated as part of a trade-management rule, rather than changed on a case-by-case basis.
Tip 4 – Exit when Delta appears in the opposite direction
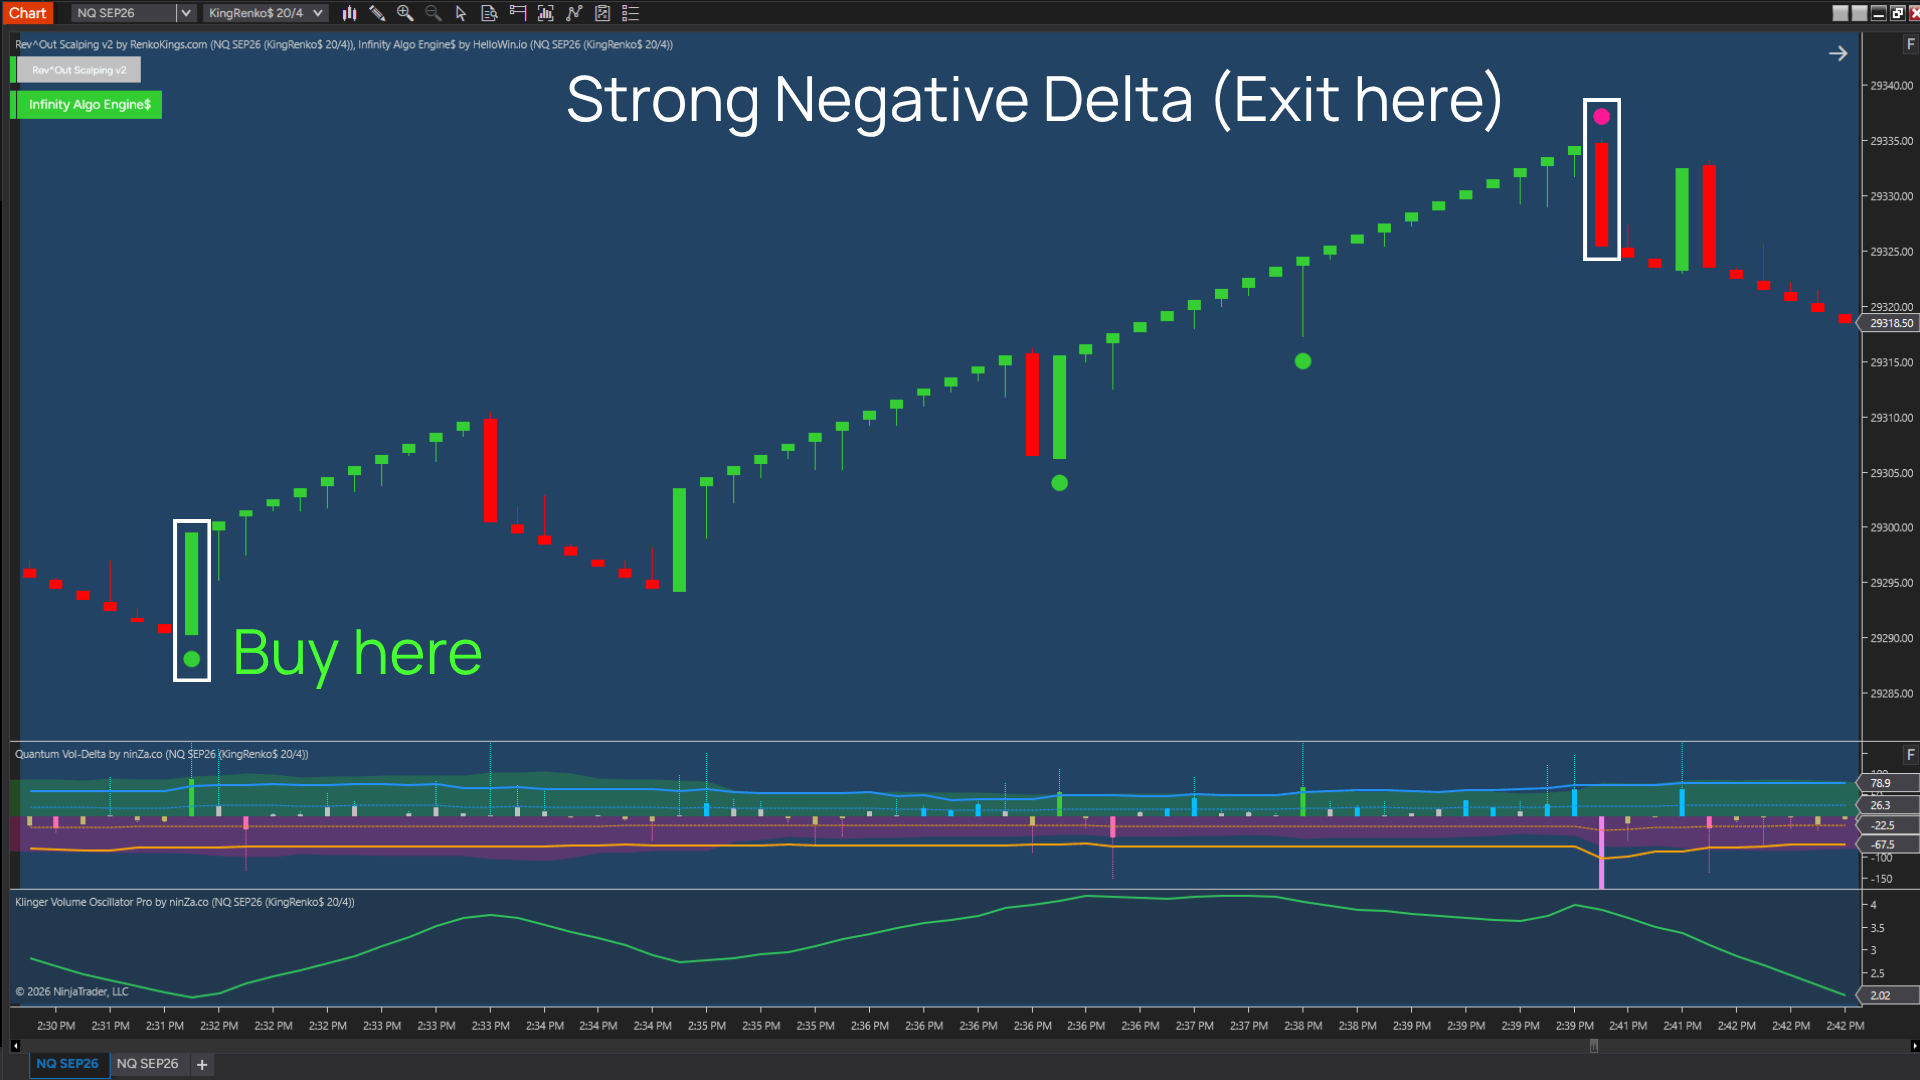
Opposing Delta can be a sign that active order flow is shifting, but it doesn’t always lead to a price reversal. The trader can use it as a condition to tighten the SL, exit part of the position, or exit the full position — as long as that rule has been defined and validated in advance.
5.2. Managing Position Size for Repeated Entries Within the Same Move
If the same market move generates multiple consecutive Buy or Sell signals, each signal shouldn’t automatically be treated as a fully independent opportunity.
In practice, order flow has persistence: an institution or a group of participants may split a large order into many smaller orders and execute them gradually over time. So a continuous stream of Buy flow doesn’t necessarily mean each new Buy represents a fresh source of participation entering the market — many signals may just be different parts of the same order-execution process. Research on order flow shows that sequences of Buy/Sell orders can exhibit meaningful positive autocorrelation, largely due to order-splitting mechanics.
This leads to an important risk management issue: consecutive entries within the same directional move are often highly correlated. If a trader takes three consecutive Buy entries at full size, nominally these are three separate trades, but in terms of risk exposure they may effectively be betting three times on the same market thesis.
Because of this, a decreasing position size mechanism can be used for re-entries within the same move. For example:
- First entry: 2–3 contracts, if this is the full size determined by the risk budget.
- Second entry in the same direction: reduced to 1–2 contracts.
- Third entry: only 1 contract, or skip it if a sufficiently new context hasn’t yet appeared.
The goal of reducing size isn’t because buyers or sellers are necessarily “running out of steam” — it’s because the marginal information of each new signal may decrease while correlated exposure increases.
The longer a Buy move has been running, the more the trader needs to distinguish between two cases: new Buy flow genuinely providing additional information, or simply a continuation of order flow that already existed. Research on meta-orders also shows that market impact builds up during the execution of a large order, and after execution ends, part of that impact can decay over time. This reinforces why a trader shouldn’t assume that every same-direction signal appearing later carries the same value as the first one.
REFERENCE – The cost of overtrading
A study on investor behavior across a large sample of brokerage accounts found that the group trading with the highest frequency had significantly lower after-cost returns than the group trading less often. In scalping, where transaction costs and spread make up a larger share of each small profit target, increasing the number of trades simply because it “feels like the market is running” — rather than because the checklist genuinely confirms it — tends to erode overall results, consistent with the mechanism documented in this research.
Source: Barber, B. M. & Odean, T. (2000), “Trading Is Hazardous to Your Wealth,” Journal of Finance, 55(2), 773–806.
REFERENCE — Risk management and position sizing
CME Group emphasizes that traders should set a Stop at a logical level that indicates the trade thesis has been invalidated, then use the Stop distance together with acceptable risk capital to calculate position size. The CFTC also notes that leverage in futures can amplify both gains and losses. The principles in this chapter therefore prioritize limiting exposure before optimizing entry.
Source: CME Group, Trade and Risk Management / Proper Position Size; U.S. Commodity Futures Trading Commission (CFTC), Futures Market Basics and customer advisories on leverage.
Continue reading → Chapter 6: Tips for more effective trading