
Chapter 6: Tips for more effective trading
1. What to watch for better trade selection
Tip 1. Avoid entries when too much opposing Delta appears around the signal bar
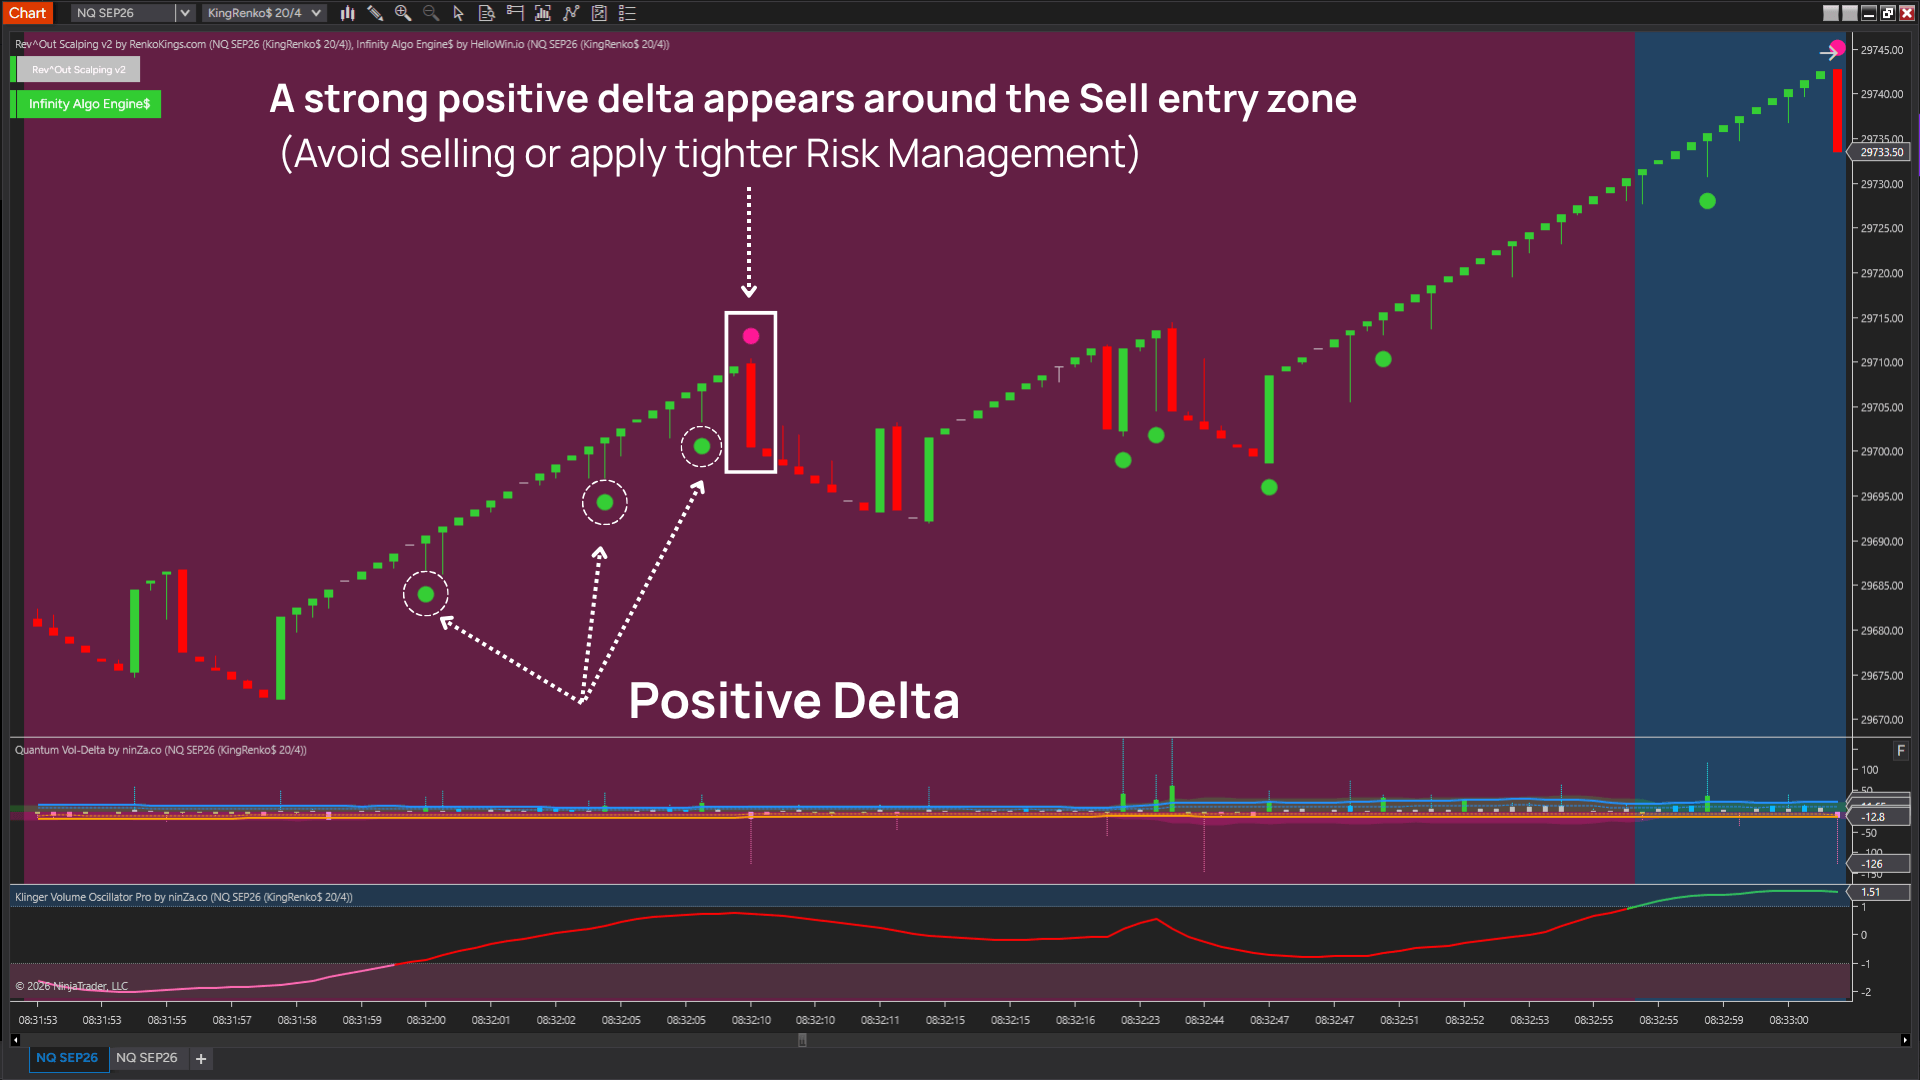
If the bars surrounding the signal bar repeatedly show Delta flipping direction or strong Delta against the intended trade, it suggests that aggressive order flow has not established a clear and sustained advantage on either side.
Delta shows which side is more aggressive in executing market orders at a given moment. However, when Buy and Sell Delta alternate repeatedly, it indicates that aggressive pressure is shifting back and forth. In this environment, the signal bar may look valid from a price-action perspective, but it is still forming in an area where buyers and sellers are actively competing for control.
From a market microstructure perspective, order flow is directly involved in the price-formation process. However, its impact also depends on available liquidity and how the opposing side absorbs or responds to that aggression. For this reason, a single Delta bar should not be interpreted in isolation from the surrounding order-flow sequence.
How to apply it: Prioritize setups where the Delta around the signal bar is relatively consistent with the intended trade direction. If Delta keeps flipping aggressively, consider classifying the setup as Mixed Order Flow and backtesting it separately rather than assuming it has the same quality as a setup with confirming Delta.
Tip 2. Be cautious when Klinger Volume Oscillator Pro stays in the Upper or Lower zone for too long
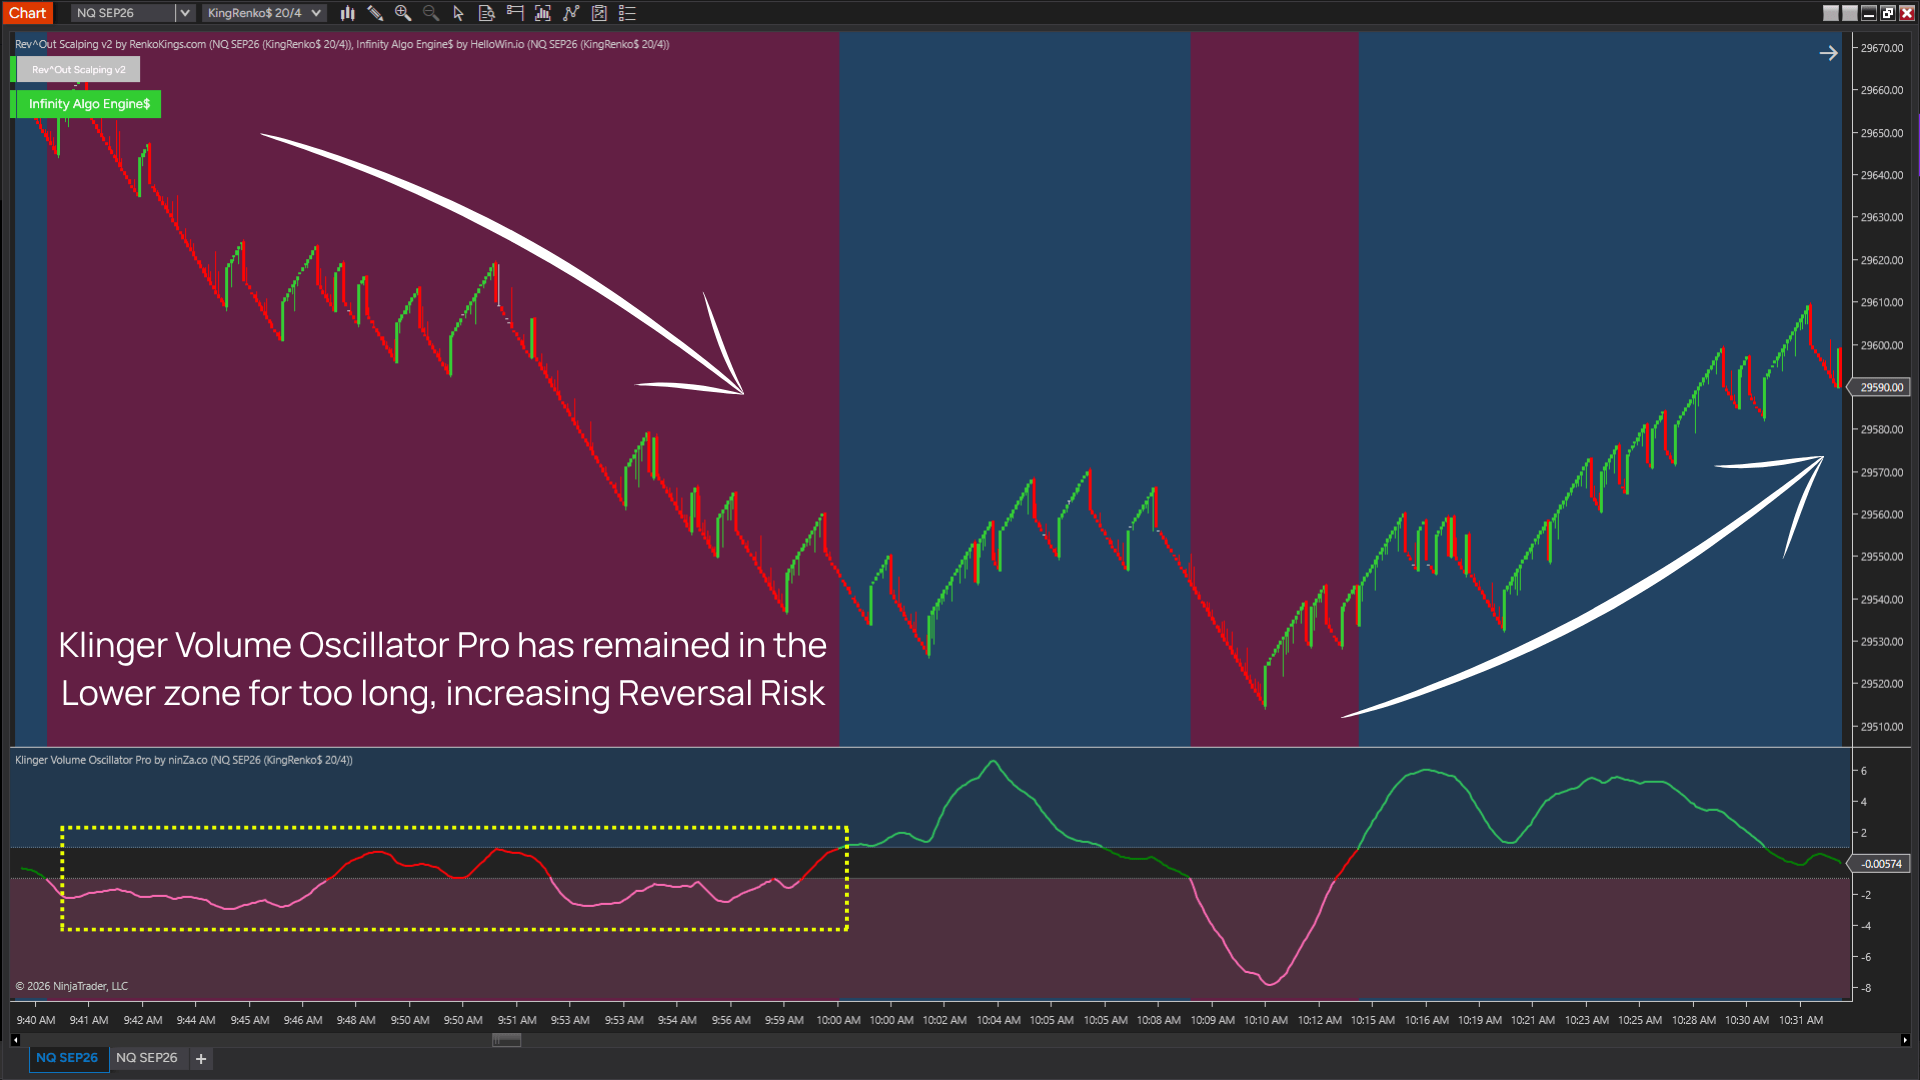
When Klinger Volume Oscillator Pro has remained in the Upper or Lower zone for an extended period, a new signal appearing at that stage should not be evaluated the same way as a signal that appears earlier in the move.
The reason is not that “overbought must fall” or “oversold must rise.” Strong volume conditions can persist much longer than expected. The key issue is entry timing: the later you enter a directional move, the greater the risk that a meaningful portion of the price displacement has already occurred.
Order flow can be highly persistent. Sustained sequences of buying or selling may continue as large orders are split into smaller executions and worked through the market over time. Therefore, Klinger Volume Oscillator Pro remaining elevated or depressed for an extended period is not evidence that order flow is about to reverse. At the same time, it should not be assumed that every new signal appearing later in the move carries the same informational value as an earlier signal.
How to apply it: During backtesting, separate signals into 2 groups: Early-State Entry and Late-State Entry. Compare their expectancy, MAE, MFE, and drawdown to determine whether entering later in the move actually reduces setup performance.
Tip 3. Combine Crossover and Threshold Modes to separate “state change” from “strength”
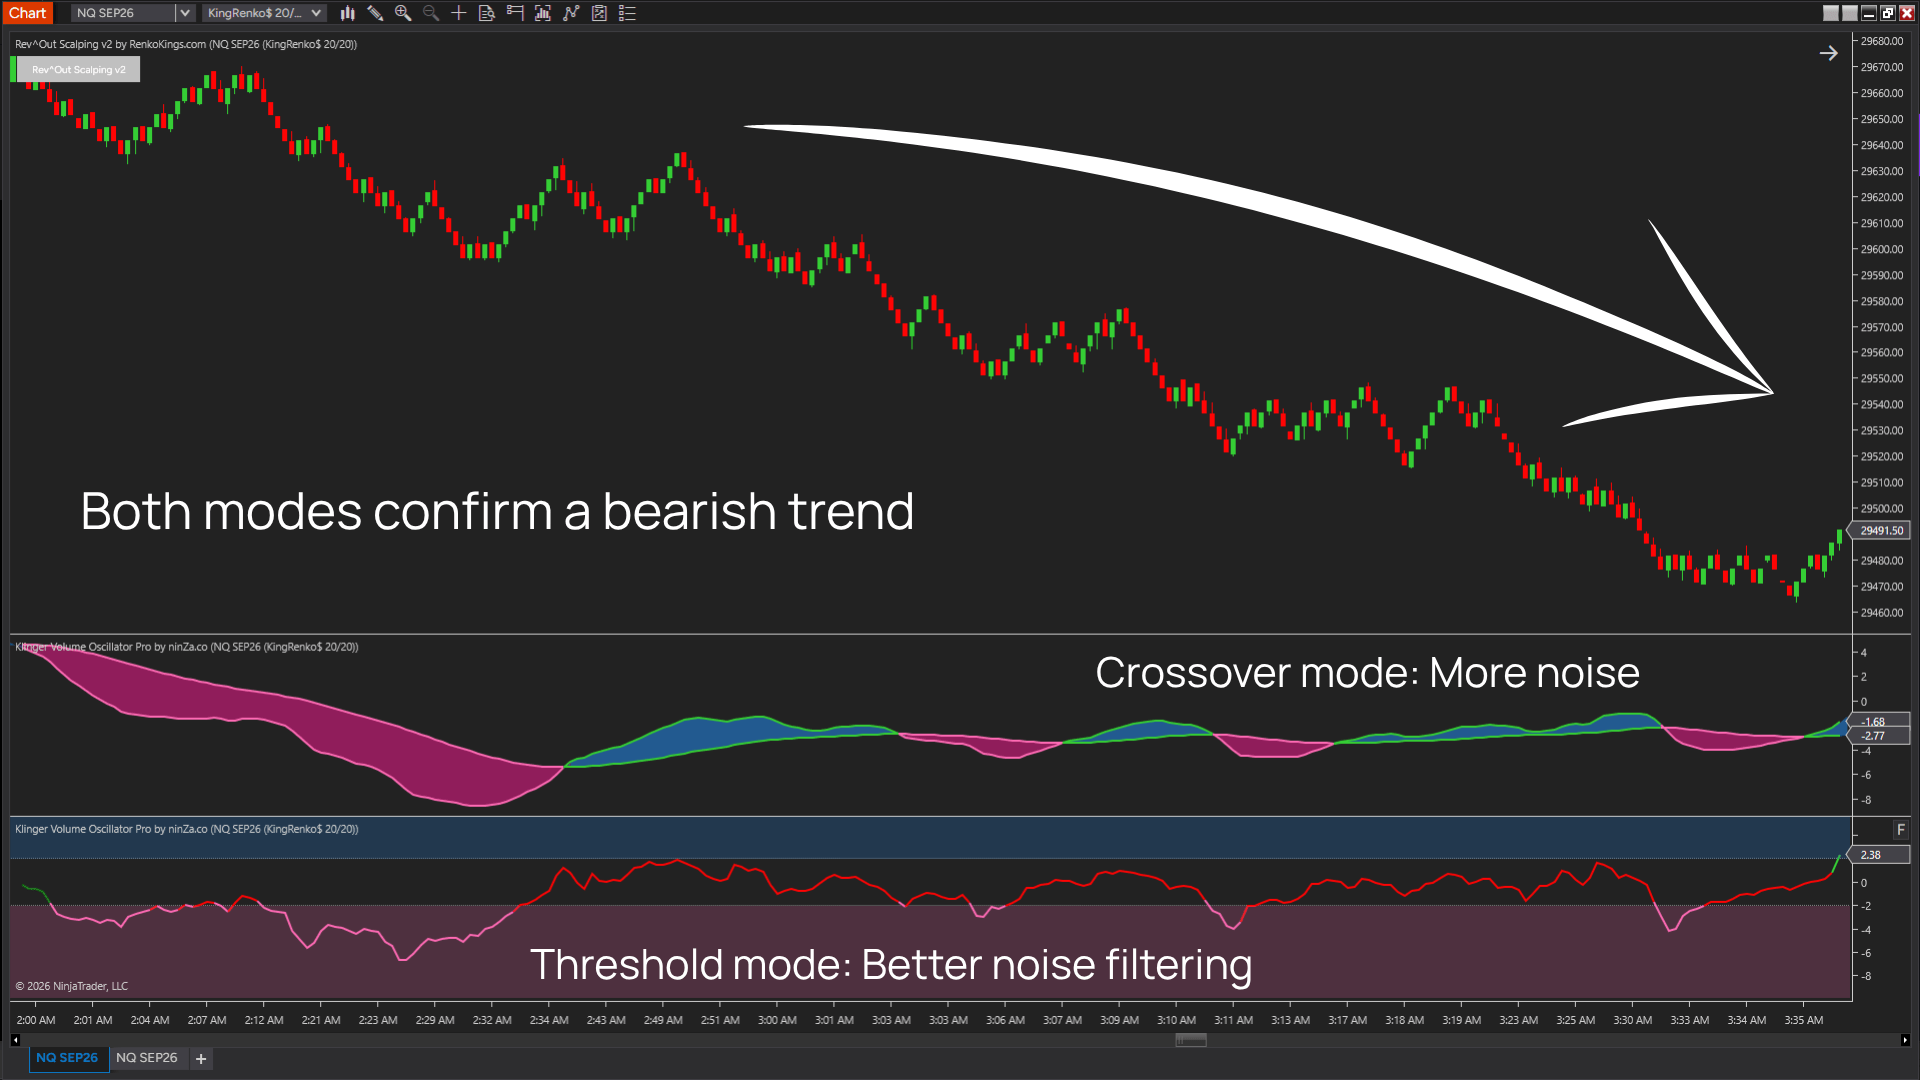
The 2 Klinger Volume Oscillator Pro modes are best viewed as complementary perspectives, rather than 2 independent Buy/Sell signals.
Crossover Mode is better suited for identifying a state transition – when the relationship between the Klinger Volume Oscillator Pro lines shifts in a bullish or bearish direction.
Oscillator/Threshold Mode is better suited for assessing how strongly the Volume Force develops after that transition occurs.
The key point is that a crossover only tells you that the relationship between the 2 lines has changed. It does not tell you whether that change has enough magnitude or persistence to develop into a meaningful directional move.
Conversely, when the oscillator reaches a strong zone, it reflects the magnitude of the current state, but does not necessarily identify where the transition began.
A more structured way to use the 2 modes is therefore:
- Crossover = identify the transition
- Oscillator = evaluate the strength and persistence of that transition
Rather than relying on a visual judgment that “both modes confirm the trade,” define a specific rule. For example, require the crossover to occur first, then require the oscillator to reach a predefined threshold within the next N bars.
You can then check whether adding the second condition actually improves expectancy – or simply reduces the number of trades without providing a meaningful performance advantage.
Tip 4. Don’t chase price when the entry is too far from the signal bar
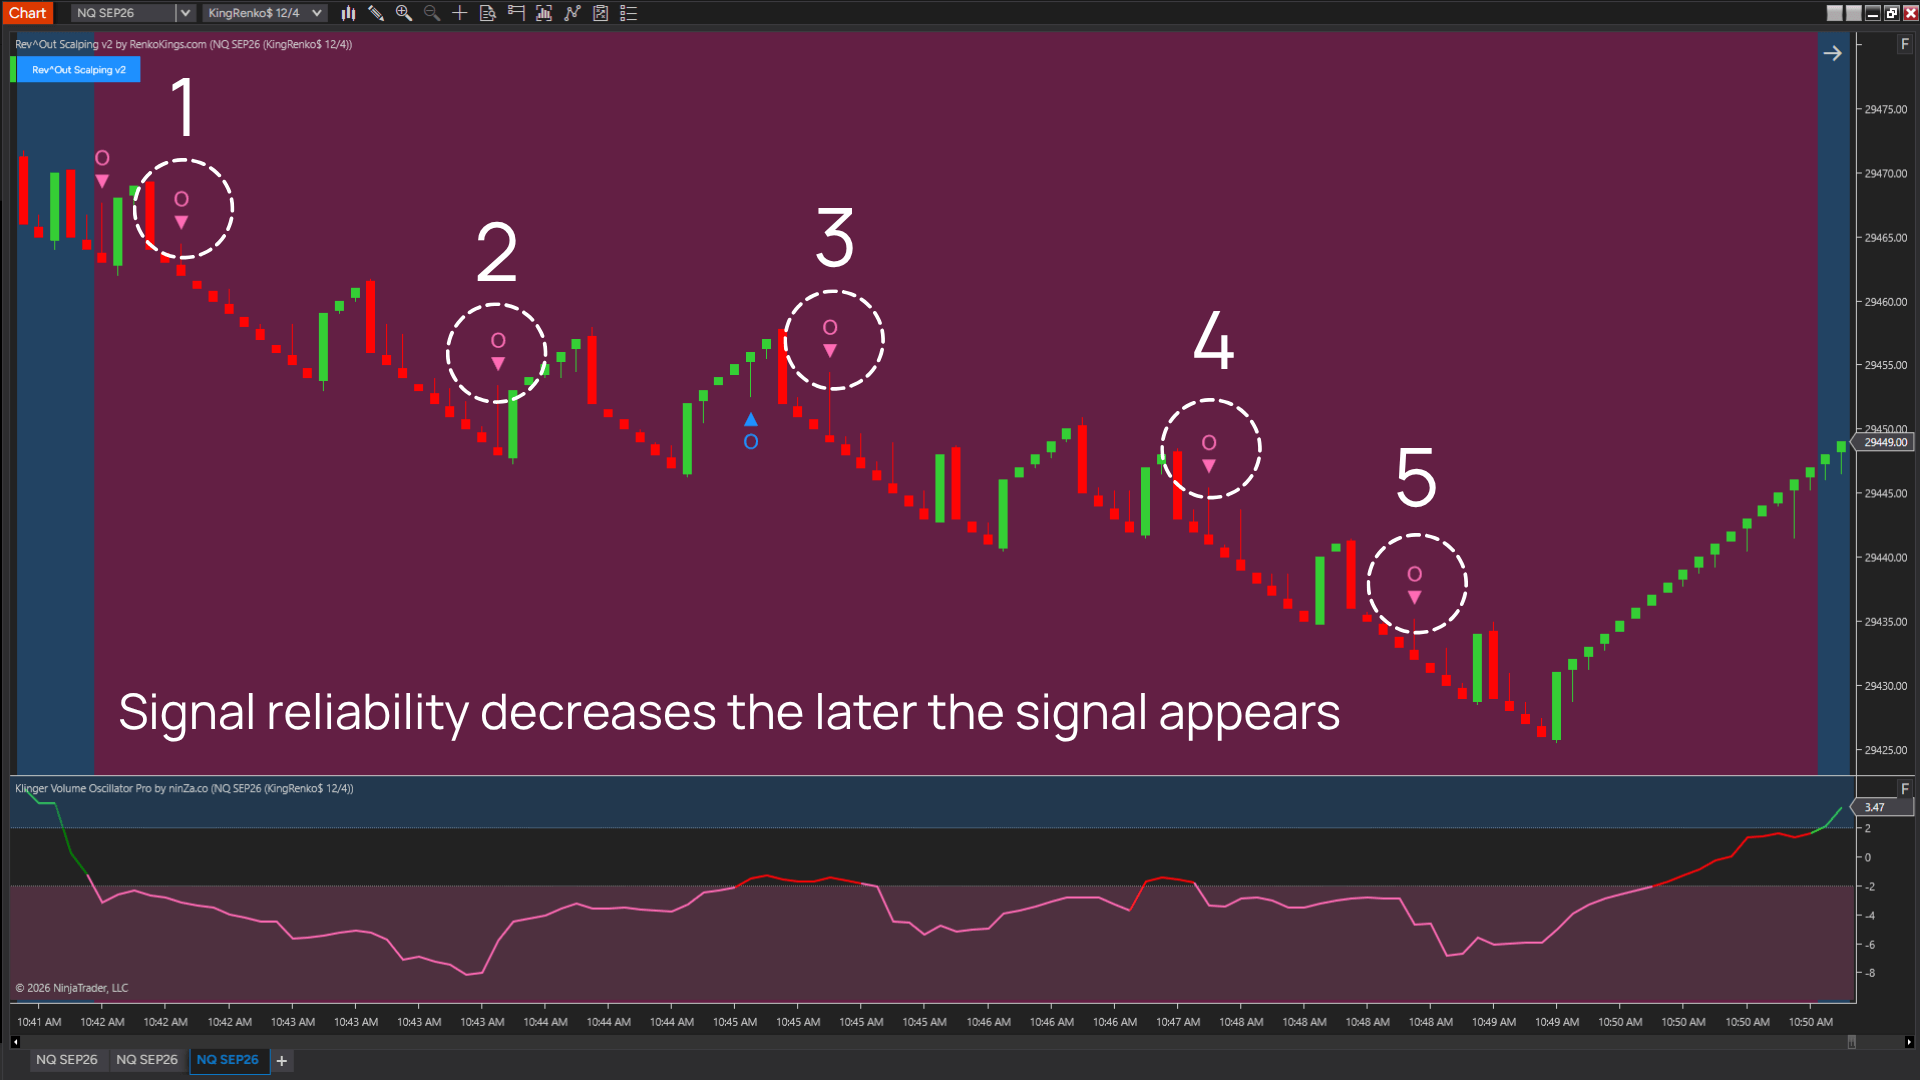
A setup is defined not only by direction, but also by the entry location relative to the invalidation point.
Suppose a signal bar creates a Long setup and the logical Stop is below that signal bar. If you enter close to the signal bar, the Entry-to-Stop distance may equal 1R. But if price has already moved significantly before you enter, the Stop still needs to remain around the original structure while the Entry-to-Stop distance becomes larger.
At that point, even if your directional bias has not changed, the trade geometry has:
- Risk distance becomes larger.
- Remaining reward to the target becomes smaller.
- The amount of MAE the trade can absorb before reaching the Stop becomes smaller on a relative basis.
- The expectancy of a late entry may be very different from that of the original entry.
For this reason, “don’t chase price” should not be treated as just a psychological trading rule.
A more systematic approach: define a Max Entry Distance from the signal bar, measured in R or brick size.
For example:
Do not enter if price has already moved more than 0.25R–0.30R away from the original planned entry.
This number is only a hypothesis to test. Backtest entry-distance buckets such as 0–0.1R, 0.1–0.2R, 0.2–0.3R, and so on, to identify the point at which expectancy begins to deteriorate.
Tip 5. Prioritize setups when 2 same-direction Reversal Bars are both confirmed by Delta
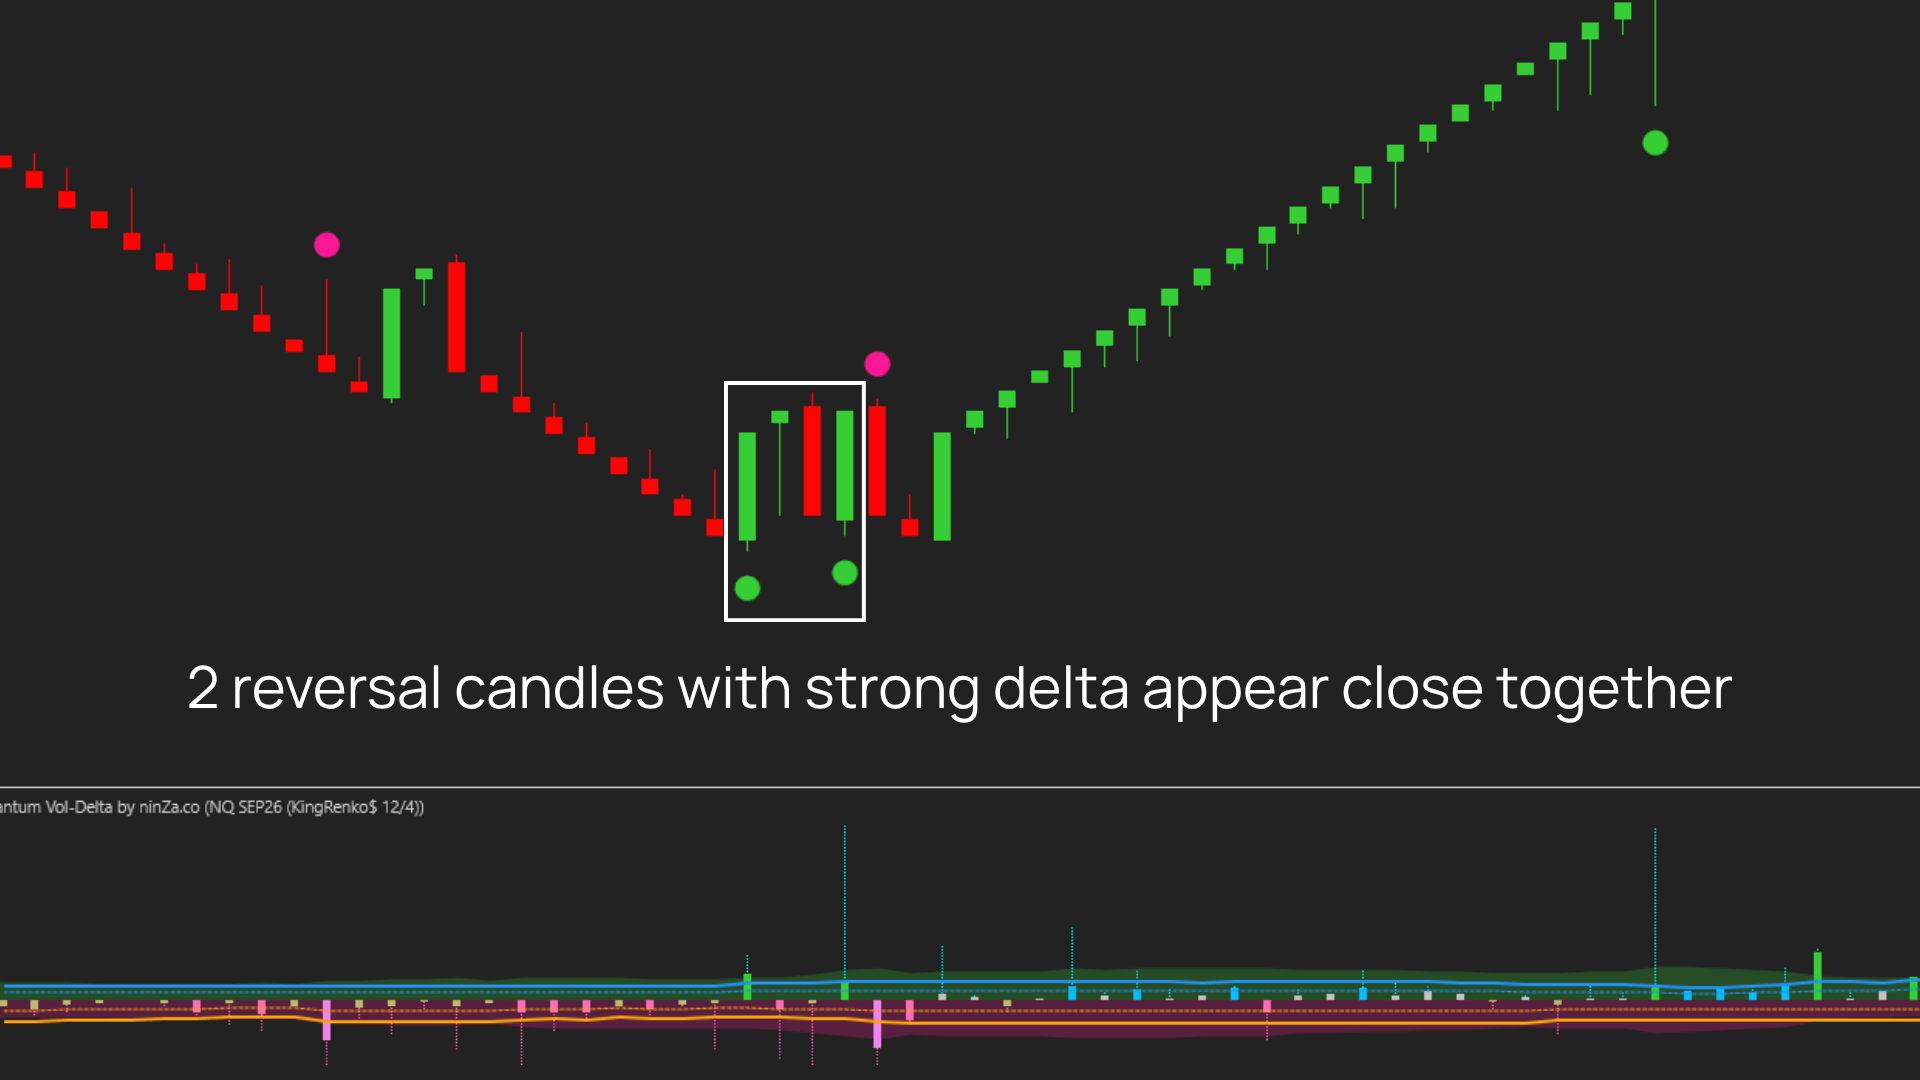
When 2 Reversal Bars appear consecutively or close together in the same direction, and both are confirmed by Quantum Vol-Delta, the setup may carry greater conviction than a single Reversal Bar on its own.
The reason is that the market has effectively confirmed the same directional thesis twice.
The first Reversal Bar suggests that price has rejected the prior move and that control may be shifting to the opposing side. If a second Reversal Bar then forms in the same direction, the market is not only holding the outcome of the first reversal, but also producing another rejection structure that supports the same directional view.
When both bars are backed by confirming Delta, the trader is seeing the same 2 components repeat:
- Price action continues to confirm the same direction.
- Aggressive order flow continues to support that direction.
This matters more than simply seeing 2 similar-looking bars.
If the second Reversal Bar appears but Delta no longer confirms it, the quality of the setup may be weaker. By contrast, when Reversal 1 + Delta is followed by Reversal 2 + Delta in the same direction, the directional pressure is no longer a one-bar event — it has persisted across multiple bars.
Tip 6. Watch for Divergence on Volume Oscillator Pro to Find Better Reward-to-Risk Opportunities
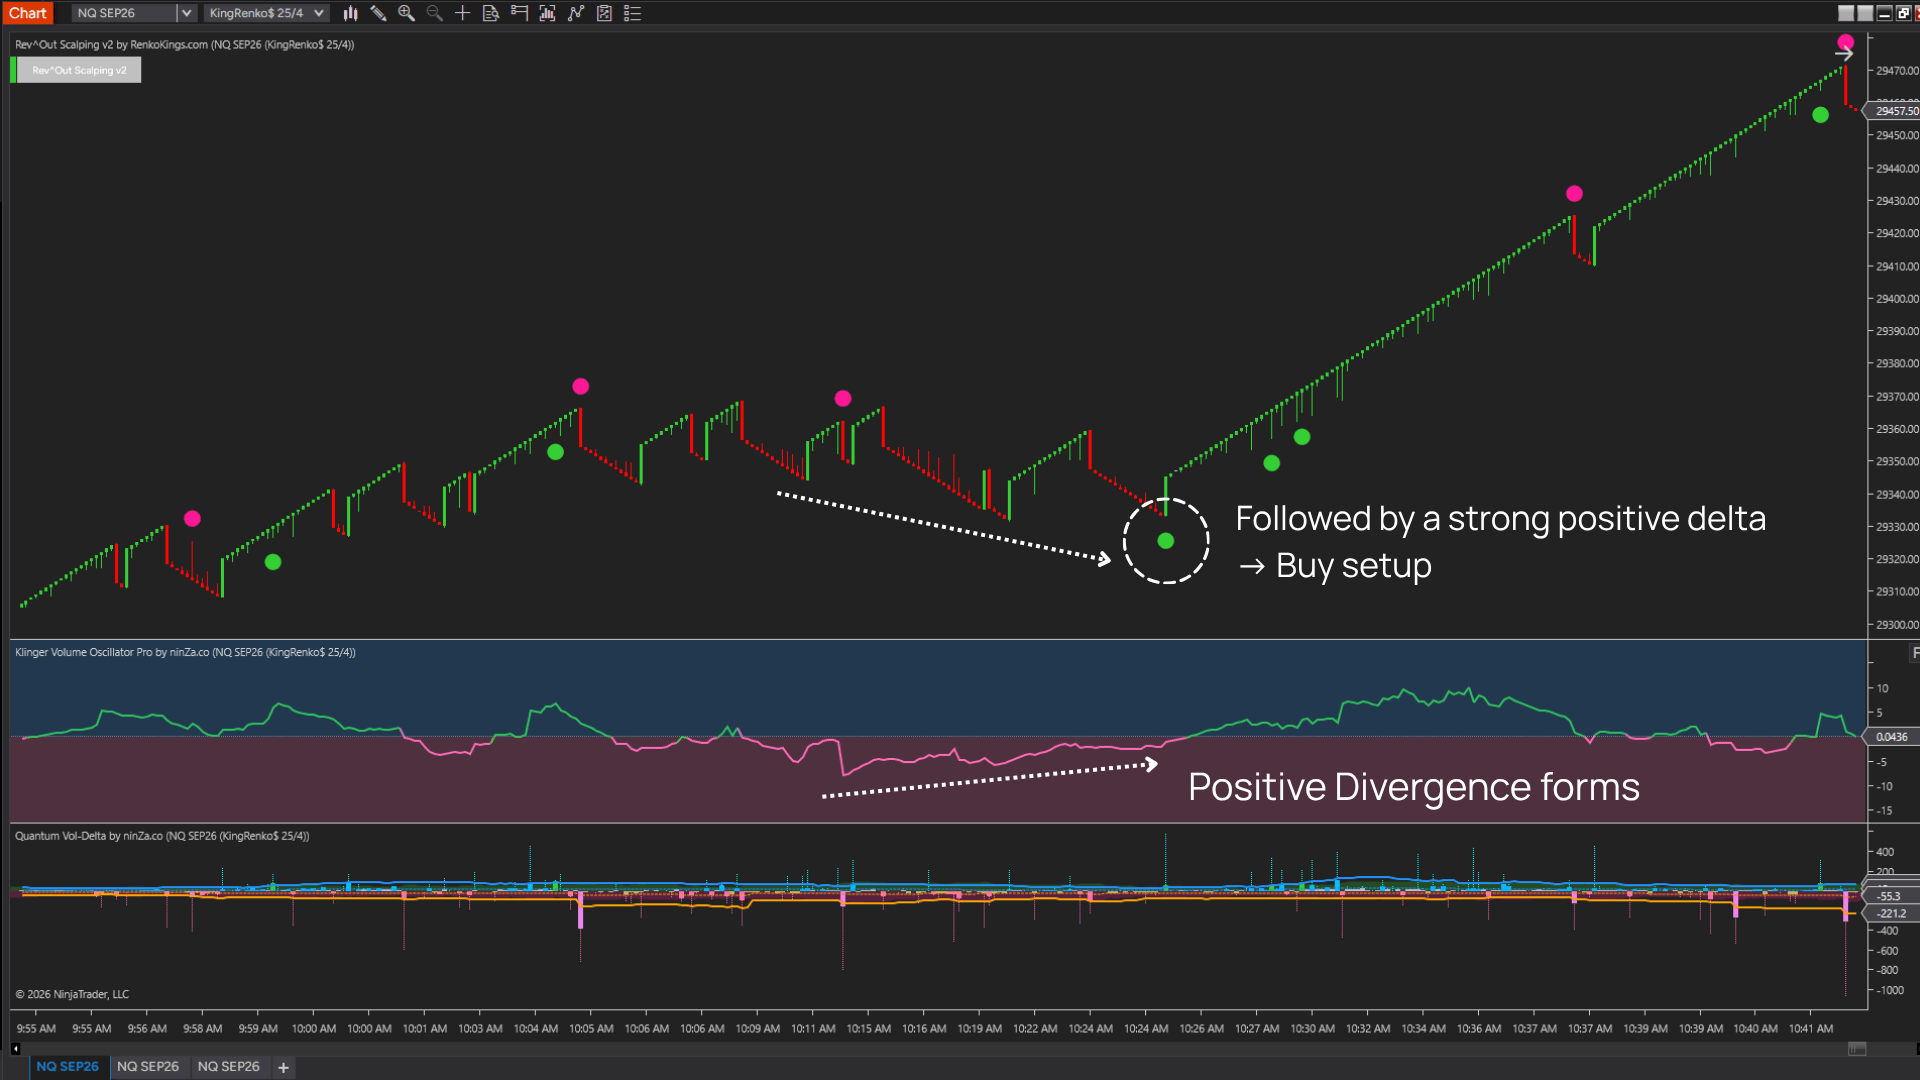
Divergence occurs when price and Klinger Volume Oscillator Pro begin to move out of sync.
For example, if price continues to make a Lower Low while Klinger Volume Oscillator Pro forms a Higher Low, price is still moving lower, but the volume force behind the bearish move is no longer strengthening at the same pace.
Conversely, if price makes a Higher High while Klinger Volume Oscillator Pro forms a Lower High, it may indicate that the volume force supporting the uptrend is beginning to weaken.
The value of divergence is that it can provide an early warning that the current trend may be losing strength. If price action later confirms a reversal, the trader may be able to identify the new move at an earlier stage, potentially creating a better Reward/Risk opportunity than waiting until the reversal becomes obvious.
However, divergence does not mean price is guaranteed to reverse.
Treat it as a reason to start watching for a potential setup, then wait for price-action confirmation before deciding whether to enter the trade.
Tip 7. Identify “Low Information Quality” Market Conditions
There are periods when trading signals still form correctly from a structural perspective, but the quality of market information is low.
3 conditions deserve particular attention:
- Klinger Volume Oscillator Pro repeatedly shifts state around the equilibrium zone → directional Volume Force is failing to persist.
- Quantum Vol-Delta repeatedly flips between Buy and Sell → aggressive order flow has not established a stable directional bias.
- Price action shows heavy overlap, wicks on both sides, and little displacement → repeated attempts to move price are being absorbed or reversed.
The key point is that these 3 conditions come from 3 different types of market information:
- Klinger Volume Oscillator Pro: the state of Volume Force.
- Quantum Vol-Delta: aggressive Buy/Sell activity.
- Price action: the final effect of trading activity on price.
When all 3 show instability at the same time, the trader has stronger grounds to classify the environment as a Low Information / Two-Way Auction rather than simply saying the market is “sideways.”
From a market microstructure perspective, order flow affects price through its interaction with available liquidity. As a result, the same amount of aggressive trading can produce strong price displacement in 1 environment and very little displacement in another, depending on the opposing liquidity available.
How to apply it: Create a separate state in your trading journal:
NO-TRADE / LOW INFORMATION STATE
Then test whether excluding these conditions actually reduces drawdown, shortens losing streaks, or improves expectancy.
This turns the decision to stay out of the market into a rule that can be measured and validated, rather than a discretionary judgment.
2. Daily Risk Limit and Stop-Trading Rule
Risk per trade controls the exposure of a single position; a daily loss limit controls the cumulative risk from a sequence of decisions within 1 trading session.
For scalping, multiple trades can occur within a short period, and the correlation between those trades is often high. For that reason, it is useful to define a maximum daily risk limit in advance, preferably in R-multiples rather than a fixed dollar amount.
For example, after reaching -2R or -3R for the day, stop trading and switch to review mode. The exact threshold should be based on the PnL distribution of the trading system.
The rationale behind a stop-trading rule is not that “the market becomes bad after 3 losing trades.” Instead, the rule helps limit tail risk created by 2 factors that may occur at the same time:
- The current market regime may not be favorable for the setup.
- The trader’s execution quality may deteriorate after a series of losses.
This rule should also be backtested. Compare PnL, maximum daily drawdown, and the number of trades missed under different limits, such as -2R, -3R, or no daily limit, to determine which approach best fits the strategy.
3. Minimum Trading Journal Data for Validating These Tips
At a minimum, each trade should record:
- Instrument
- Session
- KingRenko$ setting
- Setup type
- Klinger Volume Oscillator Pro state
- Rev^Out Scalping v2 signal type
- Quantum Vol-Delta state
- Entry price
- Stop distance
- Target in R
- Planned risk
- Actual slippage and commission
- MFE
- MAE
- Result in R
- Exit reason
For conditions such as late entry, repeated entry, or adverse Delta, add a separate boolean field or tag so those trades can be isolated and analyzed later.
Once you have a sufficiently large sample, do not ask only, “Did this rule produce more winning trades?”
Compare metrics such as expectancy, median R, maximum drawdown, losing streak, sample size, and performance stability across different periods.
A filter that increases win rate but removes a large portion of trades and lowers expectancy is not necessarily an improvement.
Conversely, a rule that leaves win rate almost unchanged but reduces tail losses or drawdown can still provide significant value from a risk-management perspective.
Continue reading → Chapter 7: Integrating Volume Flow Scalping Solution with Infinity Algo Engine$