
Chapter 3: Putting each component to work
This chapter introduces the four components of Volume Flow Scalping Solution, what each reveals on the chart, and how to use that information in your analysis:
- Klinger Volume Oscillator Pro – Read trend direction and Volume Force.
- Rev^Out Scalping – Identify Outside Bar signals through price action and volume.
- Quantum Vol-Delta – Read buy/sell pressure in the context of current volume.
- KingRenko$ – Enhance the reliability of signal candles through price-based bar construction.
The goal is simple: Understand what each component tells you before using its signals in the checklist.
1. Klinger Volume Oscillator Pro – Reading trend with volume
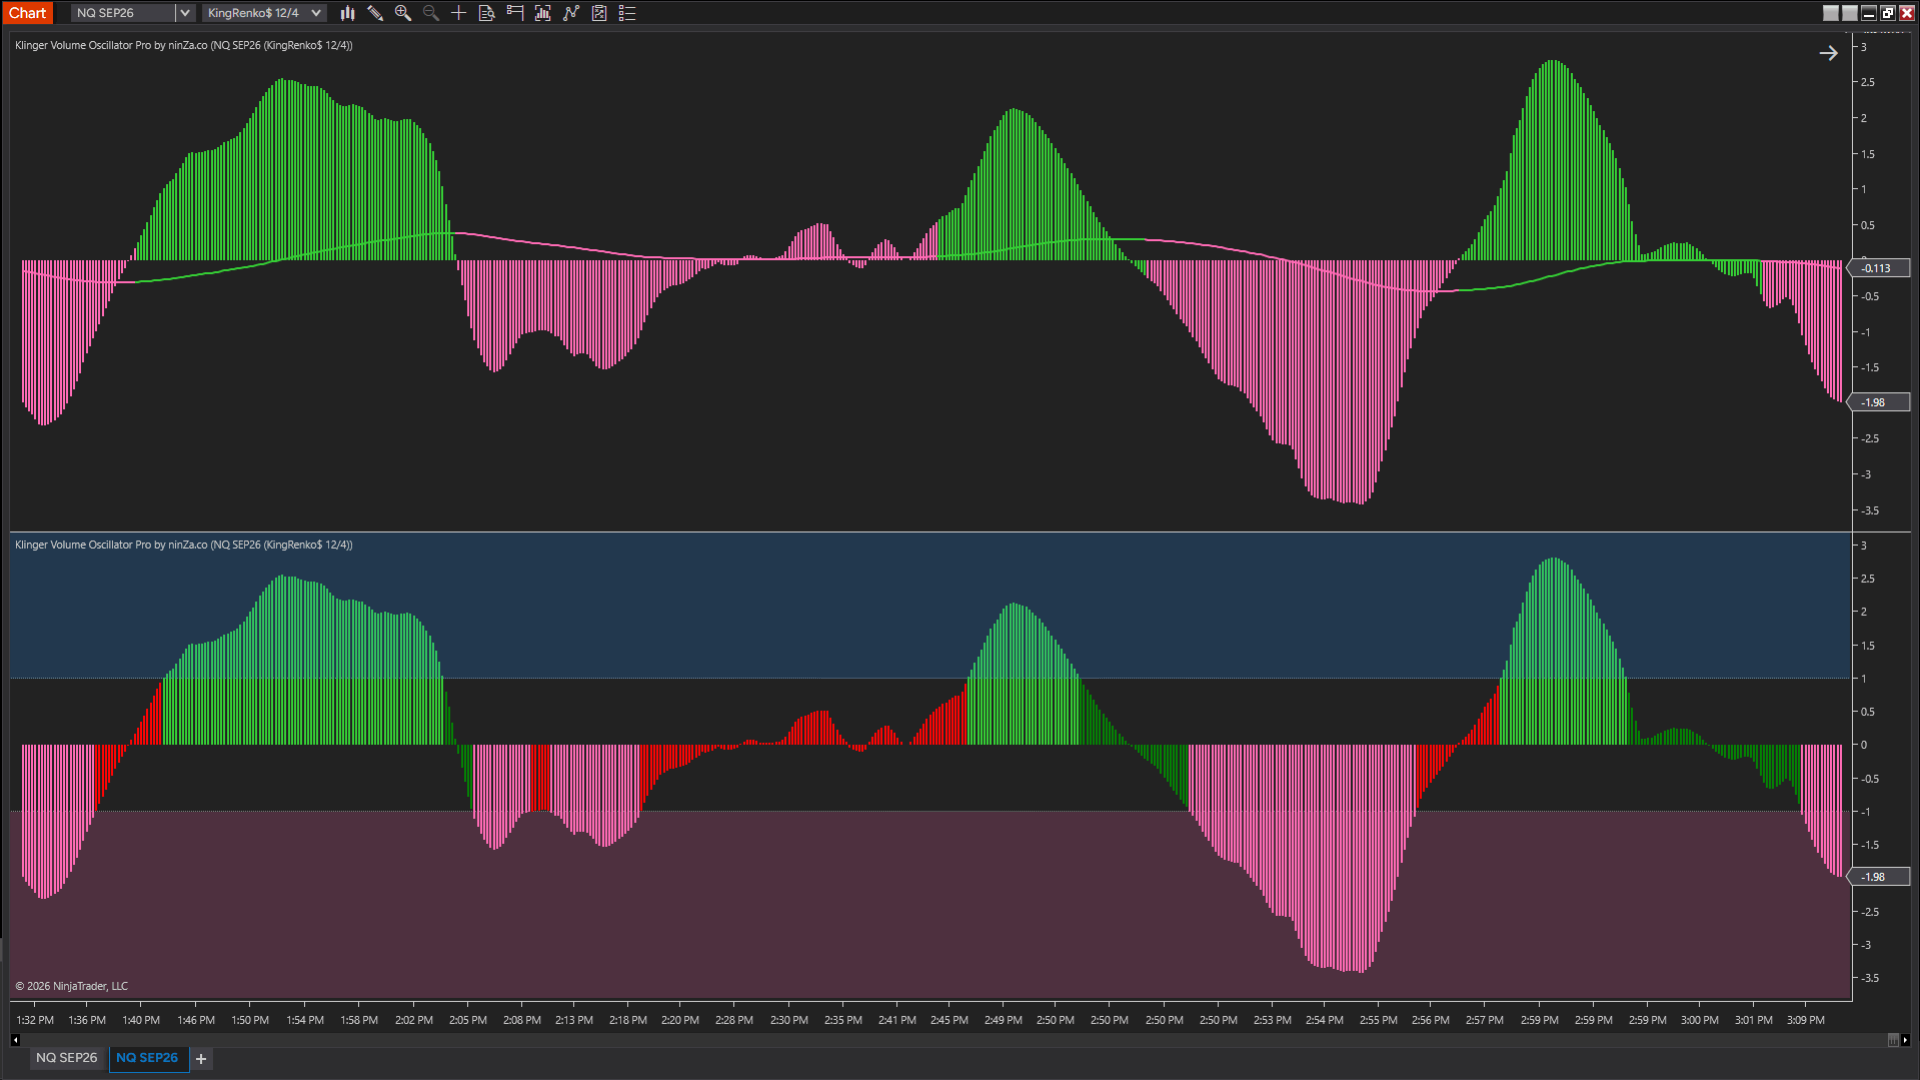
Klinger Volume Oscillator Pro may be the most difficult indicator in the bundle to interpret at first glance, especially when you are looking only at the oscillator lines. You do not need to understand the full calculation behind it.
What matters is the question it helps you answer: “Which direction is the current move being supported by volume – and how strong is that support?”
1.1. Price direction does not tell you how strong the flow is
An uptrend tells you that price is moving higher. It does not tell you how strongly the market is participating in that move.
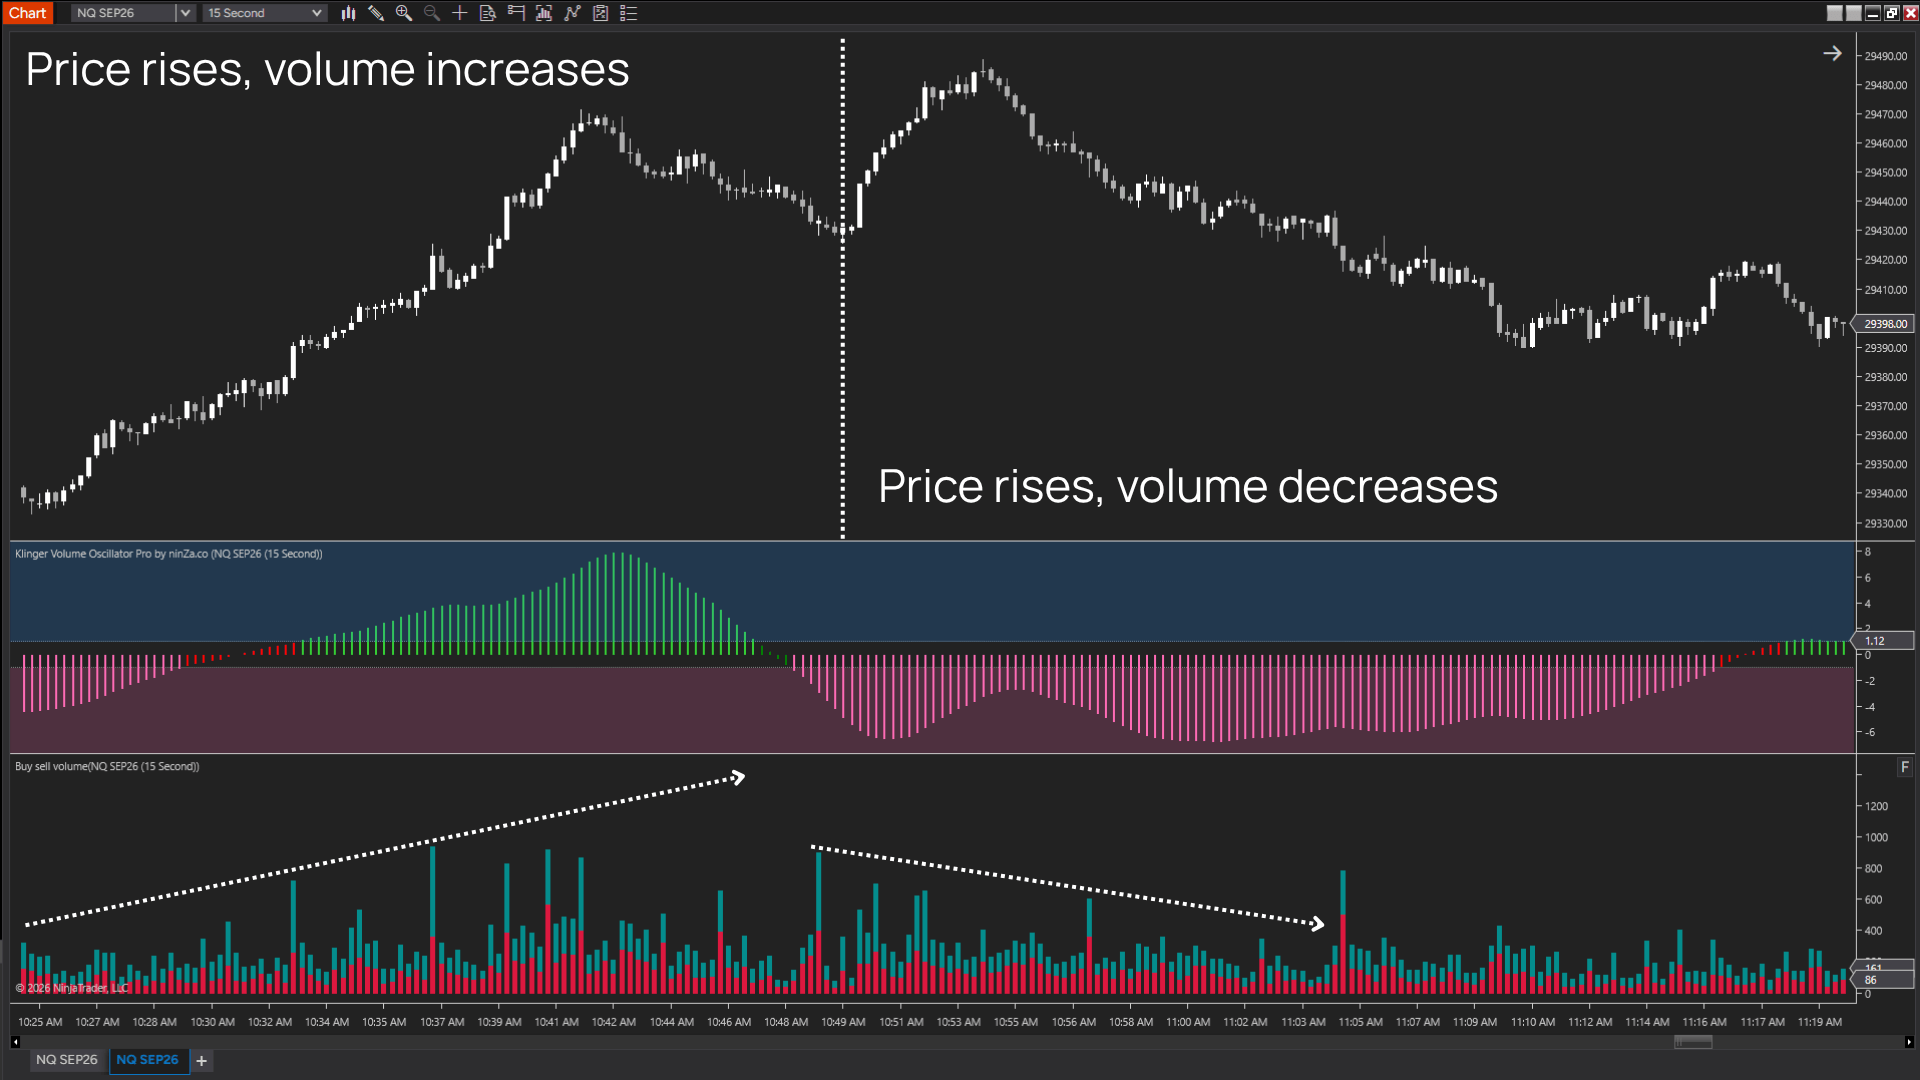
Consider 2 uptrends:
- Price rising + strong volume: the move has stronger participation behind it.
- Price rising + weak volume: price is still moving higher, but participation is not keeping pace.
The same applies to a downtrend:
- Price falling + strong volume: selling pressure is strong.
- Price falling + weak volume: price is falling, but the participation behind the move is relatively weak.
Klinger Volume Oscillator Pro combines price action with Volume Force to help distinguish between these conditions. So the question is not simply, “Is price moving up or down?” It is the more useful question:
1.2. Two ways to read Klinger Volume Oscillator Pro
Klinger Volume Oscillator Pro offers 2 trading modes. Each presents the information differently, but both are designed to help you read trend direction and strength.
1. Plots Crossover Mode
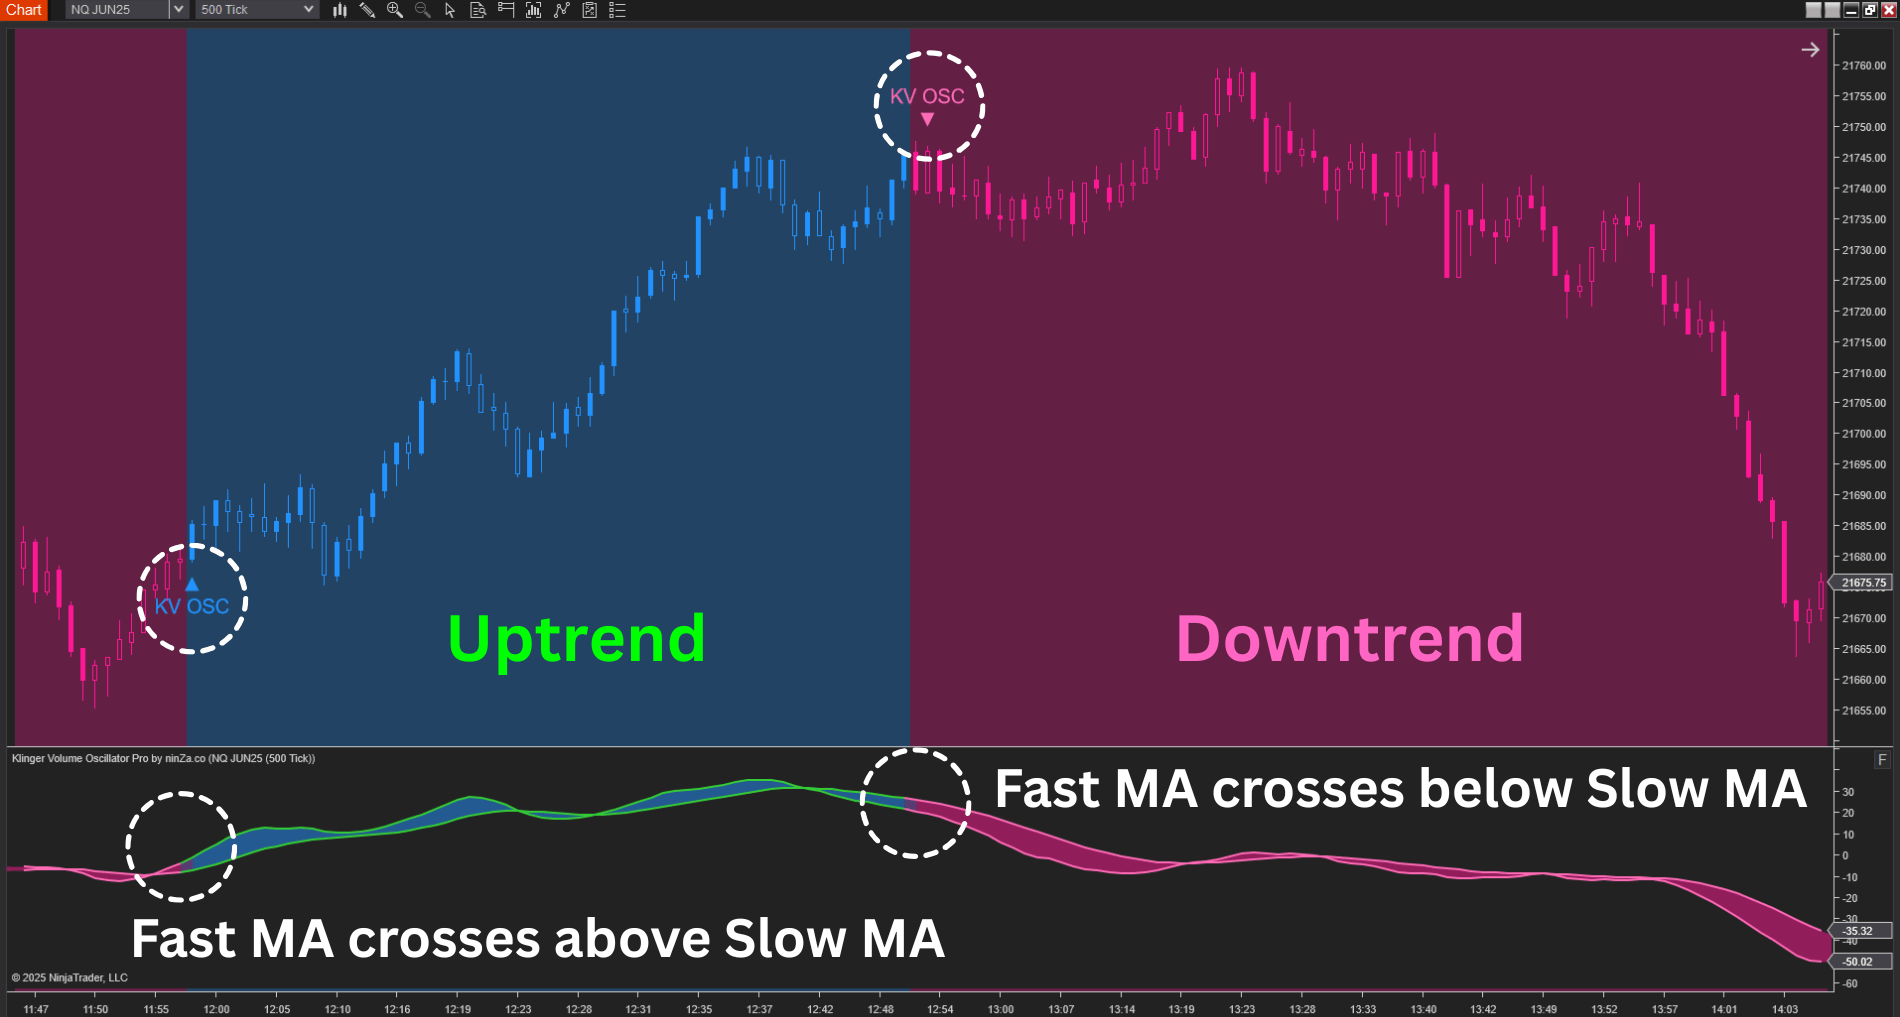
This mode uses two smoothed lines:
- Fast Plot crosses above Slow Plot → the trend shifts bullish.
- Fast Plot crosses below Slow Plot → the trend shifts bearish.
The crossover is only the starting point. Pay attention to the slope and behavior of both lines after the crossover as well. These can provide important context about the strength and persistence of the move.
2. Threshold-Based Mode
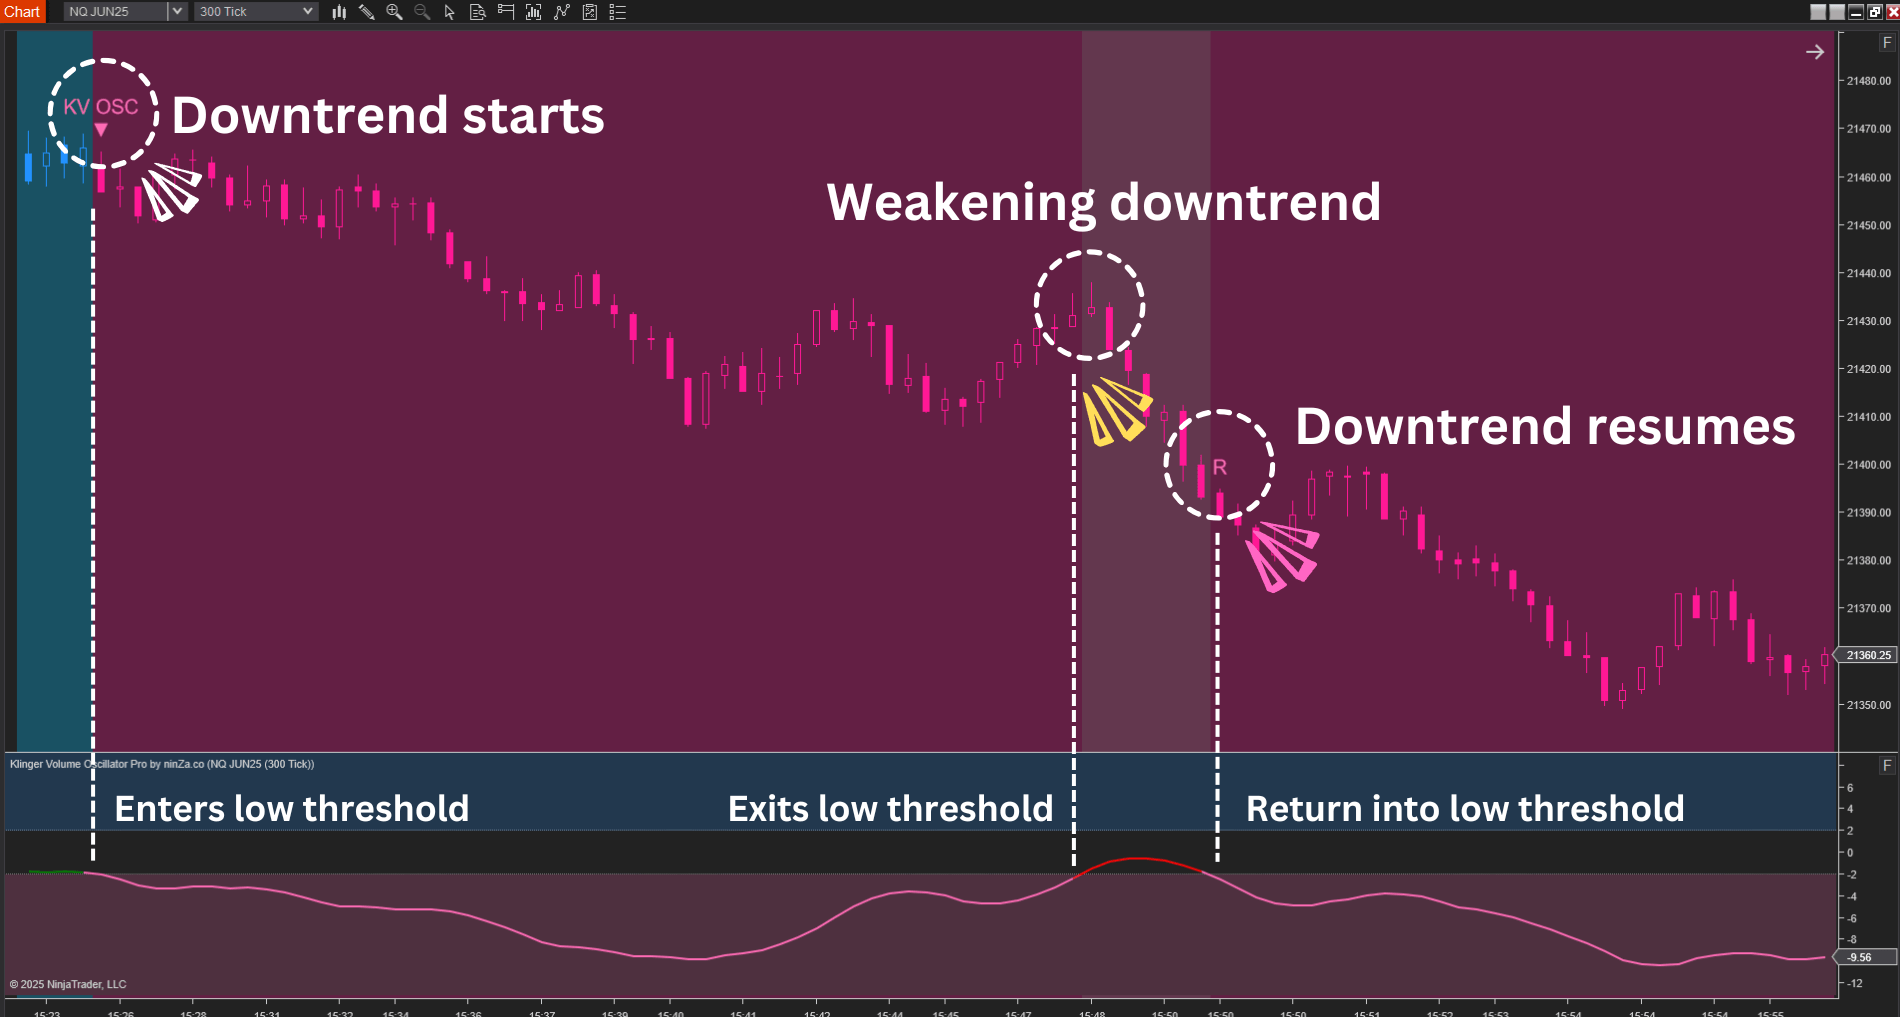
This mode simplifies Klinger by translating its readings into strength zones:
- Signal enters the Upper Threshold → bullish momentum is strong.
- Signal exits the Upper Threshold → bullish pressure is weakening.
- Signal enters the Lower Threshold → bearish momentum is strong.
- Signal exits the Lower Threshold → bearish pressure is weakening.
- Signal exits a Threshold and then returns → the trend may be continuing or regaining strength.
This mode is particularly useful for fast chart reading. Instead of constantly judging the distance and crossovers between two lines, you can quickly see where the signal sits within the strength zones.
2. Rev^Out Scalping – Reading Outside Bars
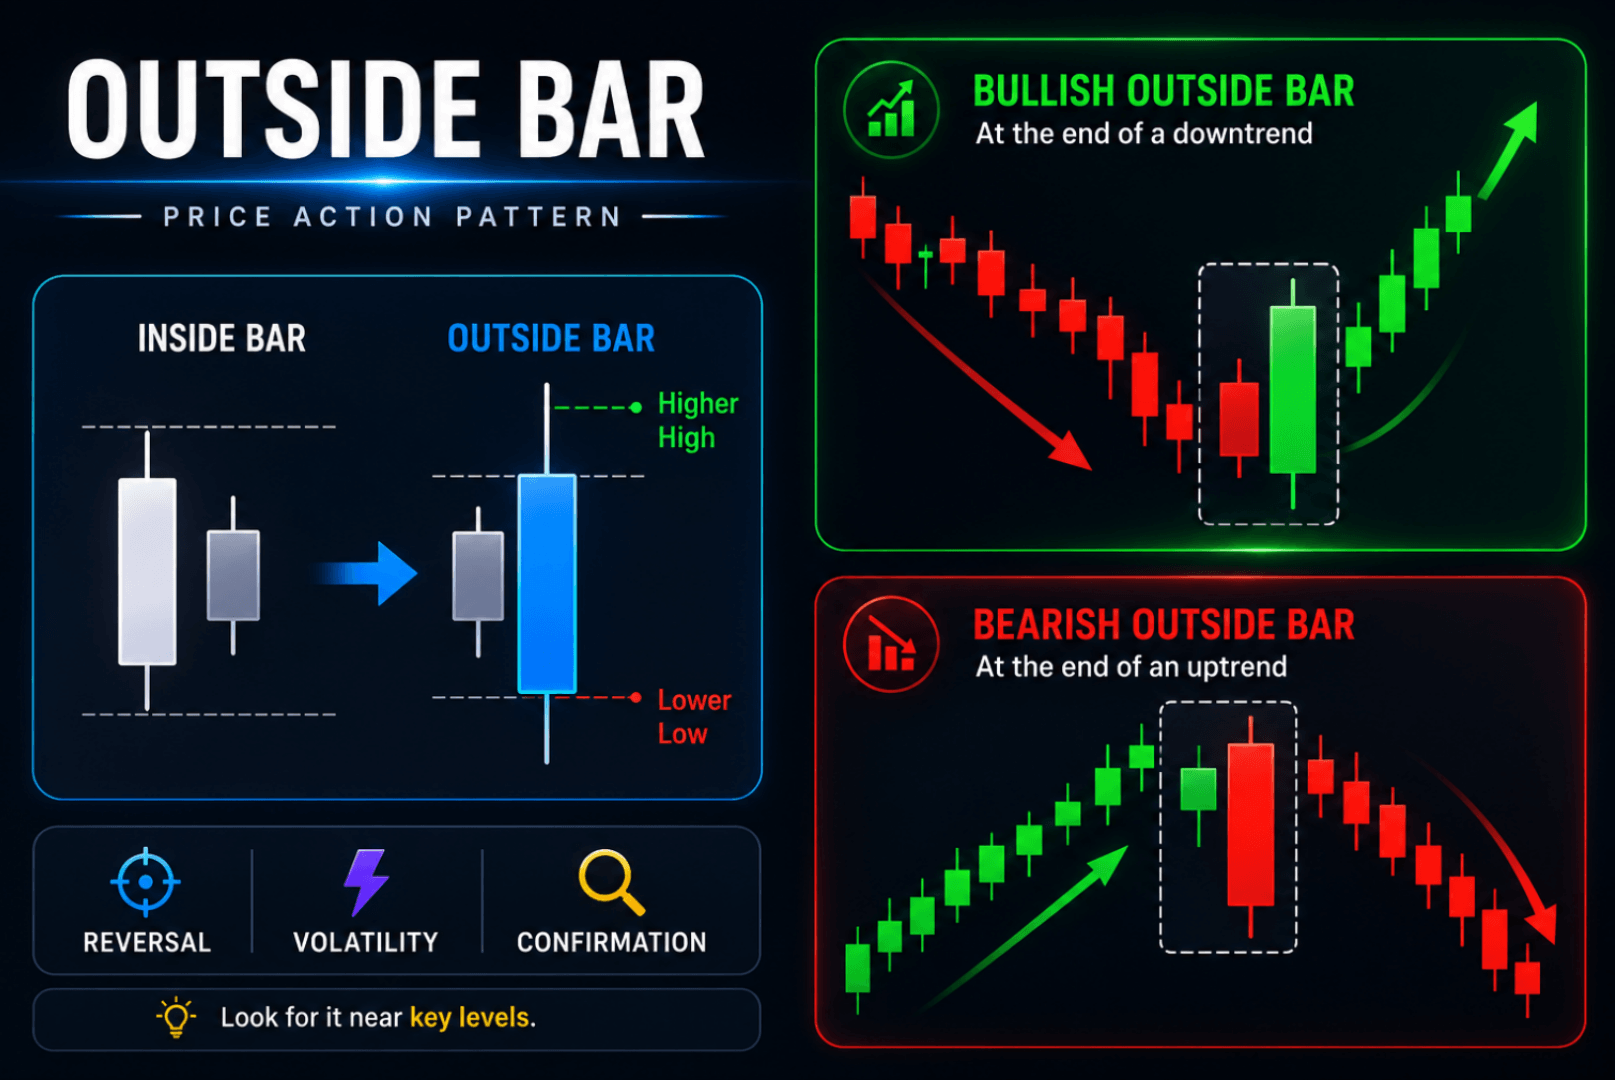
An Outside Bar is a candle whose High–Low range completely exceeds that of the previous candle. In price action terms, it shows that price has traded beyond both ends of the previous candle’s range within a single bar.
But the key is not to assume that every Outside Bar signals a reversal. What matters is how the pattern forms within its price and volume context.
Outside Bars are a common price action pattern, but their meaning depends heavily on where and how they form. That is why this guide does not treat the Outside Bar as a standalone signal. Instead, it is read alongside Klinger Volume Oscillator Pro and Quantum Vol-Delta to provide additional context before a trade decision is made.
Rev^Out Scalping provides 2 complementary signal types, each offering a different view of the price action:
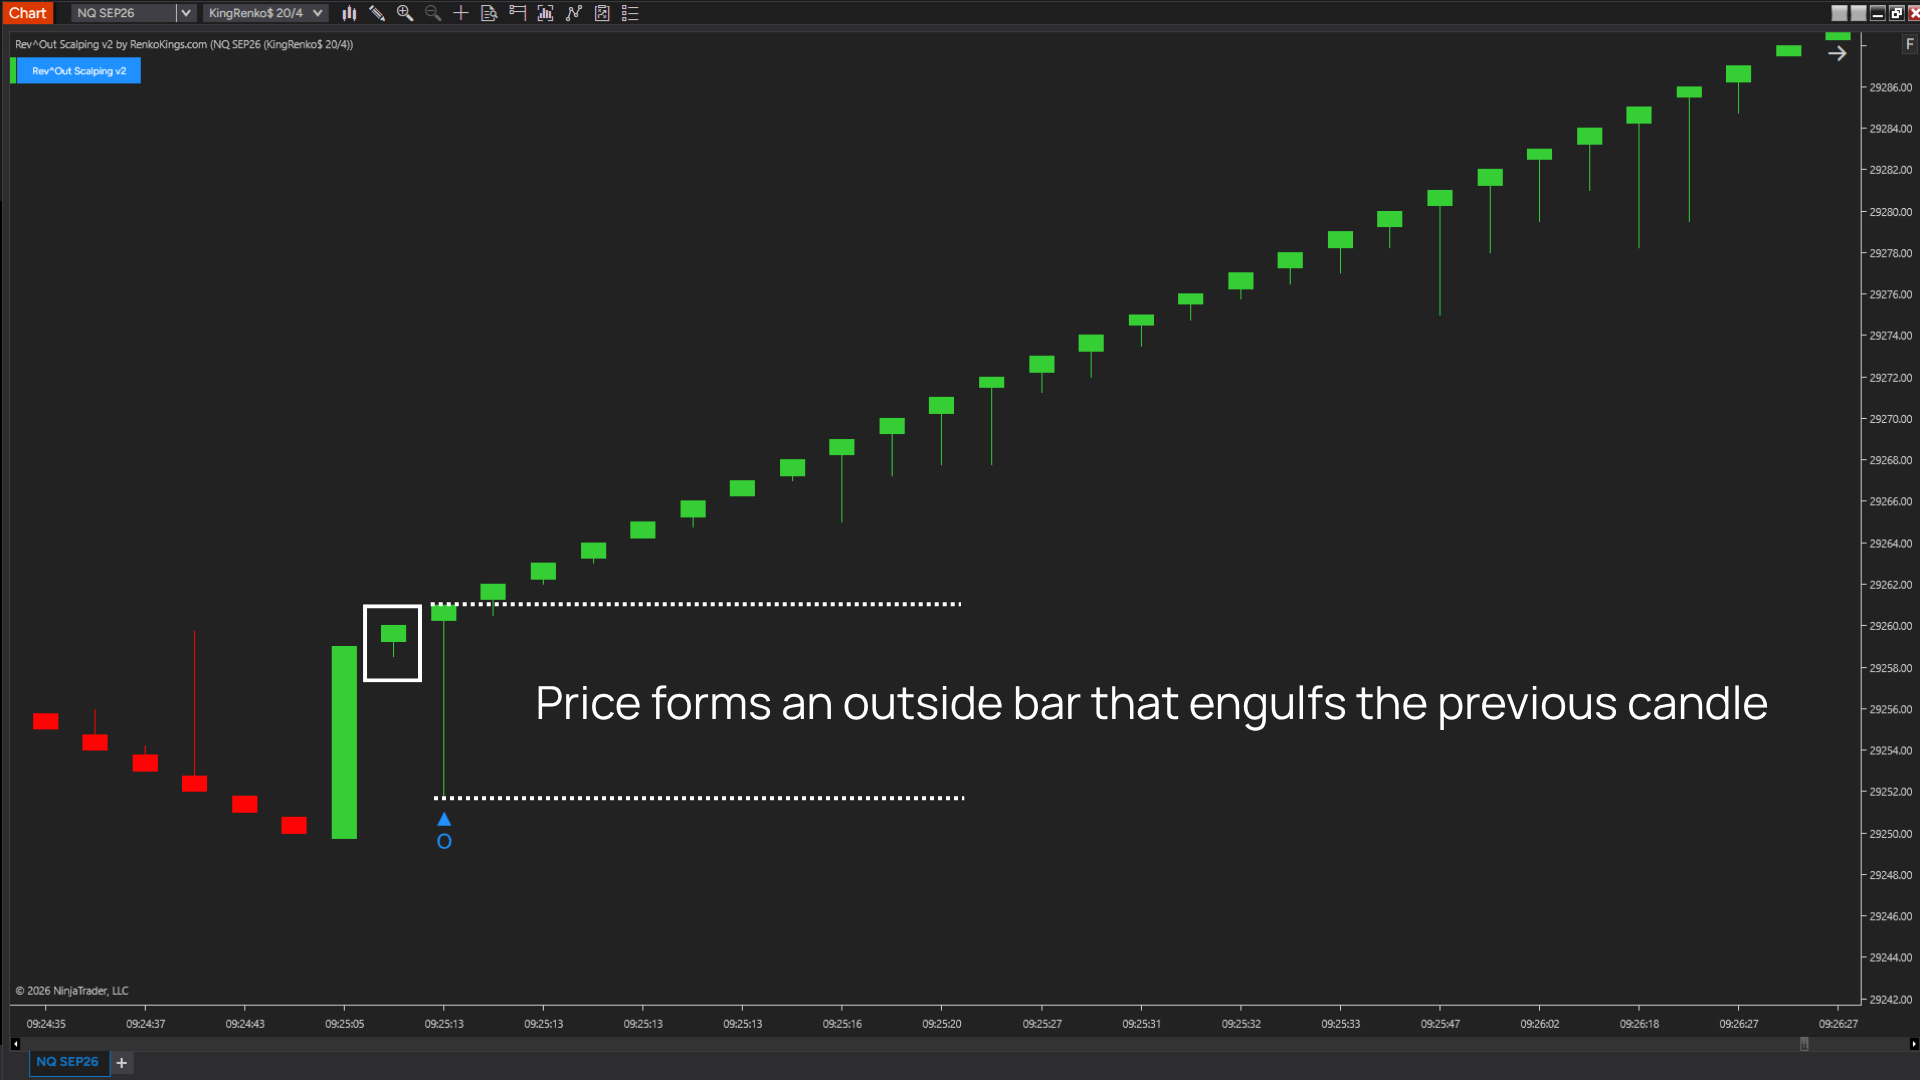
1. OHLC Signal identifies a pure Outside Bar through price action, using the candle’s Open, High, Low, and Close relative to the previous candle. This is the price structure layer and does not require volume data.
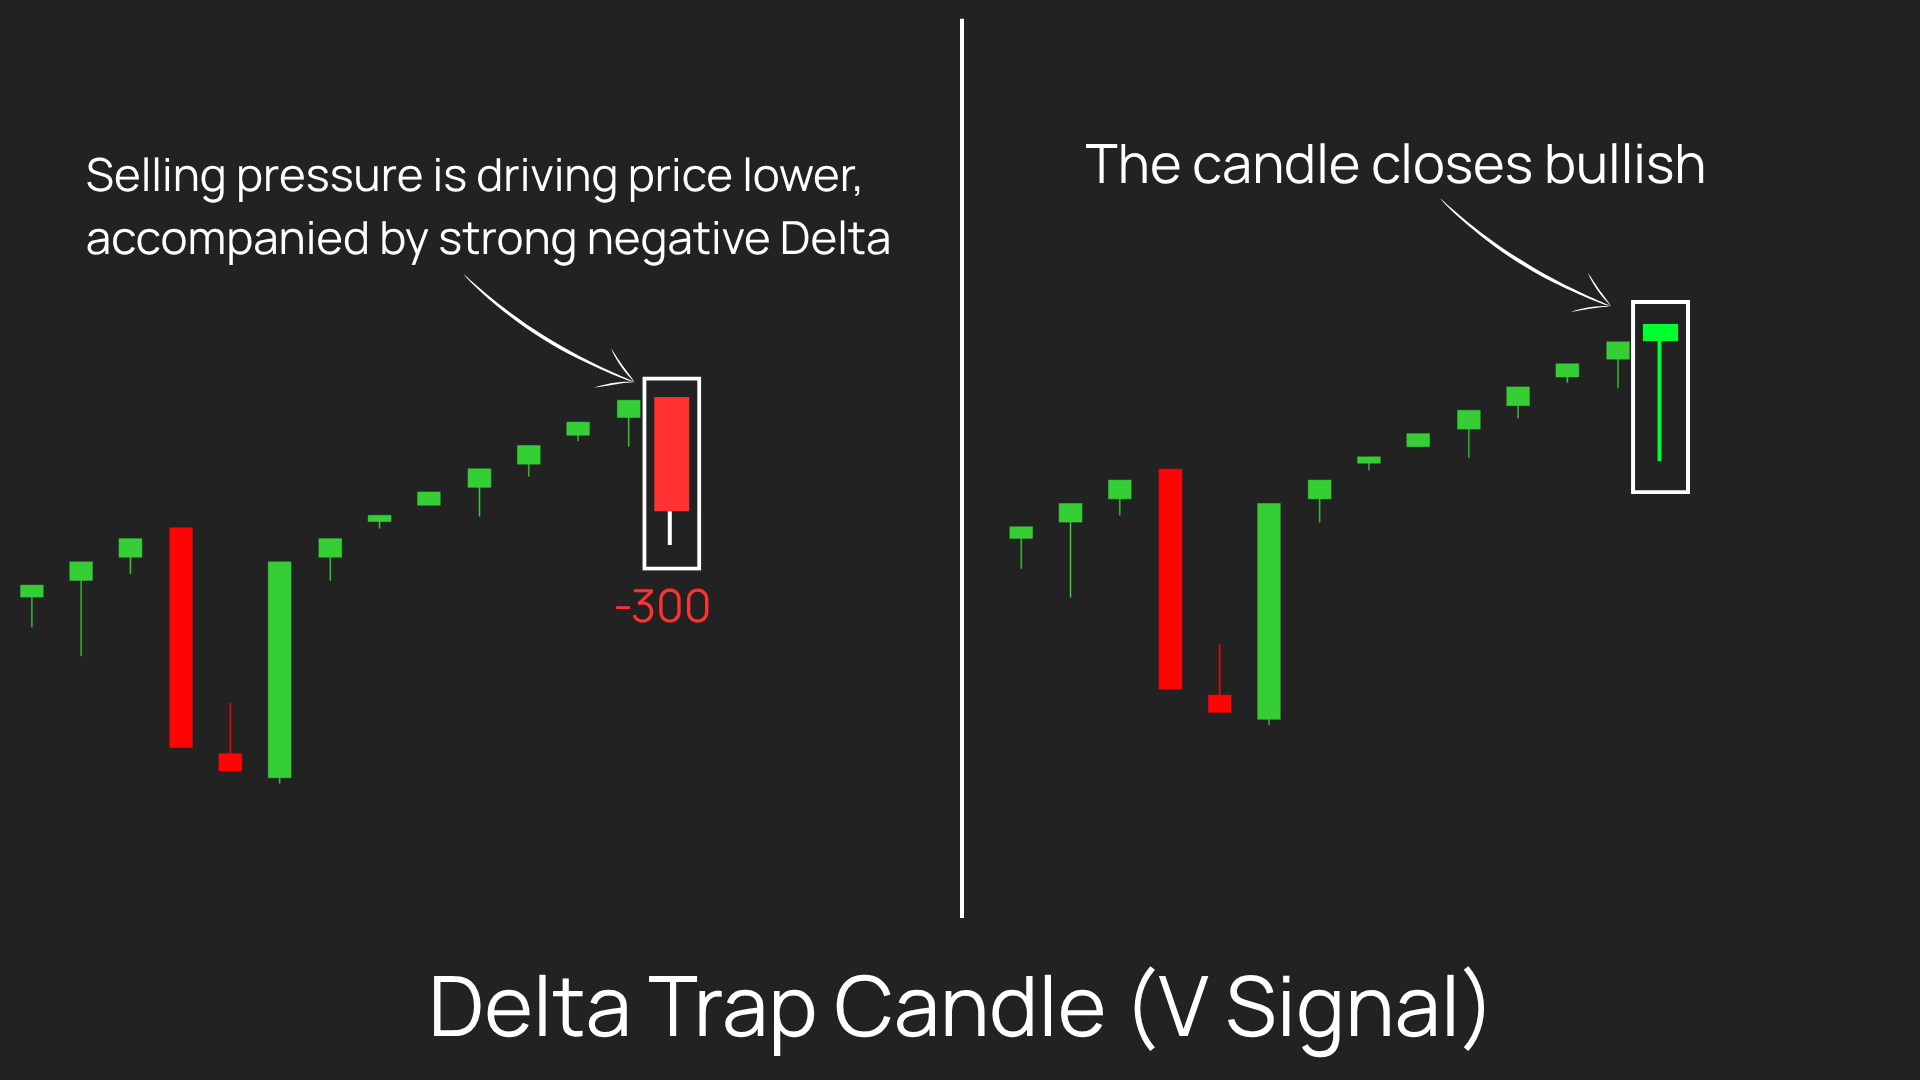
2. Vol Signal identifies a volume failure – when heavy volume attempts to push price further but fails to produce a meaningful new close or is pushed back. This can indicate absorption: one side applies significant pressure, but the opposing side is strong enough to absorb that pressure without allowing price to move significantly further.
Reference – Why High Volume Without Price Movement Matters
In market microstructure theory, price movement is driven by active order flow interacting with available liquidity. When opposing liquidity is insufficient to absorb the incoming flow, price moves. When sufficient liquidity is available, price can remain relatively stable even with heavy trading volume.
This provides a theoretical basis for interpreting a high-volume candle with a narrow range or a strong rejection. Rather than simply indicating high market activity, such a candle can suggest that one side had enough participation to absorb the pressure from the other.
Source: Kyle, A. S. (1985), “Continuous Auctions and Insider Trading,” Econometrica, 53(6), 1315–1335.
The OHLC and Vol signals give you two different views of the same candle: price structure and volume response. When the two appear close together, the area becomes worth a closer look — a reason to check the broader context and Delta, not an automatic high-probability entry.
3. Quantum Vol-Delta – Reading Buy & Sell pressure in context
Volume Delta shows the imbalance between buying and selling activity within each candle. But a Delta value means little on its own. Its significance depends on the volume environment around it.
Market volume can vary significantly across sessions and between active and quiet periods. A fixed threshold such as “Delta > 100” may be highly significant in one environment but almost meaningless in another.
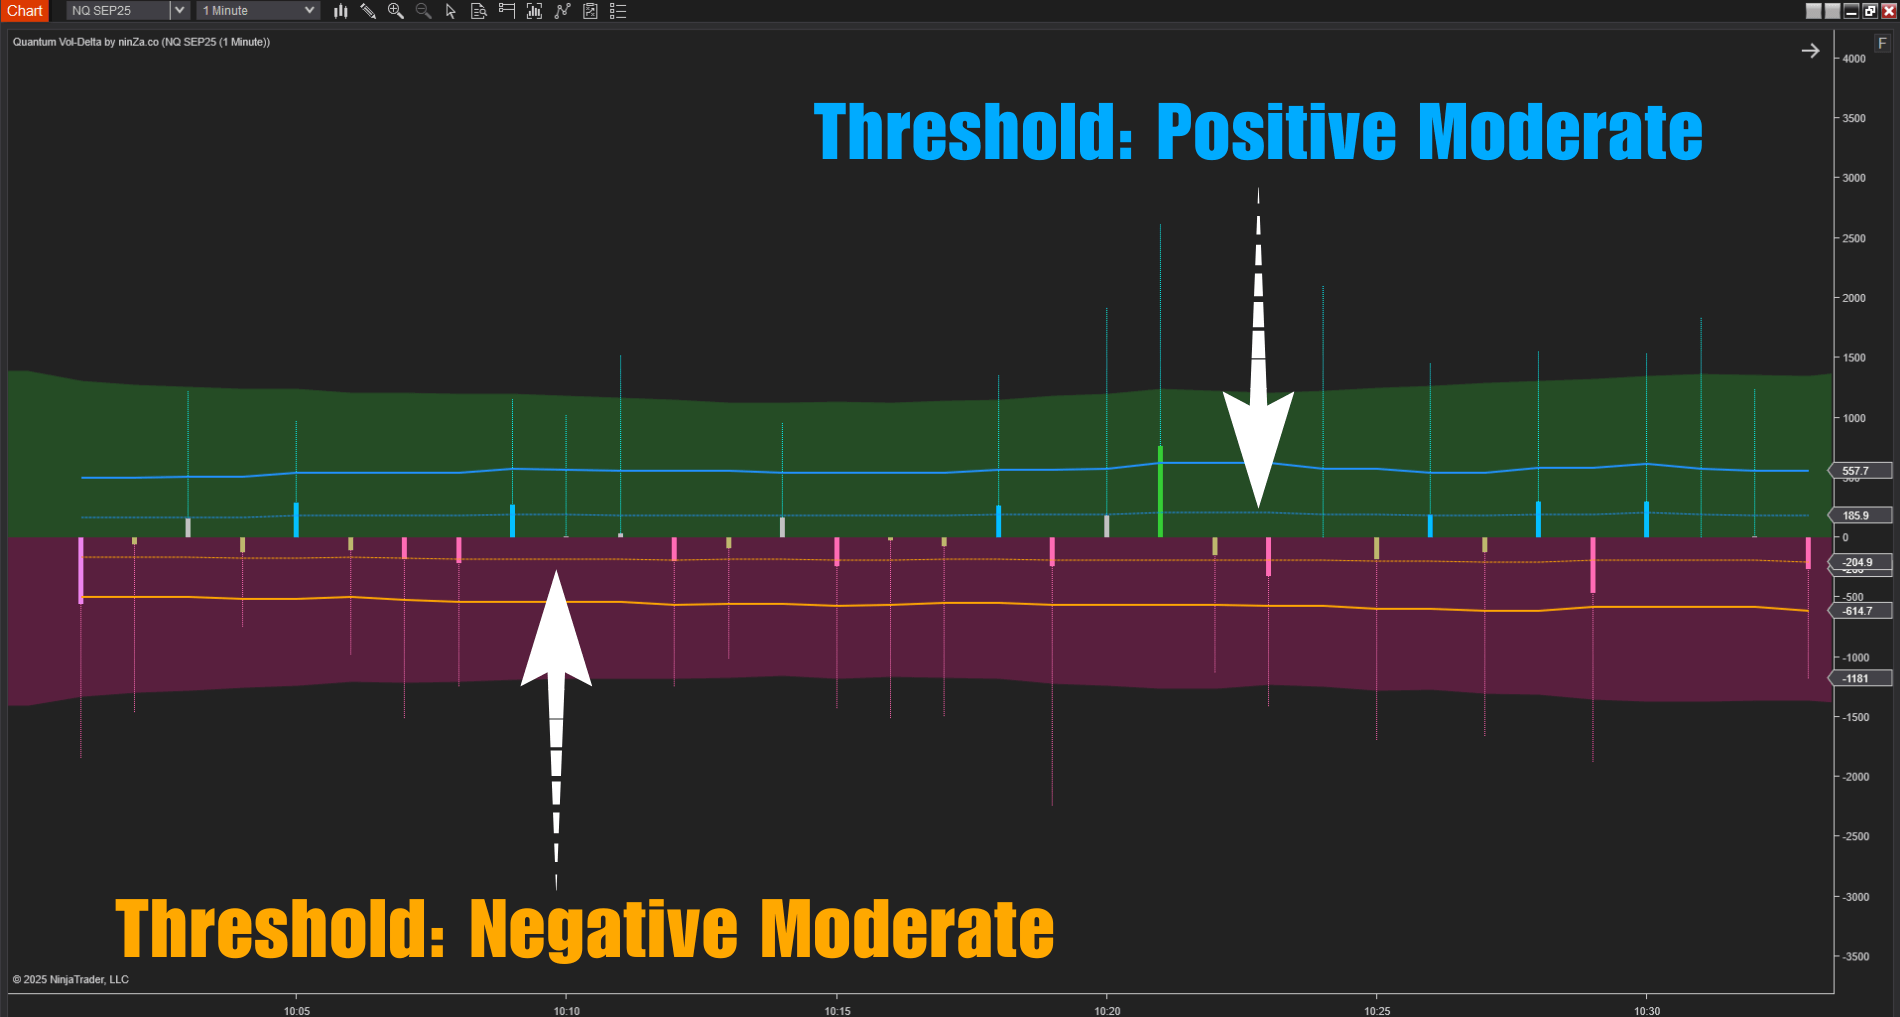
Quantum Vol-Delta addresses this with Adaptive Delta Thresholds. Instead of relying on a fixed Delta threshold, the indicator automatically calculates Low and High levels based on the market’s current volume activity. As overall volume increases, the Delta thresholds rise; as volume decreases, they adjust lower.
The key question is not, “Is the current Delta large in absolute terms?”
It is: “Is this Delta significant relative to the market activity right now?”
Beyond Delta, Quantum Vol-Delta tracks the average Buy and Sell Volume over the most recent candles to gauge actual participation from each side. Delta Wicks highlight moments when one side is taking control, but the indicator does not rely on Delta alone.
A signal becomes more meaningful when three factors align: Delta reaches its adaptive threshold, the candle direction agrees with the imbalance, and the dominant side’s volume is above its recent average.
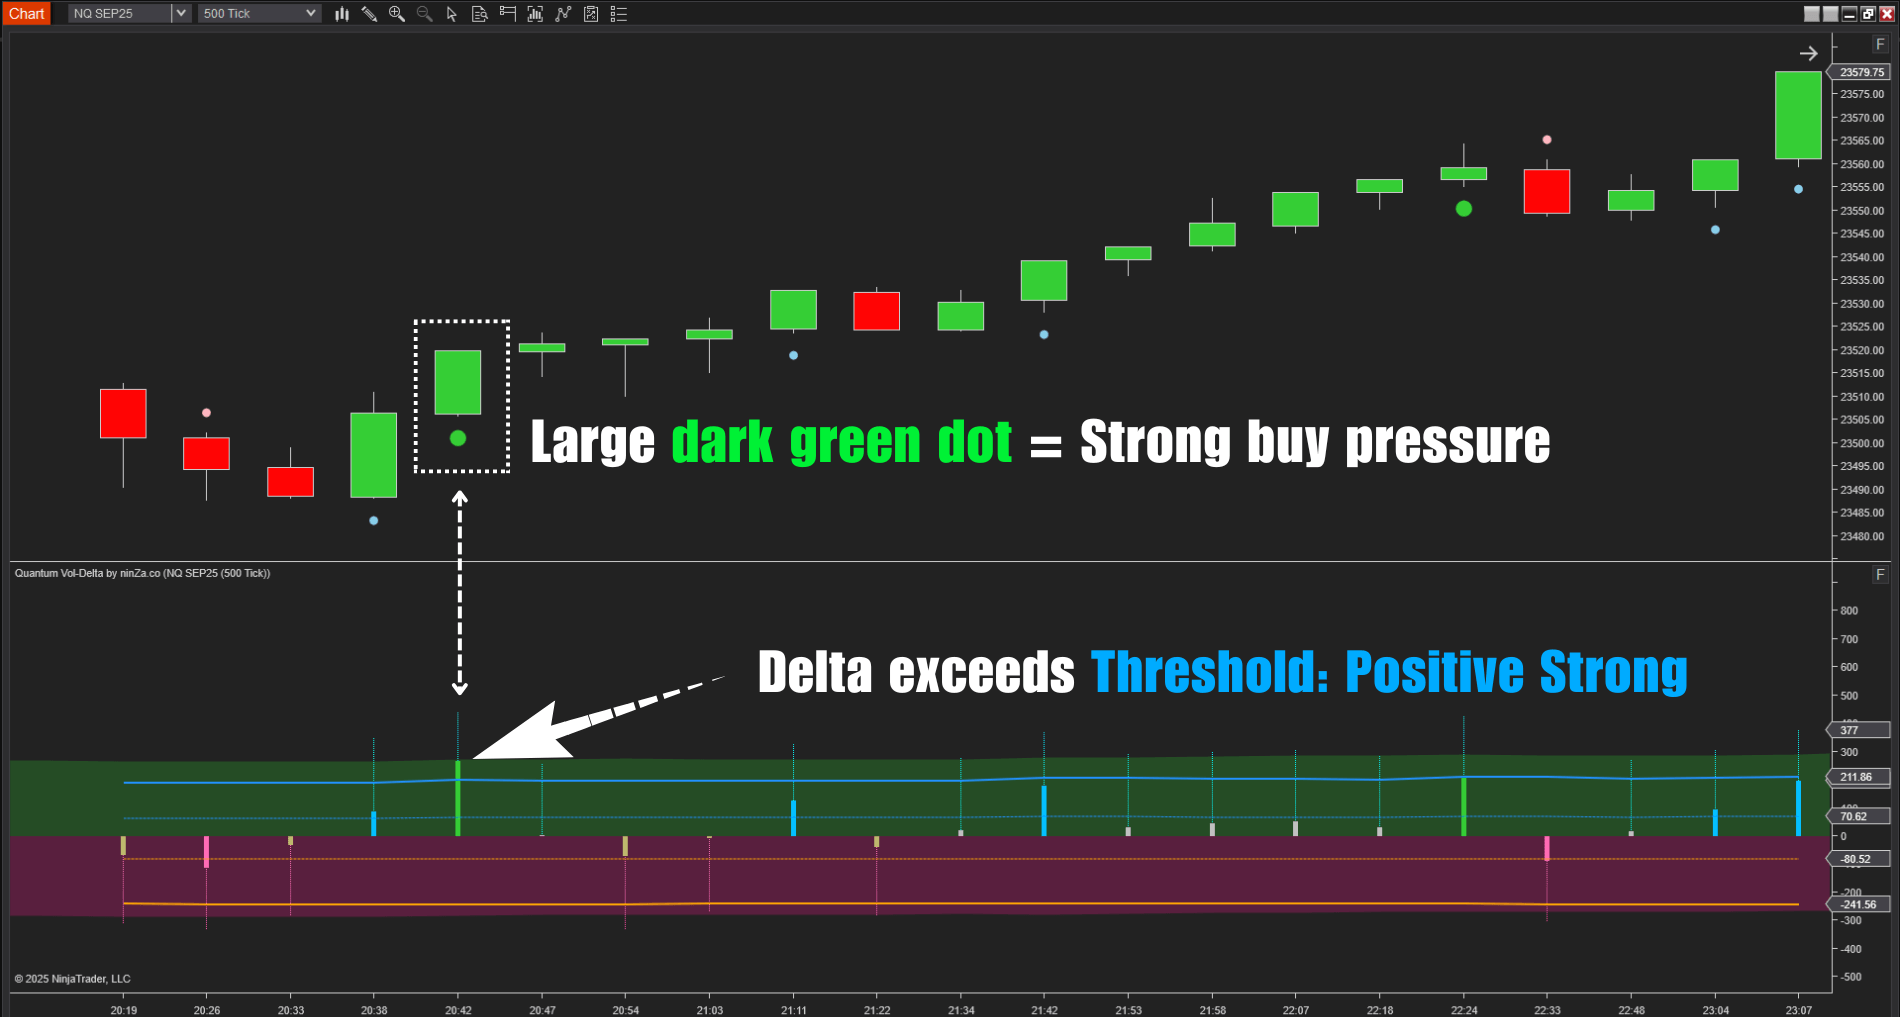
Adaptive Thresholds adjust Delta readings to changing volume conditions across sessions, so you don’t have to manually recalibrate them when switching sessions.
Reference – Classifying Trades by Initiator
Classic market microstructure research established methods for inferring whether an executed trade was initiated by a buyer or seller, based on where the trade occurred relative to the prevailing bid and ask prices.
This provides the conceptual foundation for the “Delta” and “buy/sell volume” measures commonly used across retail trading platforms today, although the specific classification methods can vary between platforms.
Source: Lee, C. M. C. & Ready, M. J. (1991), “Inferring Trade Direction from Intraday Data,” Journal of Finance, 46(2), 733–746.
4. KingRenko$ – Enhancing signal candle reliability
Renko is a price-based chart type rather than a time-based one. Instead of forming a new bar at fixed time intervals, Renko prints a new brick only after price moves a defined distance, known as the brick size. A separate reversal threshold determines how far price must move in the opposite direction before a brick is formed the other way.
Because each brick represents a fixed amount of price movement rather than a fixed period of time, Renko filters out much of the minor price noise that does not reach a meaningful threshold, leaving a cleaner view of larger price moves.
KingRenko$ standardizes bar formation around price movement rather than fixed time intervals. This gives traders a more consistent unit for comparing candle patterns.
But a Renko signal is not automatically more reliable. Setup quality still depends on the brick size, reversal threshold, instrument, and how the signal is validated.
This is a mechanical argument – it describes how Renko is constructed and the implications of that structure, not a claim that Renko trading has a higher win rate than conventional charts.
The appropriate brick size and reversal threshold still need to be validated for each market and trading style, as discussed in Chapter 7.
Continue reading → Chapter 4: Volume Flow Scalping Solution – 3 setups, 1 checklist