
Chapter 2: Volume Flow Scalping Solution – Tackling the trader’s challenge
This chapter looks at why volume can become difficult to read in scalping and how Volume Flow Scalping Solution organizes different layers of information into a simpler, more structured reading process.
1. Why Volume gets complicated
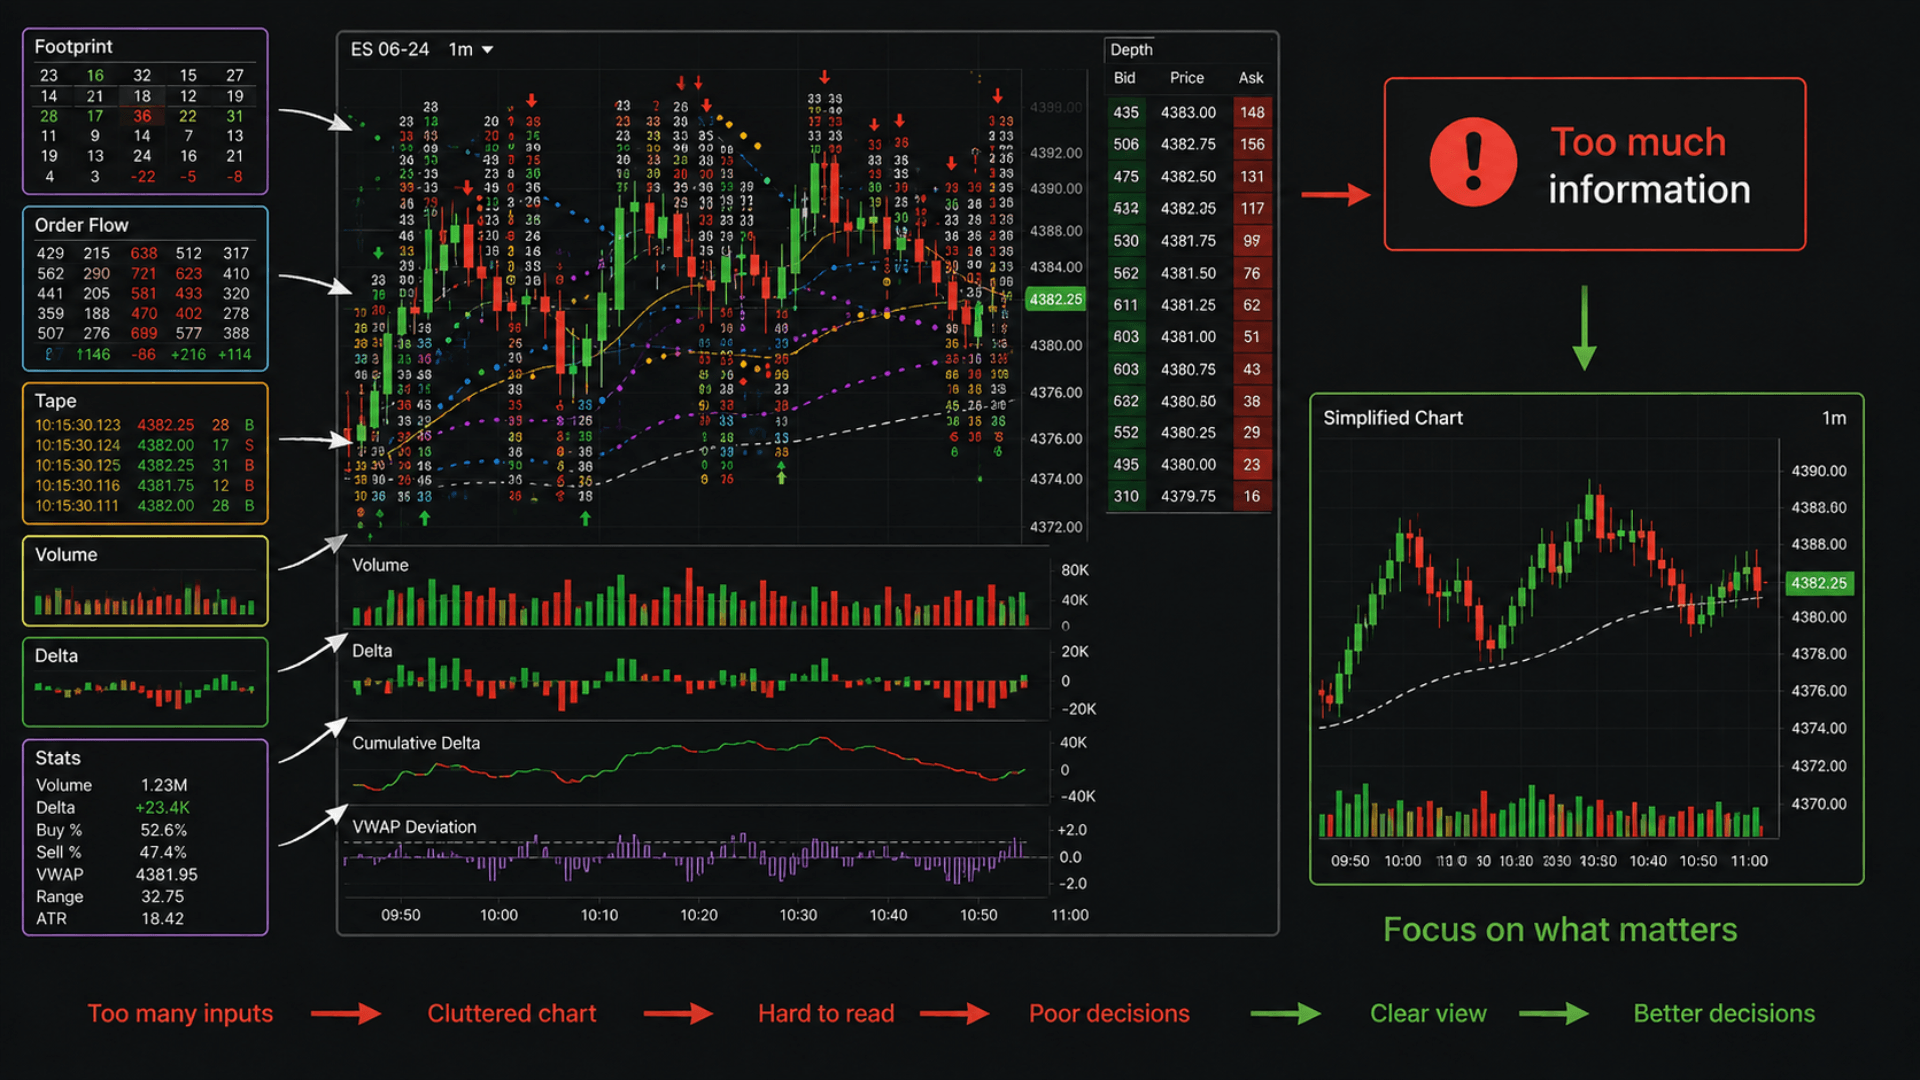
Volume is a broad source of market information. Every executed trade leaves data behind, and as you go deeper, you can also explore order flow, the tape, footprint, market depth, and a wide range of other metrics.
Each can provide valuable insight in the right context. The challenge is knowing what to focus on – and when. Trying to process too many layers of information at once can slow down decision-making and make your trading process less consistent.
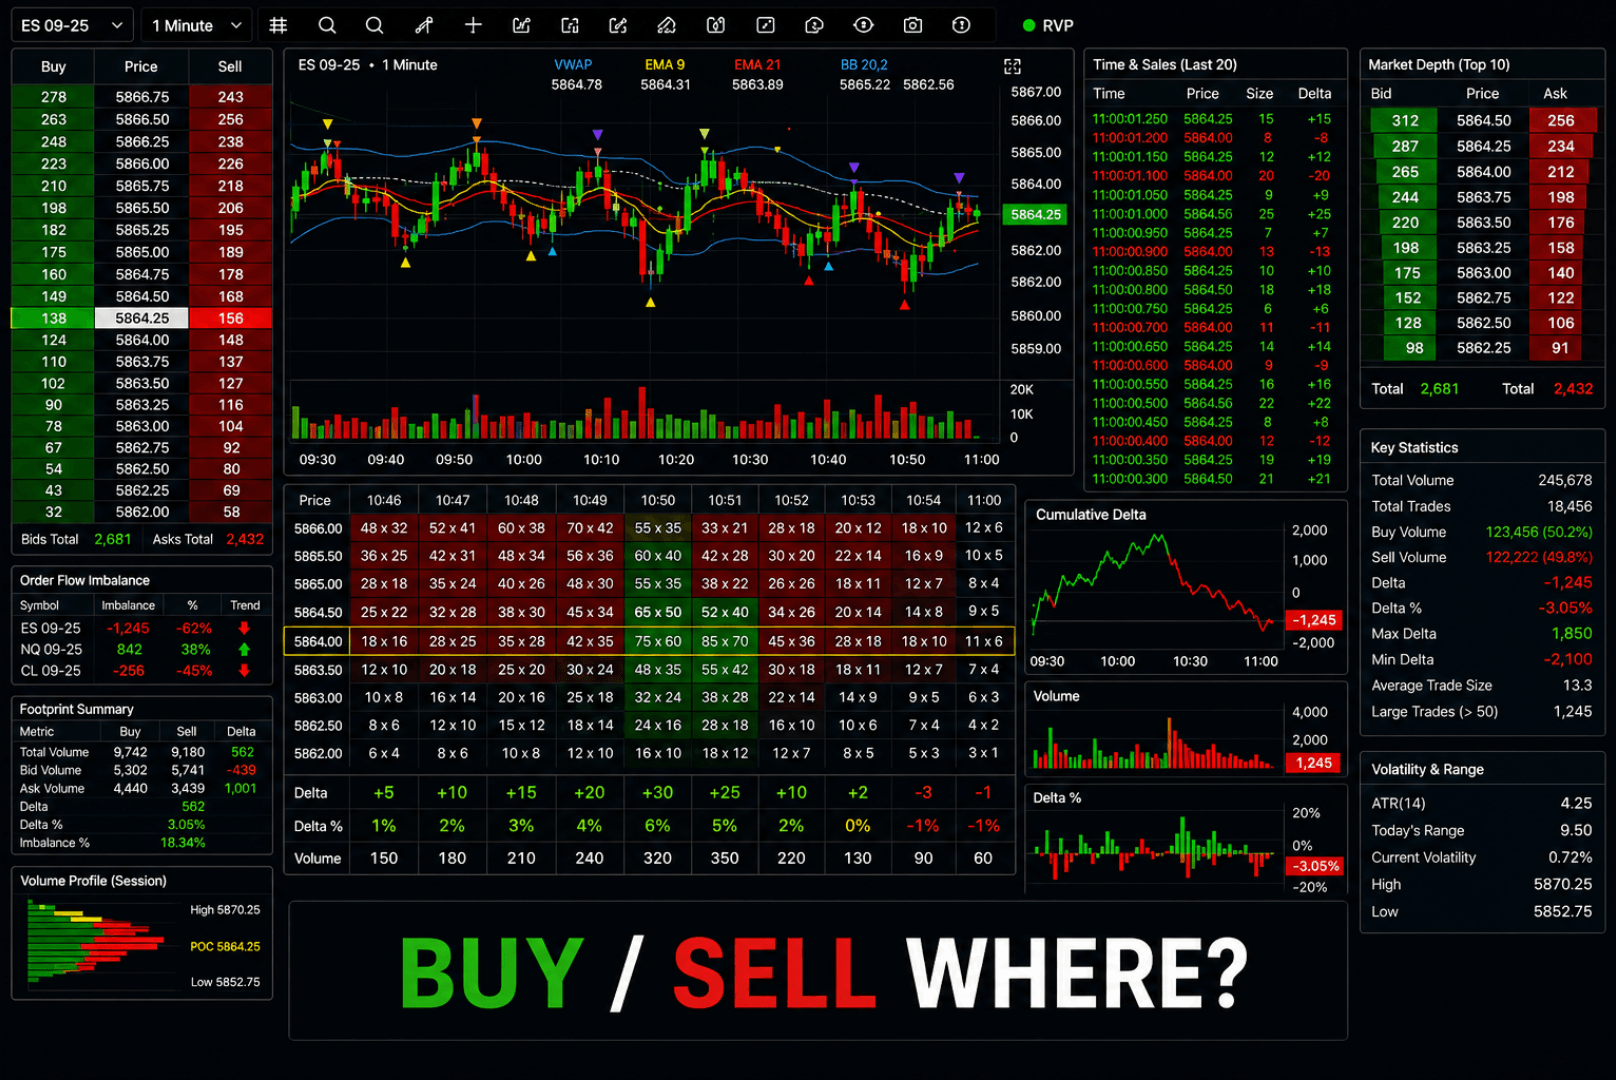
Volume is a vast source of market information. Every executed trade leaves data behind. Go deeper, and you can also explore order flow, the tape, footprint, market depth, and a wide range of other metrics.
Each can provide valuable insight in the right context. The challenge comes when you try to read too many layers at once – decision-making slows down, and consistency starts to suffer.
The question is not how much more volume data we need, but what we want volume to confirm in a scalping setup. This principle guides the role of each indicator in the solution.
Reference – The Relationship Between Price Changes and Volume
Karpoff’s academic review examined a large body of research and identified two empirical relationships: trading volume is positively related to the magnitude of price changes, and in stock markets, volume is also related to the direction of price changes.
This provides evidence that volume contains information relevant to price movements. However, the research does not conclude that volume alone can predict the next direction of price. That interpretation belongs to the trader and should be made with care, rather than treated as a conclusion established by the original research.
Source: Karpoff, J. M. (1987), “The Relation Between Price Changes and Trading Volume: A Survey,” Journal of Financial and Quantitative Analysis, 22(1), 109–126.
2. Simplifying Volume Analysis
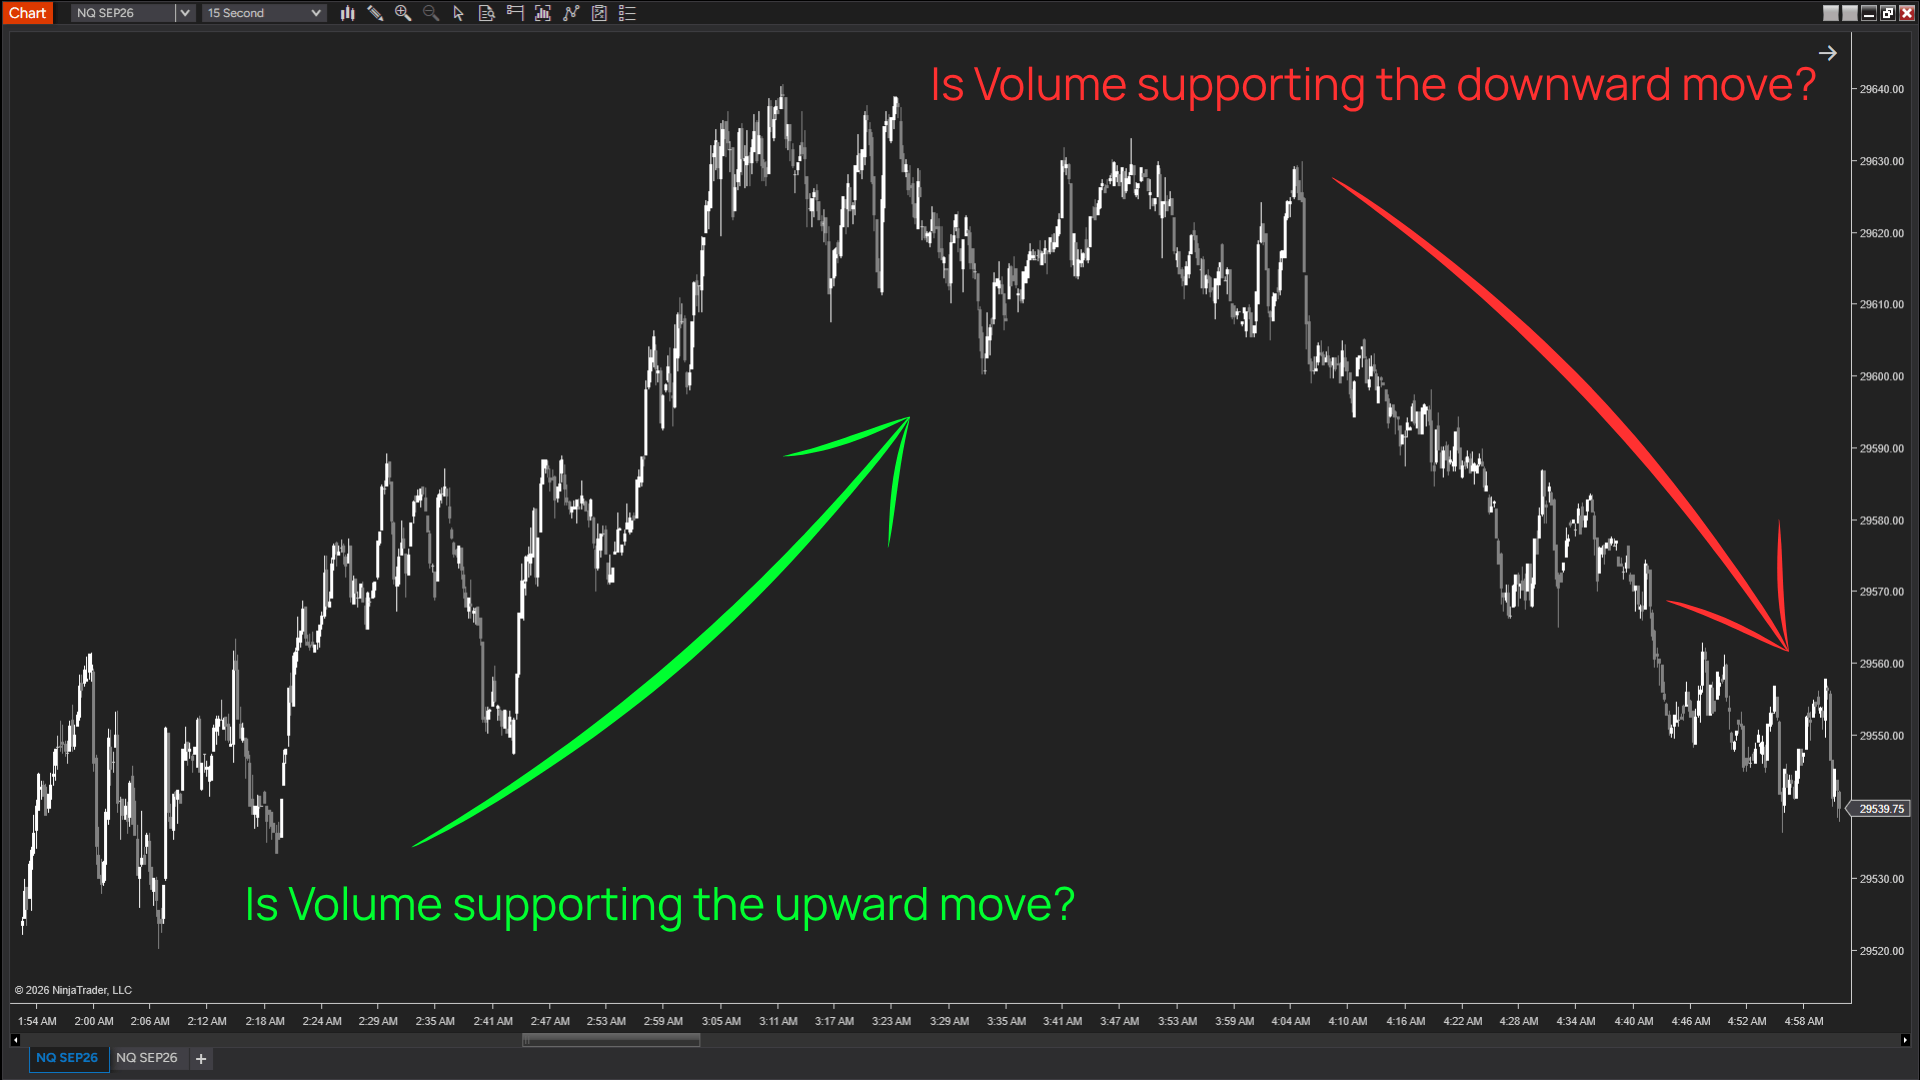
At the level of a single candle or a short price move, start with a simple question:
“Is volume supporting buyers or sellers, and does that level of support align with the price movement you’re seeing?”
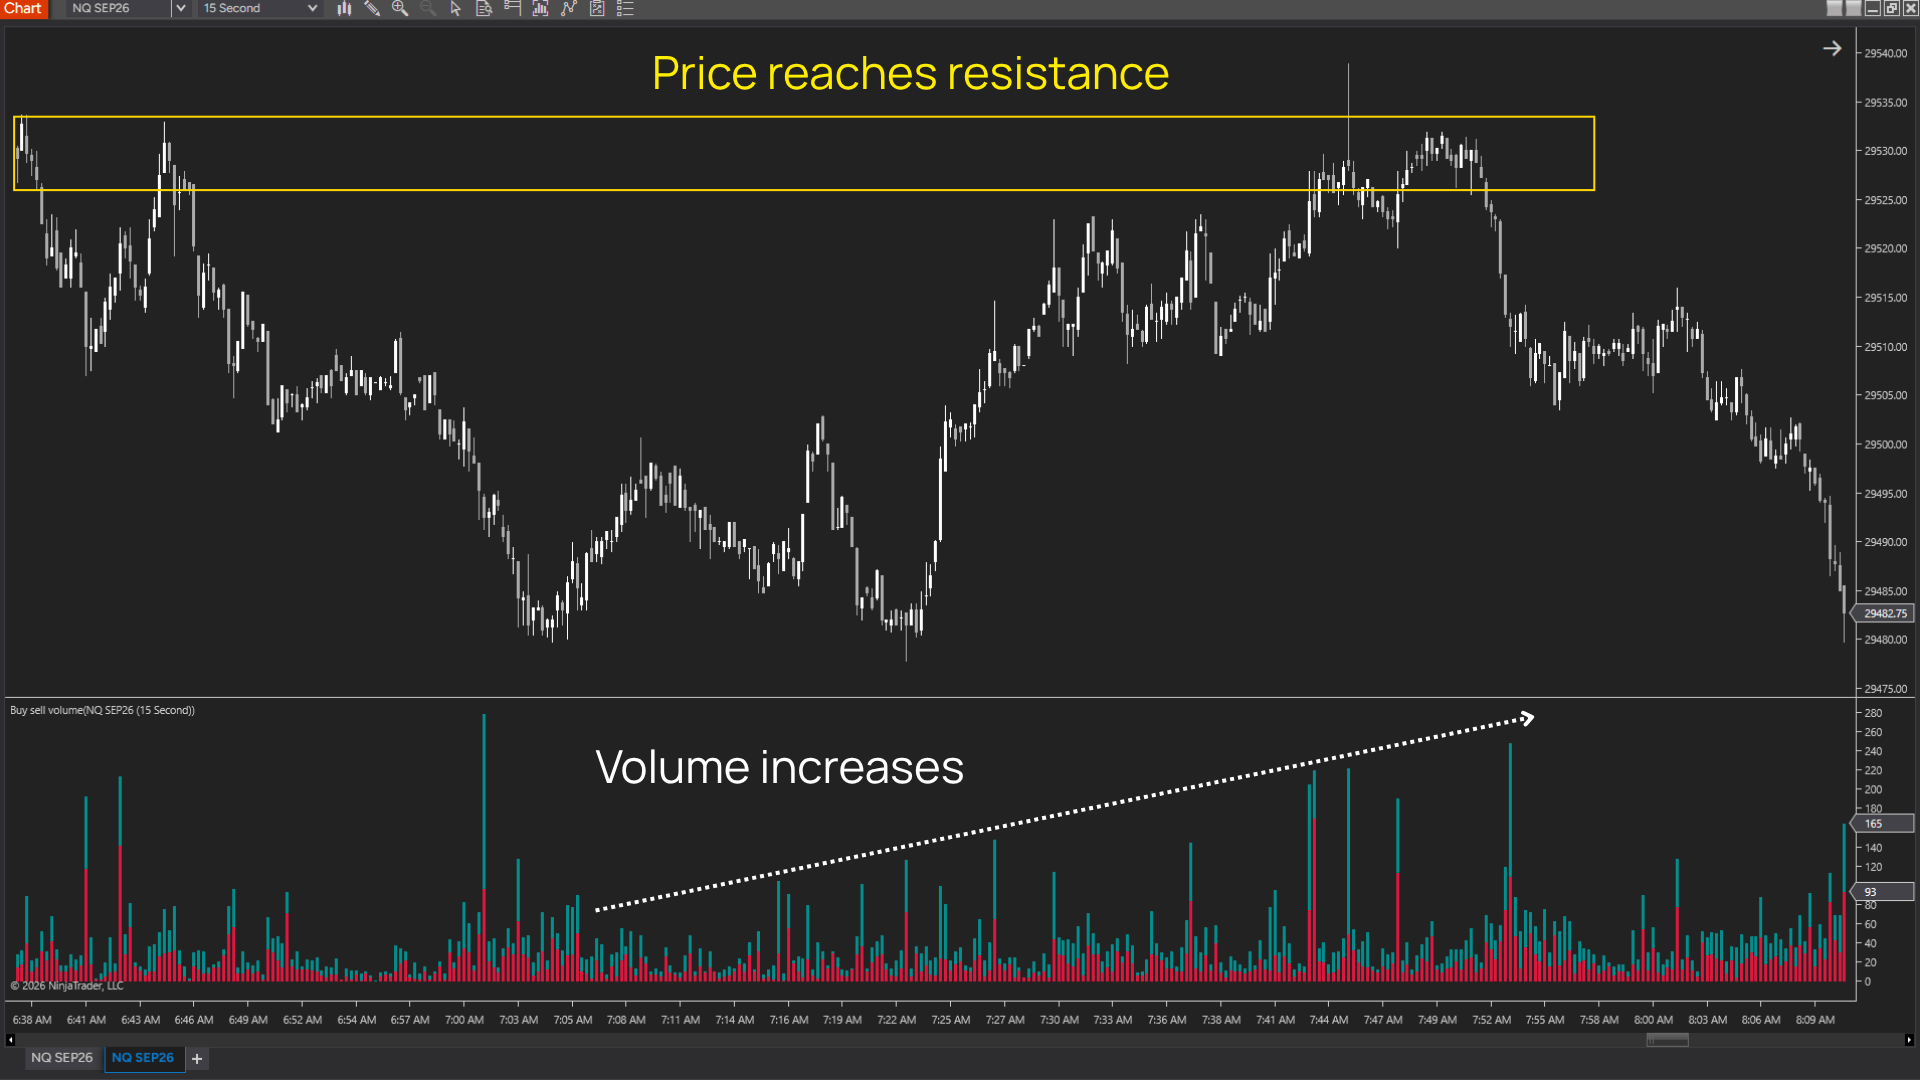
“Volume is increasing” is only the starting point. It tells you that market activity has picked up, but not what that activity means for the trade. To make volume useful, read it alongside price action and where price is trading.
Heavy volume at a resistance rejection tells a very different story from heavy volume behind a breakout through that same level.
You do not need to read everything to read volume well. This guide does not attempt to fit the entire order flow picture into one checklist. Footprint, market depth, and other microstructure data can provide deeper insight and can be explored separately.
Here, we focus on the information that matters most for the workflow: understanding the context, identifying the signal candle, and checking Delta around the entry.
3. Two questions to ask before taking a setup
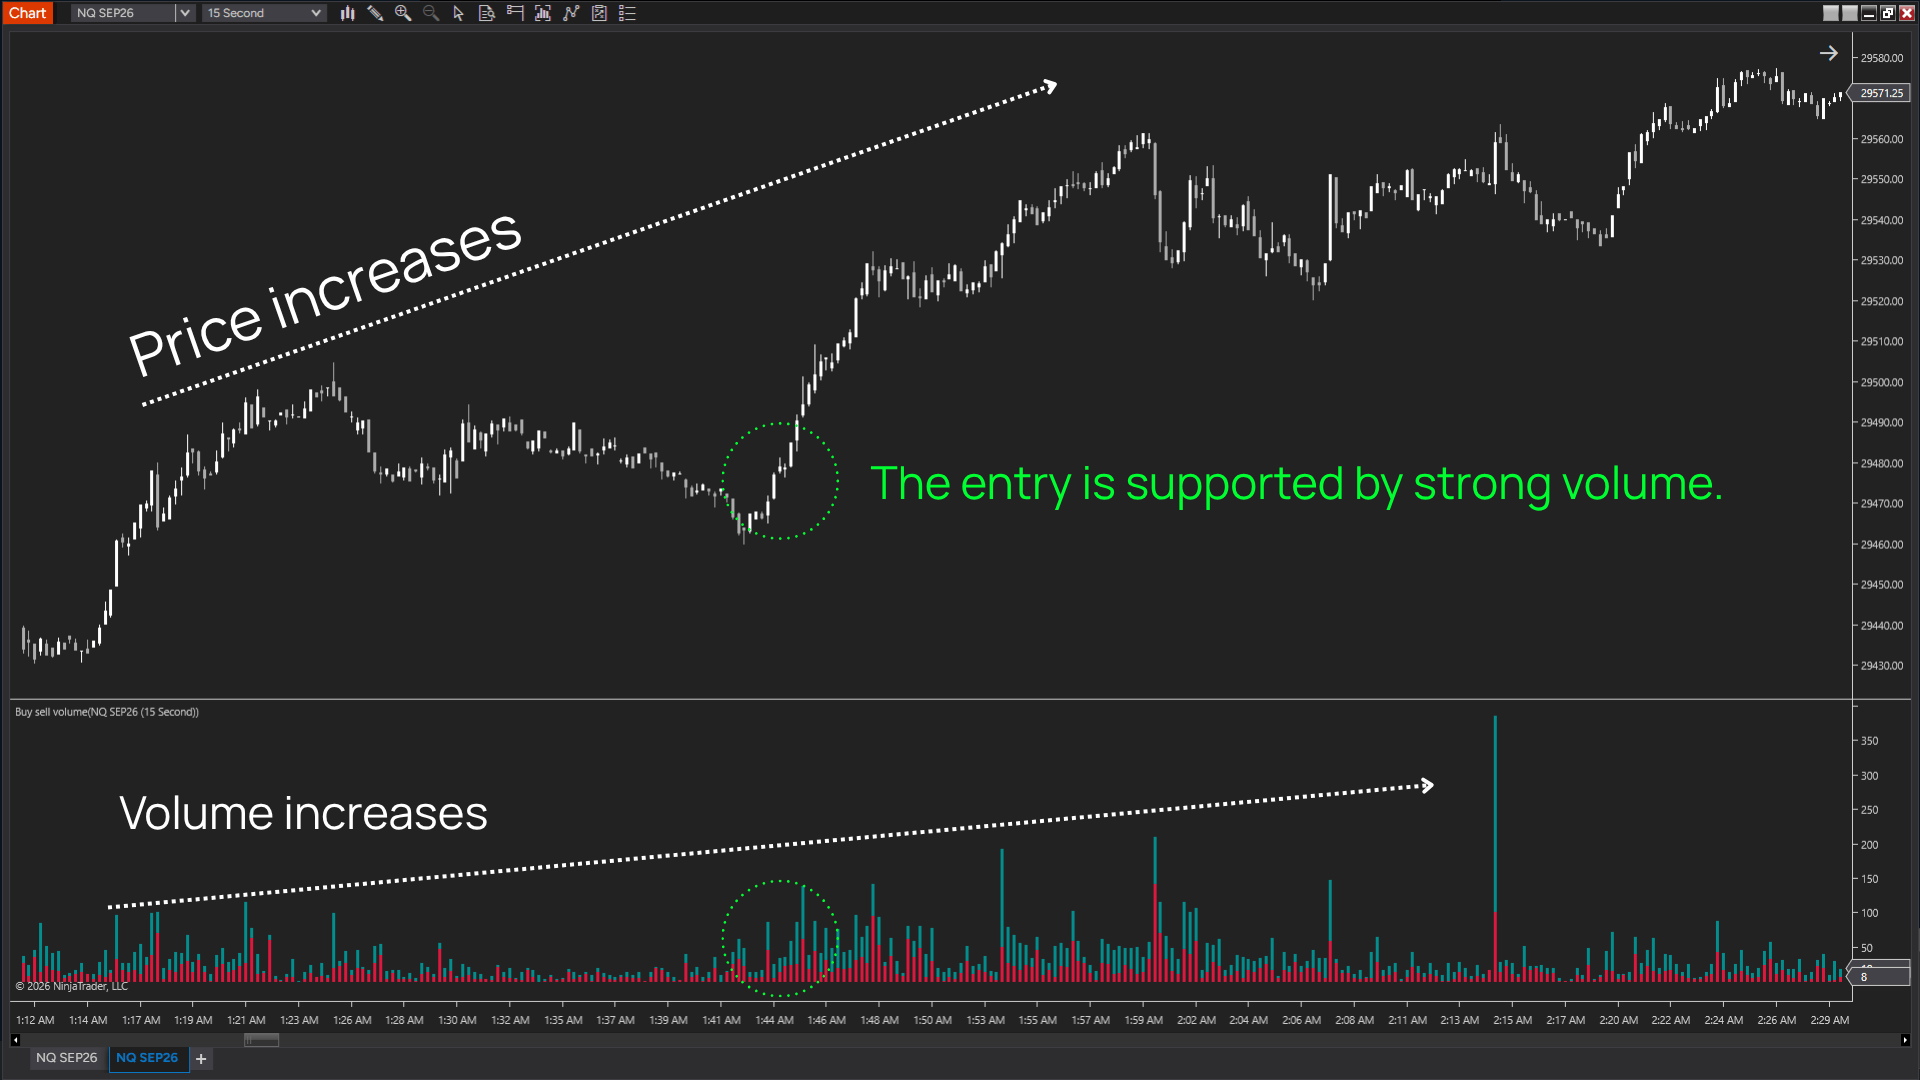
- Is volume supporting the move up or down?
- Is your entry actually positioned where that support matters?
These 2 questions form the foundation of the checklist in Chapter 4. Each indicator has a specific role in answering them, so you are not simply adding more indicators that end up measuring the same thing.
Why Volume Flow Scalping Solution works
The challenge in scalping is not simply figuring out whether price will go up or down. It is knowing which moves have real participation behind them — and are worth trading. A price signal can look perfect and still fail when there is not enough participation to support the move.
Volume Flow Scalping Solution approaches this through a simple sequence: Direction → Price Reaction → Participation
First, identify where volume is leaning. Then watch how price responds. Finally, check whether actual buying or selling pressure confirms the move.
This creates an important distinction between a move that appears on the chart and a move that is supported by the market behind it.
Rather than stacking indicators that measure the same information, the bundle focuses on the relationship between Direction, Price Reaction, & Participation.
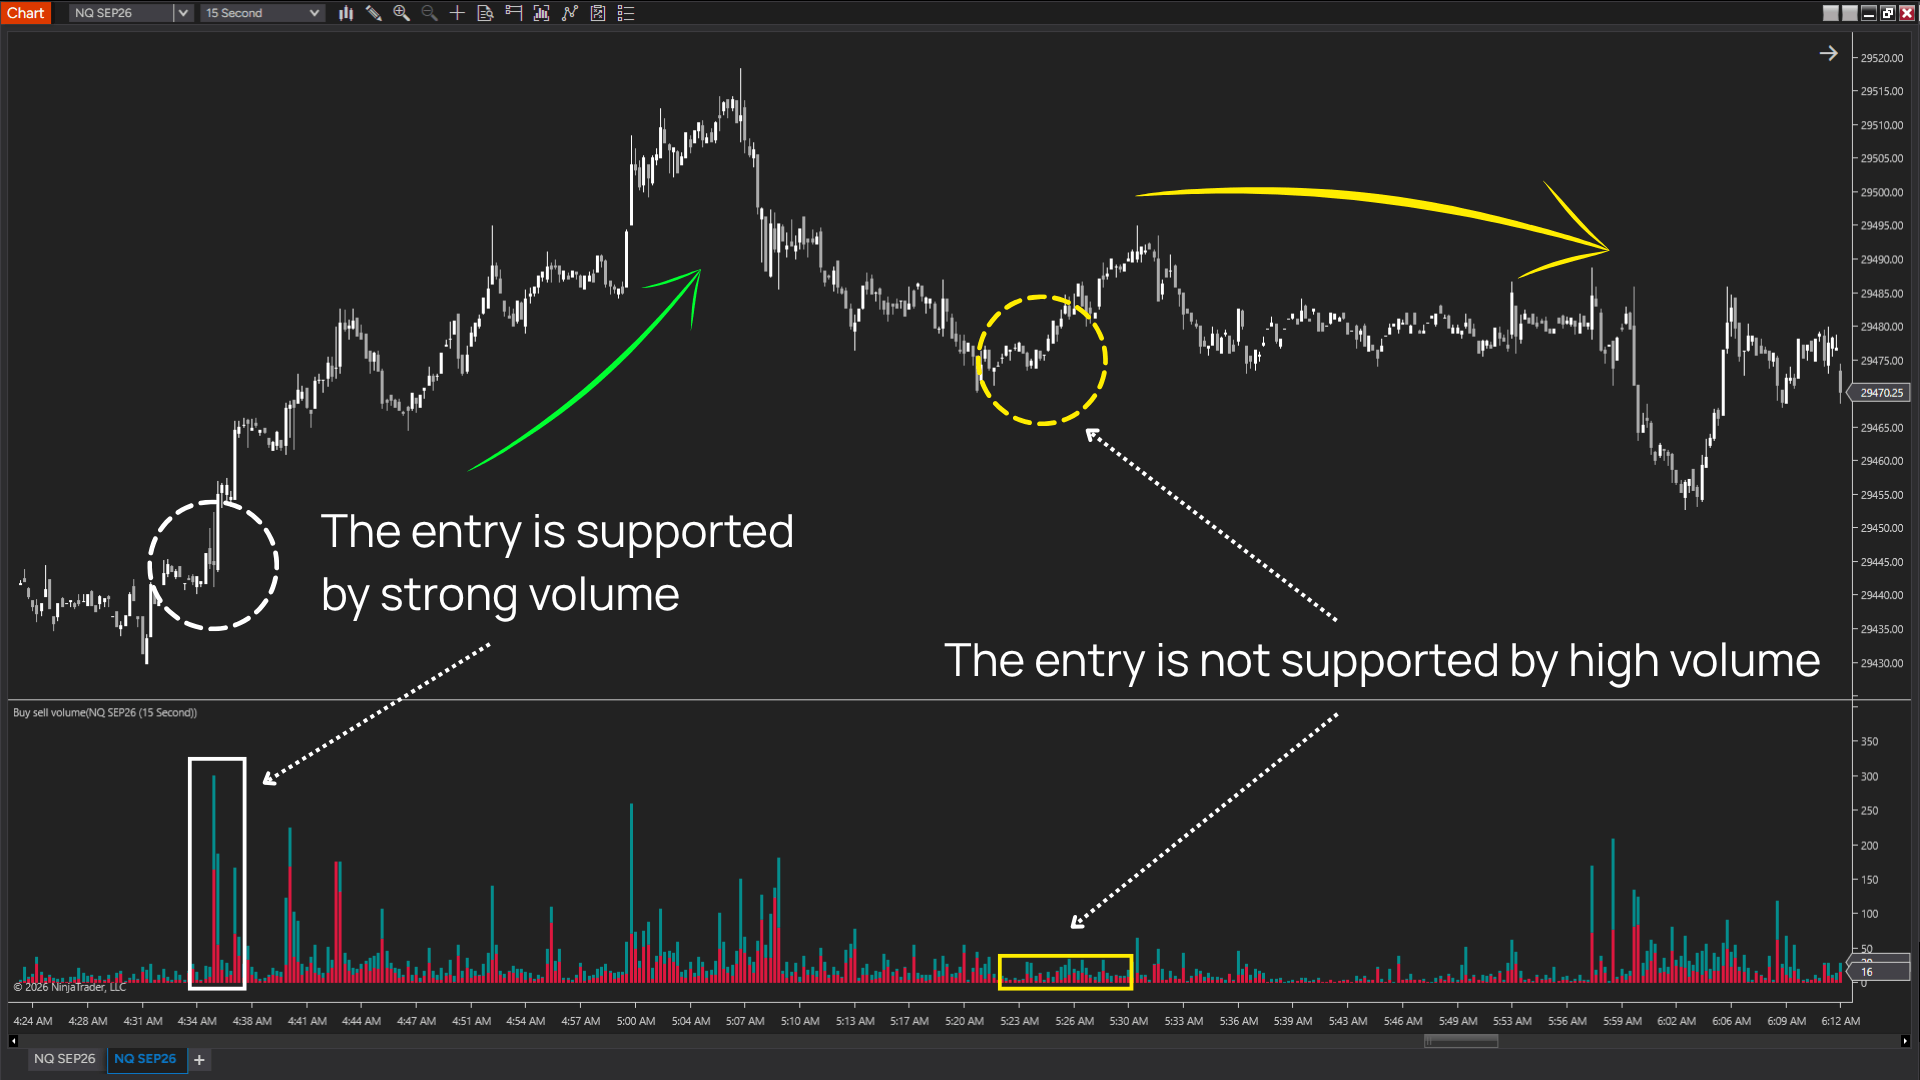
When all 3 align, you have a clearer basis for evaluating a trade. When they conflict, that conflict is information too — a reason to slow down or walk away. The goal of the bundle is not to create more signals. It is to help you filter for moves backed by a clearer flow of participation.
Continue reading → Chapter 3: Putting each component to work