
Chapter 3: Understanding the components of Precision OB/OS Solution
Traders rarely lack reversal signals. What they need is a way to recognize which signals appear after a price move that is truly worth paying attention to. That is the starting point of Precision OB/OS Solution.
Renko helps clarify the move leading up to a potential reversal; Superior Keltner identifies the initial reversal response; Momentum Pro checks whether momentum has shifted; and Superior RSI completes the Entry confirmation. Each component addresses a specific part of the process rather than simply adding another indicator to the chart.
3.1. Why Renko works for reversal trading
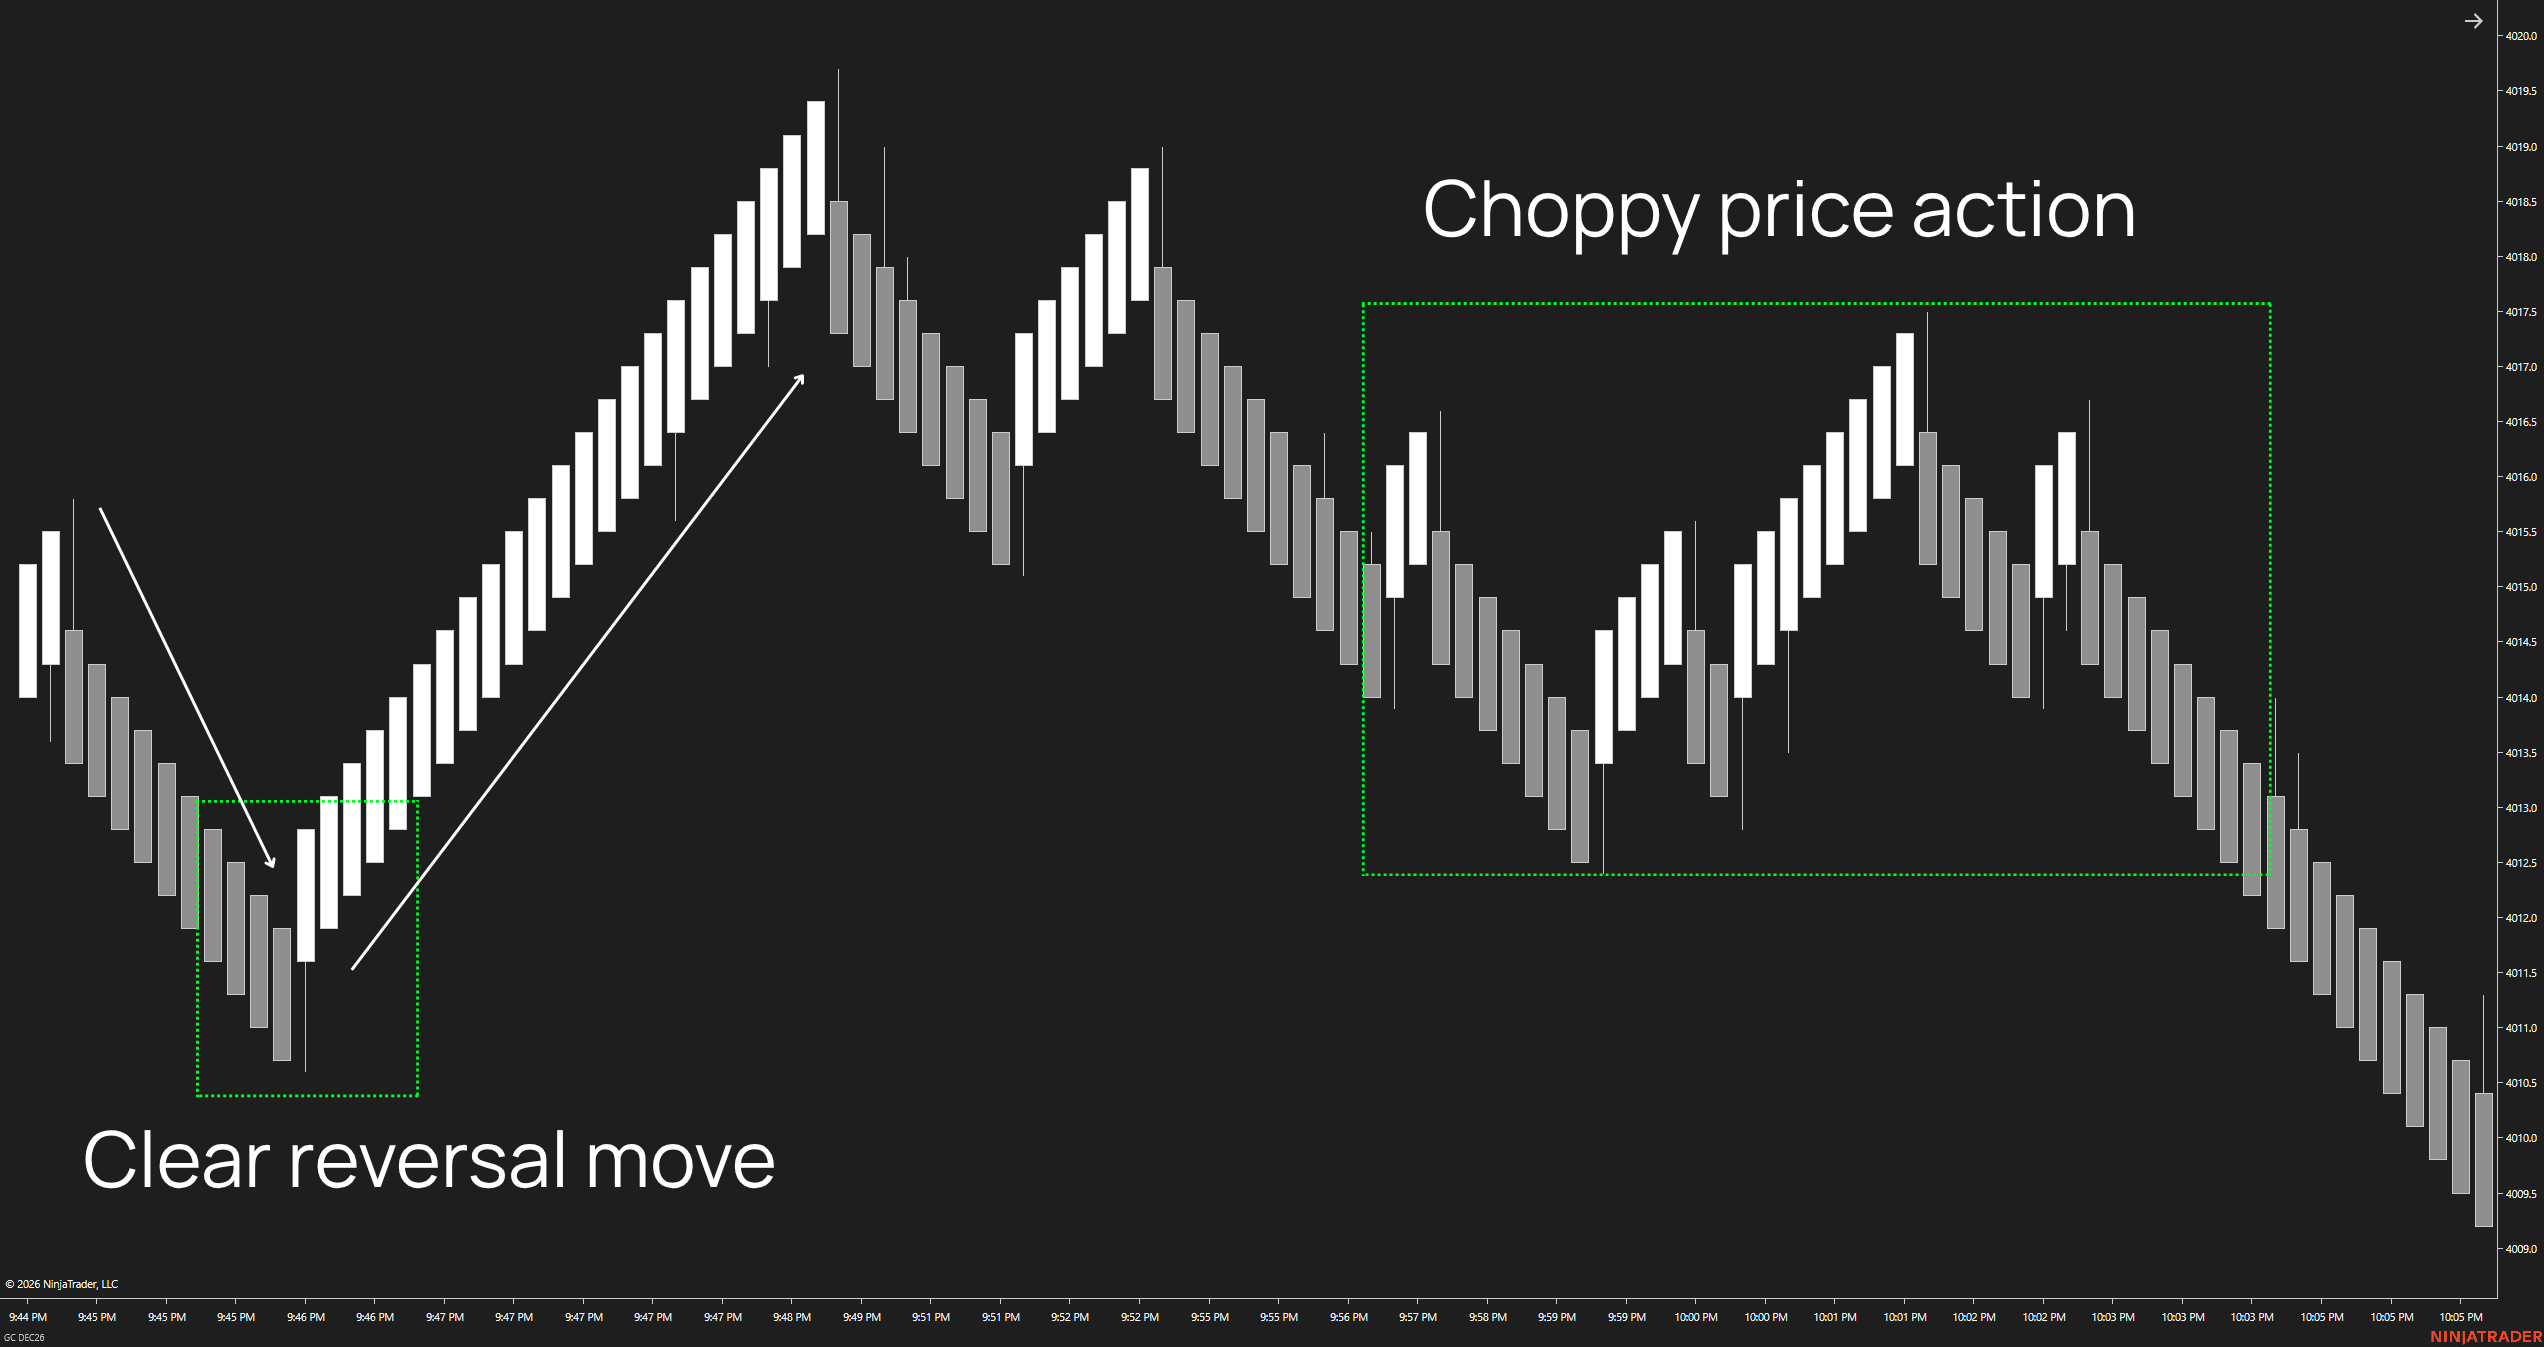
Imagine 2 scenarios. In one, price moves up and down within a narrow range, repeatedly forming bricks of alternating colors. In the other, price has made a clear move lower before showing signs of turning back up.
Both may produce reversal bricks, but the market context is different. If traders focus only on a single brick that has just changed direction, they can easily mistake minor fluctuations for a reversal opportunity worth trading. This is the first problem the solution is designed to address.
Renko helps make that distinction clearer. Unlike 1-minute or 5-minute candlesticks, which form over fixed time intervals, a Renko brick forms when price moves by a specified amount. Instead of focusing only on elapsed time, traders can observe consecutive bullish or bearish bricks to see how far price has moved directionally.
When the market moves sideways, repeated changes in direction are also easier to recognize. Renko does not tell us that price is about to reverse; it helps us read the price movement leading up to a potential reversal more clearly. [4]
This connects directly to the checklist. The solution only starts looking for opportunities when a sufficiently clear sequence of bullish or bearish Renko bricks aligns with the corresponding Keltner pattern and pushes Superior RSI toward Overbought or Oversold territory. Only then does the system look for a candle close beyond the Keltner band, followed by Momentum and RSI confirmation in the prescribed order.
Conversely, if price keeps moving within a balanced range and RSI never reaches OB/OS, Step 1 has not been met – even if the chart shows a few convincing color changes. This helps traders avoid forcing a trade every time price turns.
The chart examples use NQ DEC26 with ninZaRenko 20/3. This is the configuration used in the examples, not a setting that suits every market. And while Renko makes price movement easier to observe, it does not eliminate false signals or guarantee a higher win rate.
When Step 2 requires a candle to close beyond the Keltner band, traders must wait for the brick to complete. Entry quality and risk still need to be assessed as they would with any chart type. [8]
3.2. Superior Keltner – Where reversal signals begin
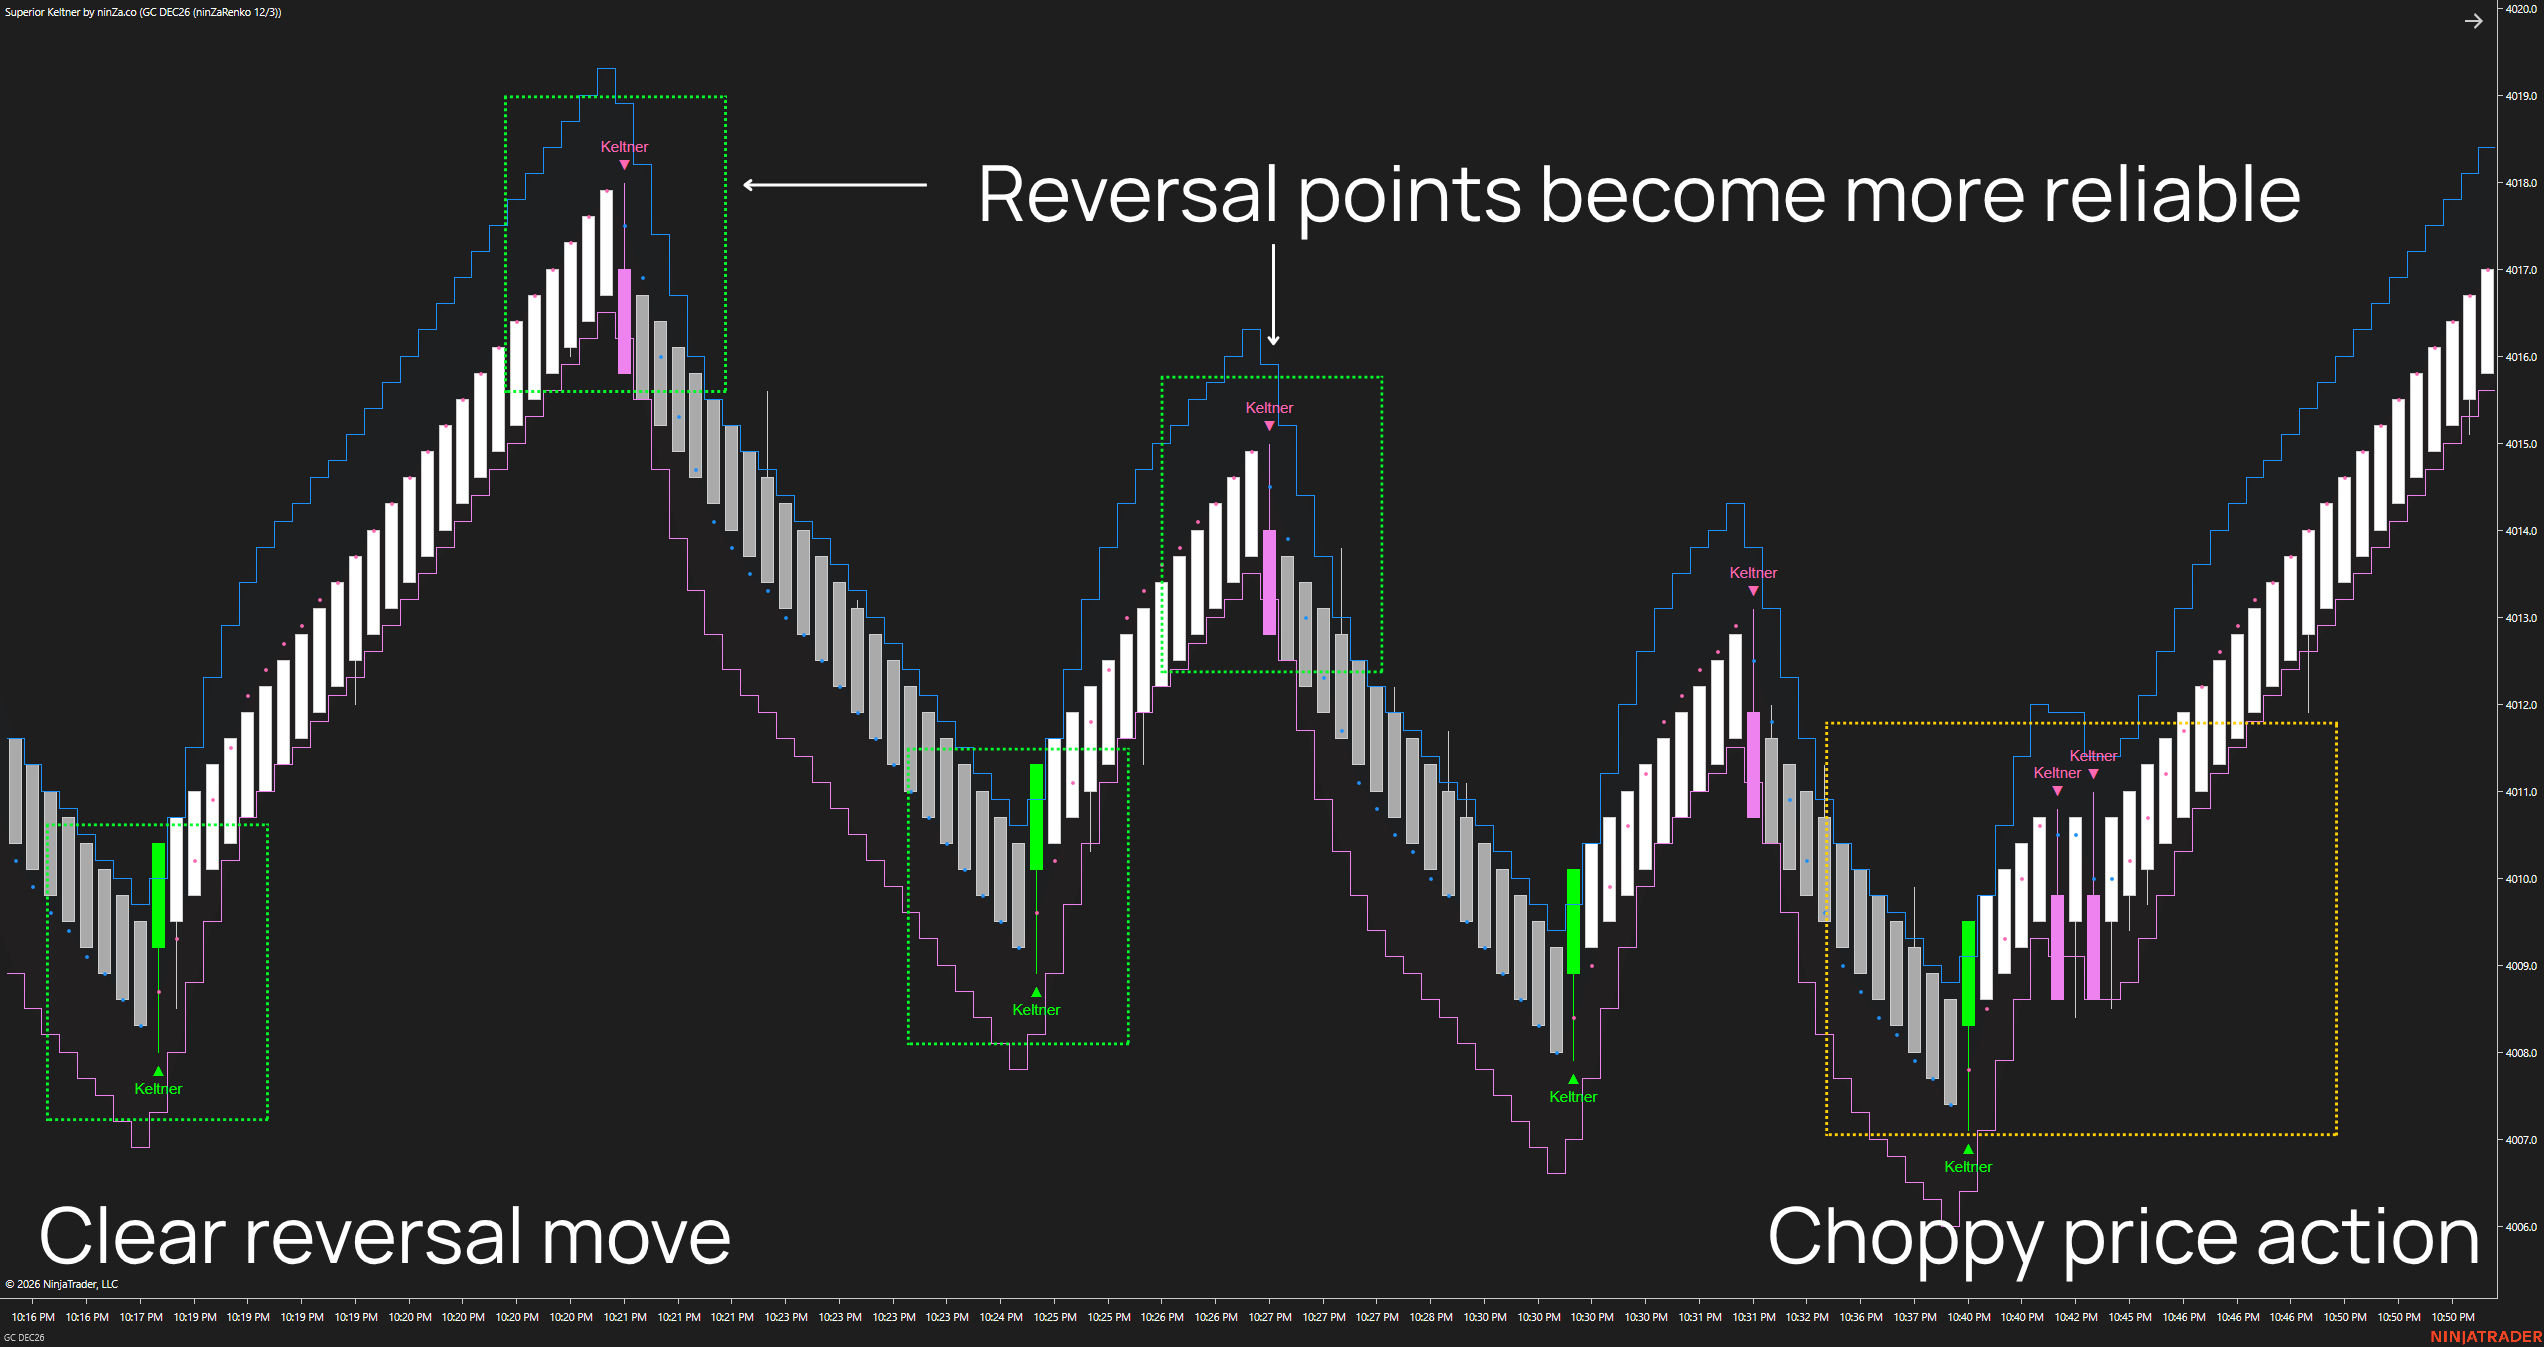
Superior Keltner plots a price channel with a middle line and upper and lower bands. Traders can customize how the middle line is calculated and how far the bands extend from it. The indicator also supports identifying when price moves beyond a band.
However, when using this solution, you do not need to memorize every setting option from the start. What matters is understanding how the two bands behave during a strong price move and where a brick closes relative to the bands when the market begins to turn. [2]
During a clear down move, the Lower Band slopes downward with price, while the Upper Band tracks closely along the bearish bricks. During an up move, the relationship is reversed: the Upper Band slopes upward, while the Lower Band tracks closely along the bullish bricks.
This pattern reflects a market moving with a sufficiently clear directional bias, rather than the bands expanding outward on both sides, as traders often observe with VWAP Bands. Understanding this distinction is essential to recognizing when market conditions are suitable for watching for a reversal.
3.3. Momentum Pro – Checking whether momentum has shifted
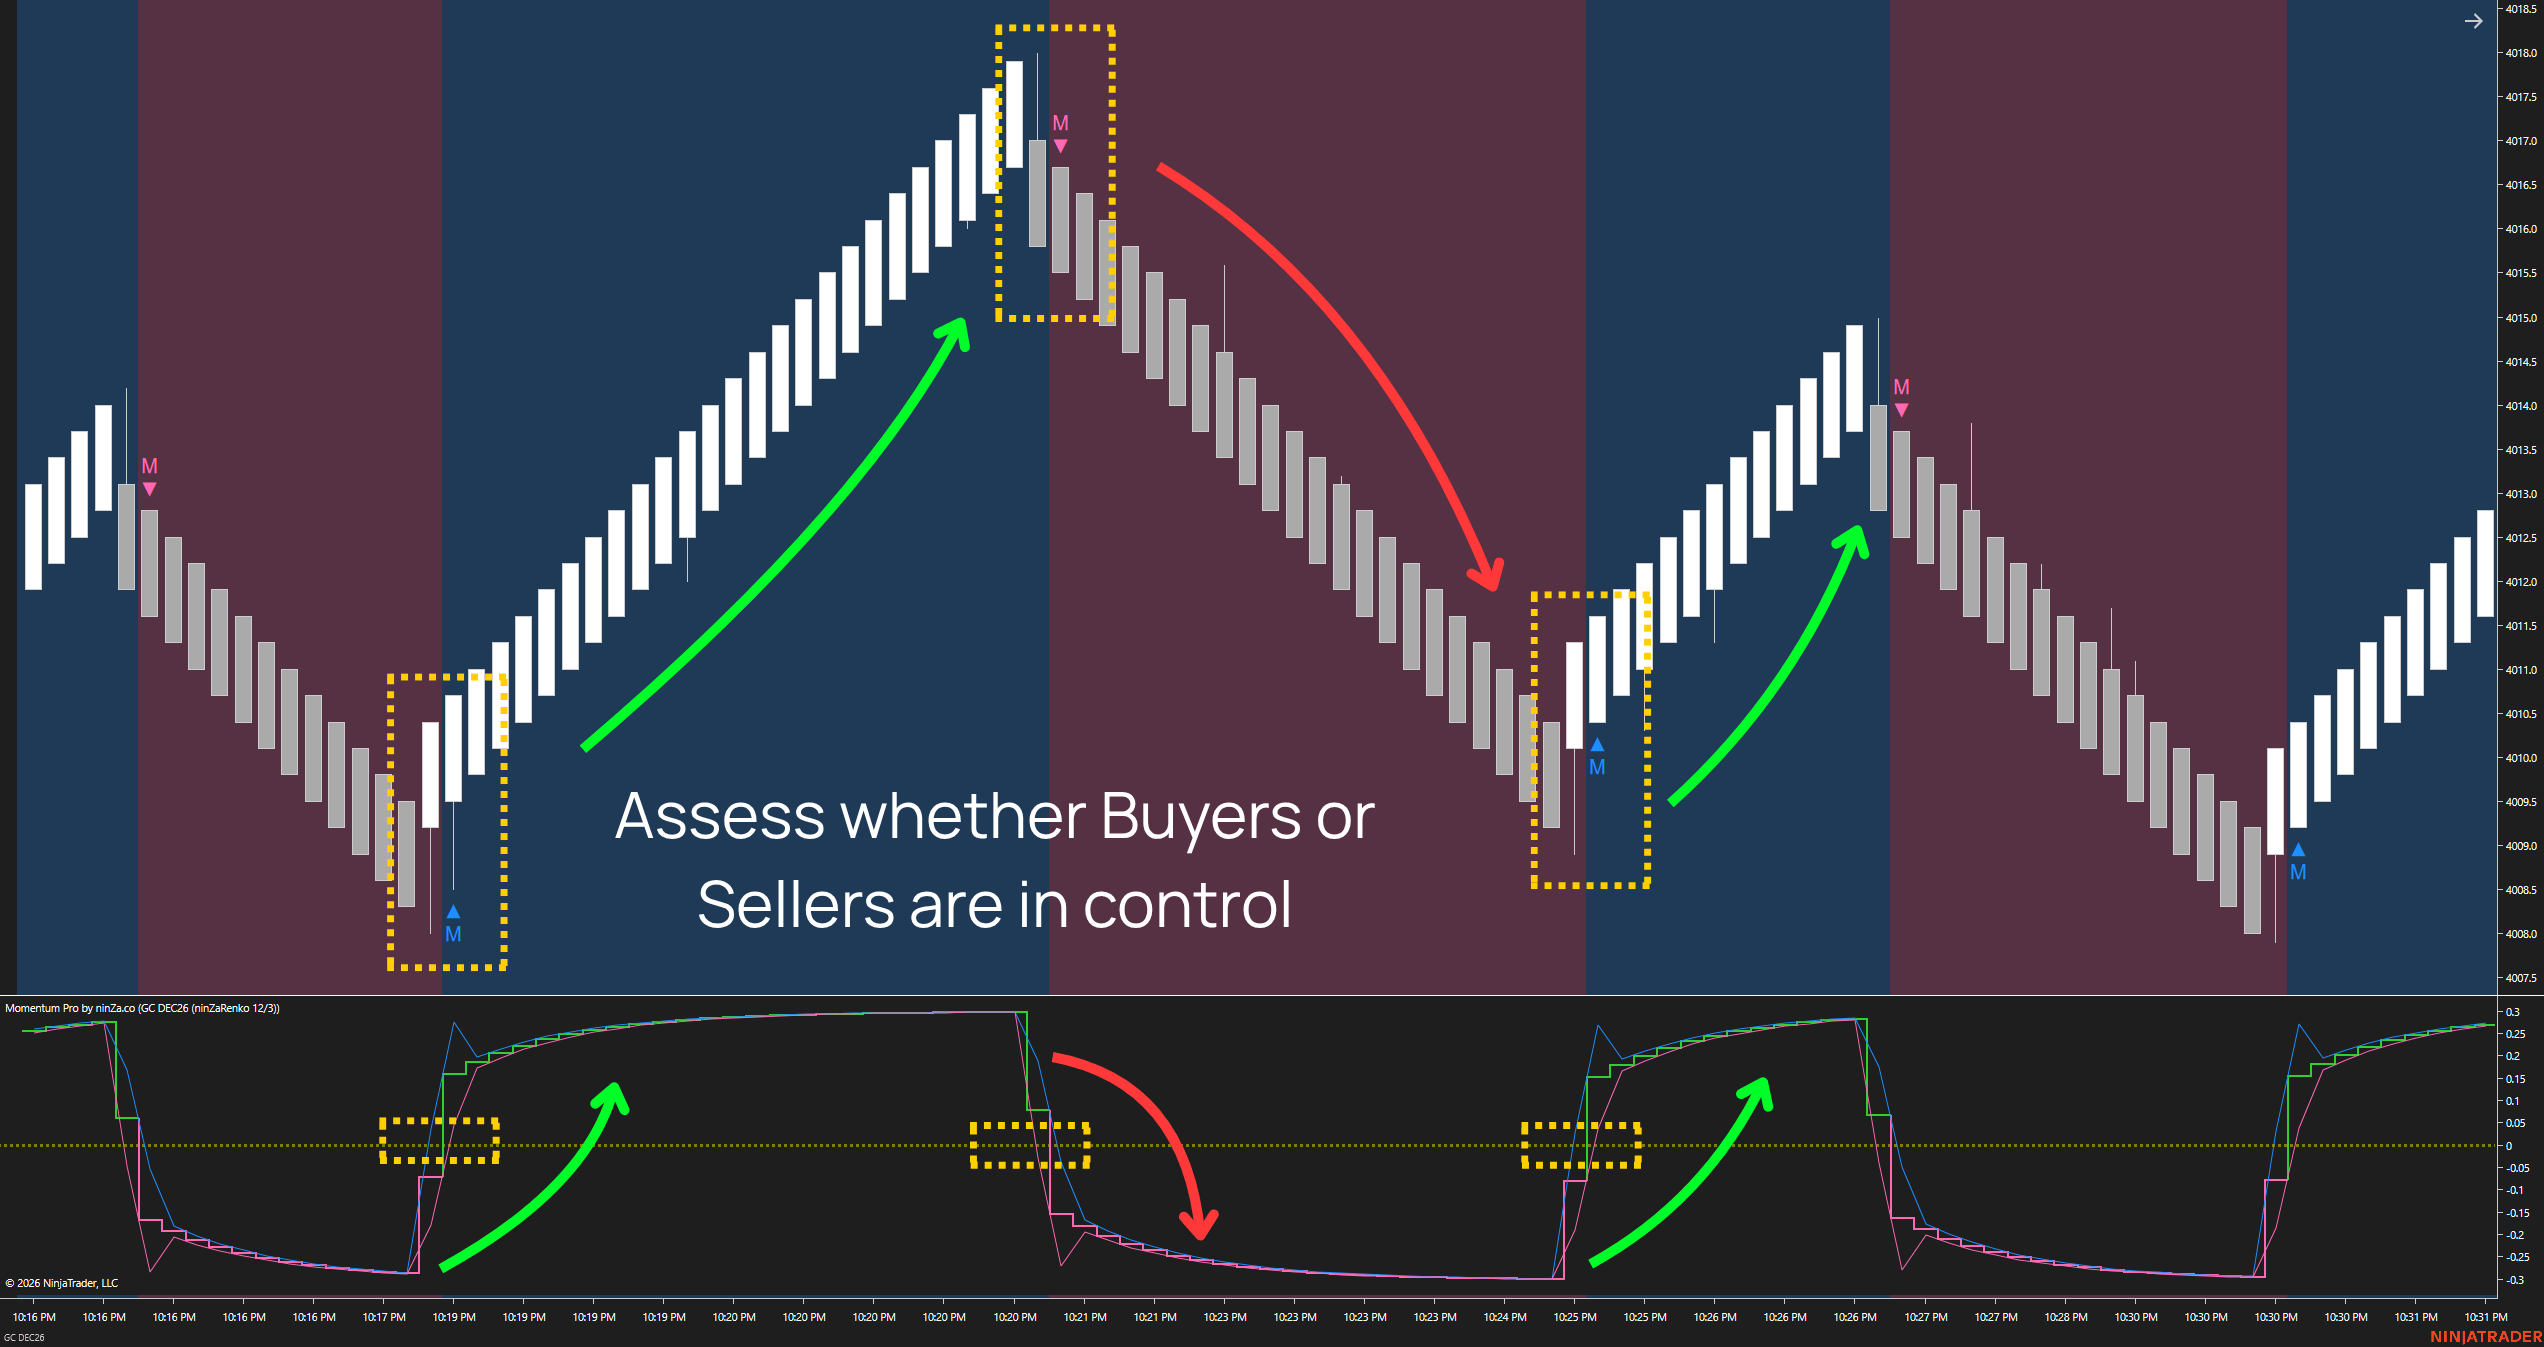
Momentum Pro displays a Momentum Plot along with Upper Bound and Lower Bound lines. Each serves a distinct role in how the indicator evaluates momentum and trend conditions.
In the solution, Step 3 uses only the Momentum Plot–the momentum line in the lower panel – to check whether momentum has crossed the zero line. Do not confuse this condition with signals from the two Bound lines or use them as substitutes for it. [3]
3.4. Superior RSI – Confirming the direction of price
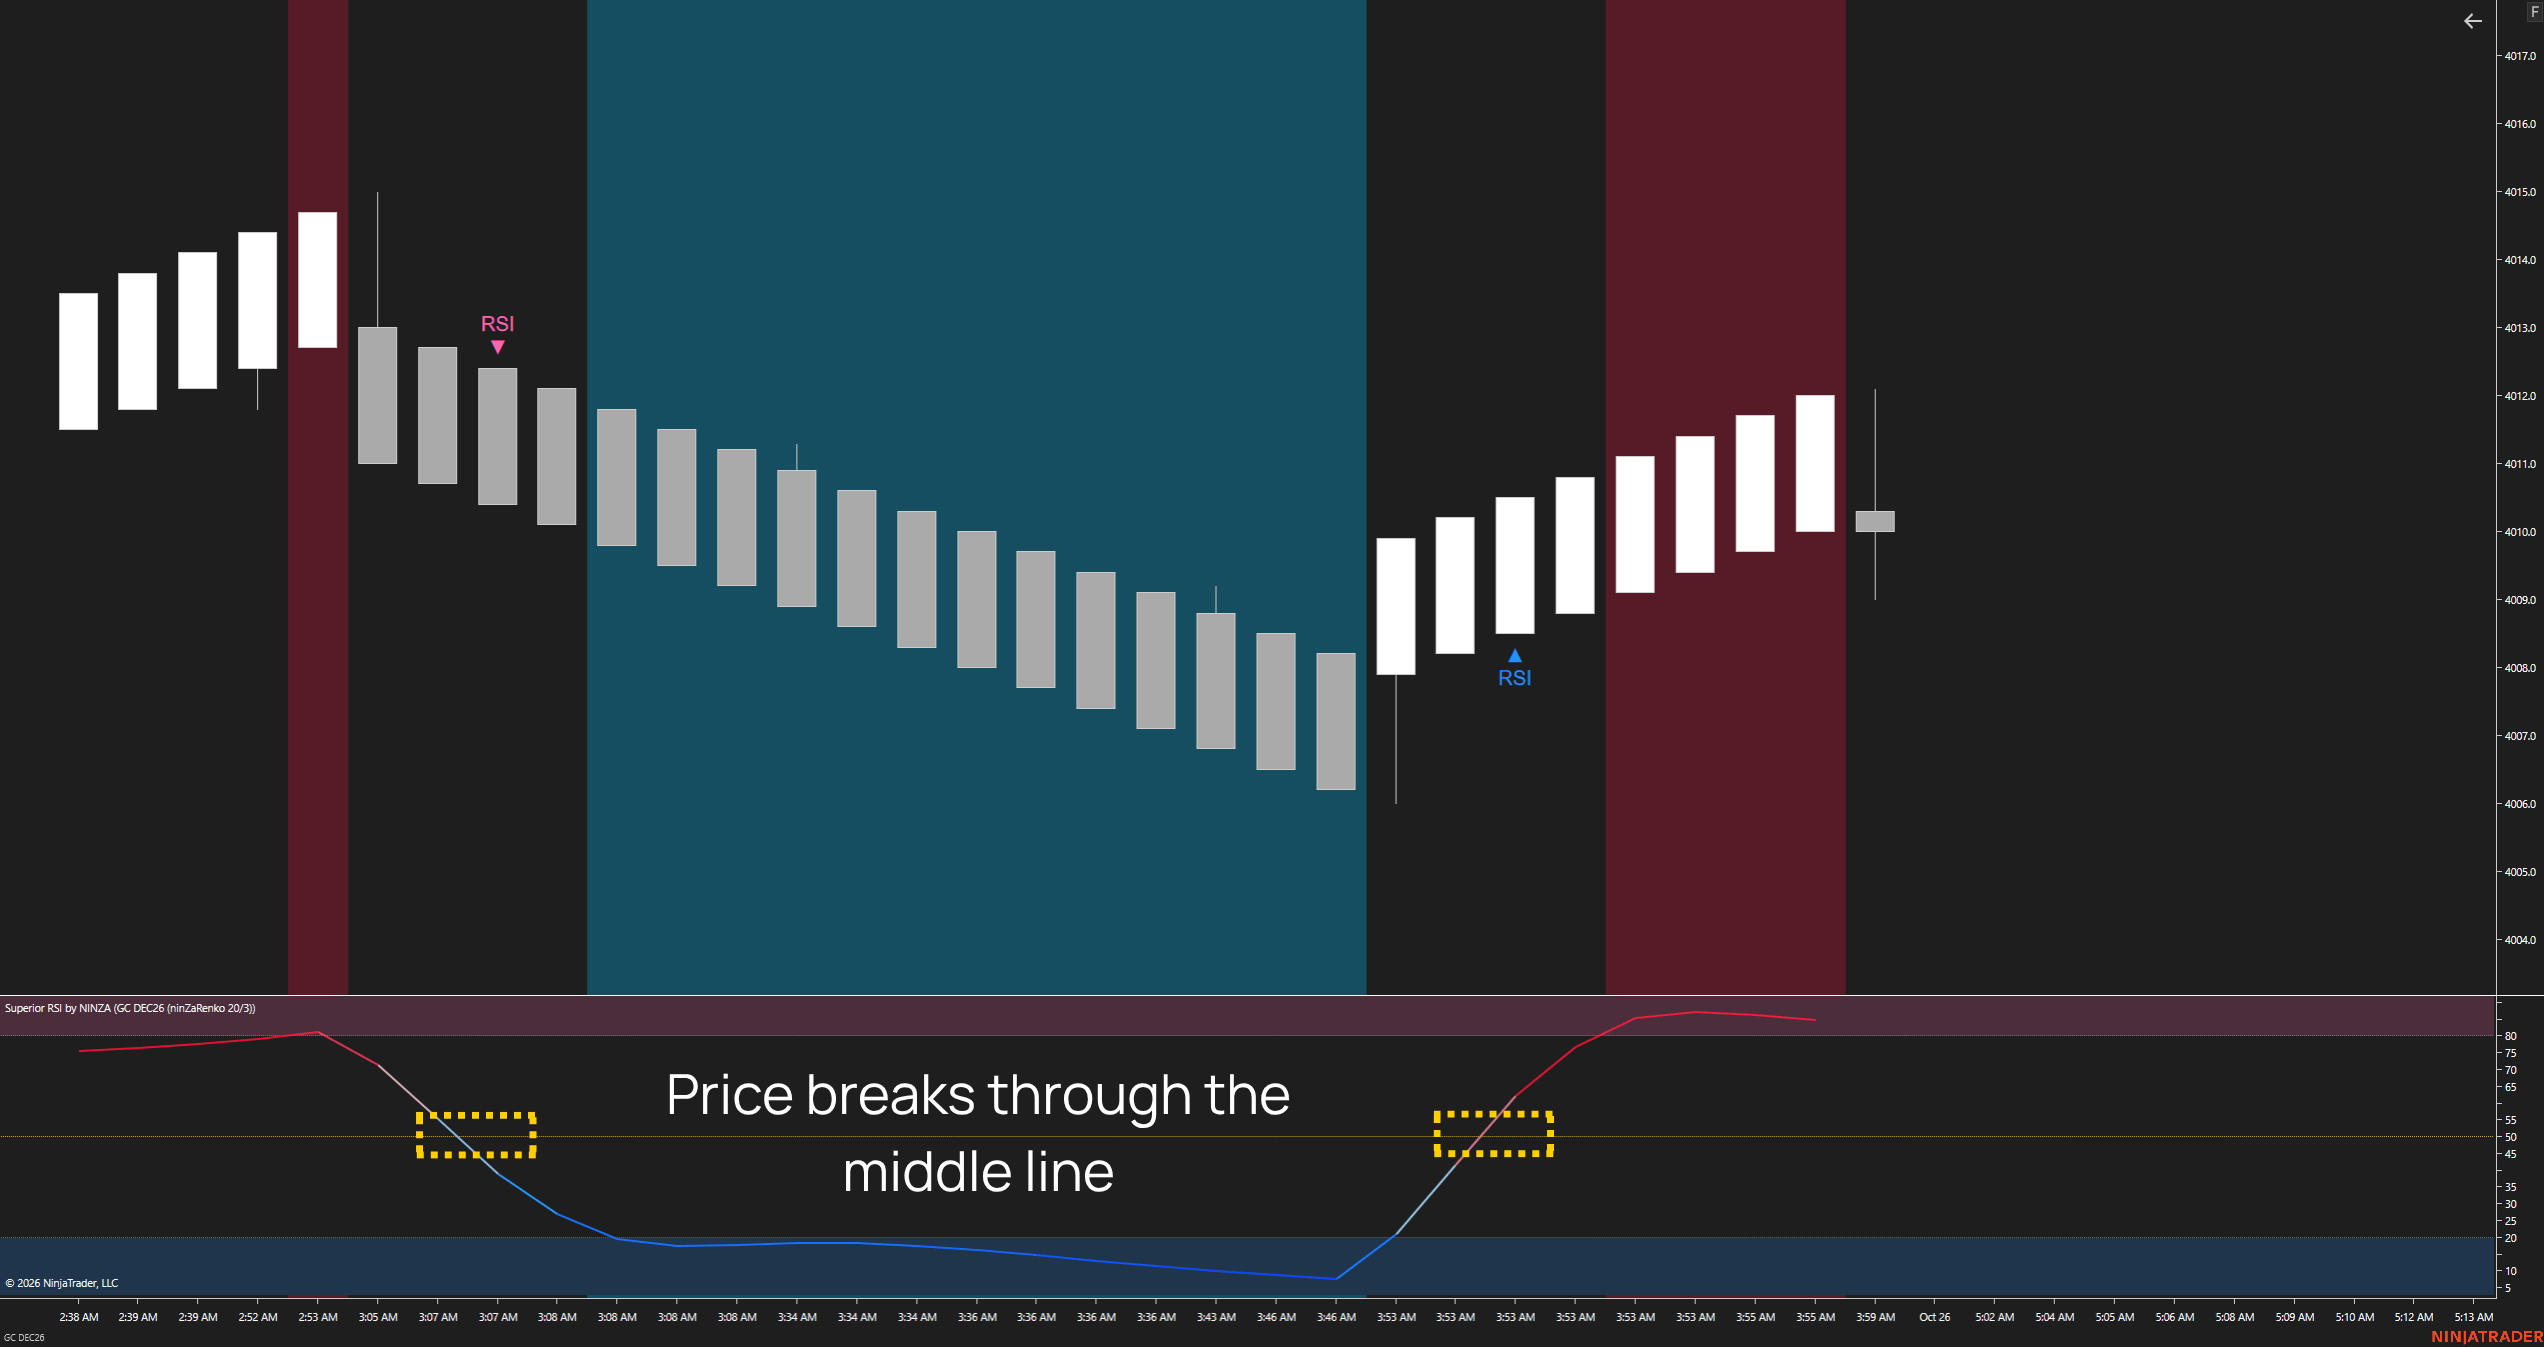
Superior RSI allows traders to monitor Overbought and Oversold territory, as well as the 50 midline. The indicator includes smoothing and signal alert options, but its most important role in this Solution lies in 2 moments: when RSI enters extreme territory and when it crosses back through the midline. These two events serve entirely different purposes. [1]
At the beginning of a setup, RSI entering OS or OB tells us when to start watching for a potential reversal. Later in the setup, RSI crossing the 50 level in the reversal direction becomes the condition that confirms Entry.
For a Buy, RSI must move from OS to above 50; for a Sell, it must move from OB to below 50. If RSI has already crossed 50 before the Keltner and Momentum steps are completed, that earlier signal cannot be reused as confirmation for a new setup. The sequence always matters more than simply seeing all three indicators point in the same direction.
3.5. How the 4 components work together
| Component | What it helps you assess | What to keep in mind |
|---|---|---|
| Renko | Helps identify when the market has made a sufficiently clear move up or down, while making the initial reactions to a potential change in direction easier to observe. | A single brick changing color is not enough to conclude that a new trend has begun. |
| Superior Keltner | Shows when opposing buying or selling pressure is strong enough to push price beyond its previous range of movement. This is the first sign that the current trend may be under pressure. | The initial signal is not yet an Entry condition. |
| Momentum Pro | Helps assess whether the emerging buying or selling pressure is actually gaining strength, rather than producing only a brief price bounce that quickly fades. | A shift in momentum does not guarantee that the Entry still offers a favorable opportunity. |
| Superior RSI | Shows when the balance of momentum is shifting more clearly toward buyers or sellers, strengthening the case that the market may be moving in a new direction. | Even when all checklist conditions are met, Stop and Target placement still need to be assessed. |
Continue reading →