
Chapter 4: Trade management & Advanced trading tips
Even a solid entry checklist can be undermined by an incorrectly structured Stop Loss or Take Profit approach. This chapter examines in detail how to manage trades for each setup.
1. Stop Loss / Take Profit for setup 1
Rationale for a small R:R ratio (1:1 or 1.1–1.5:1): Since this setup prioritizes a high signal frequency, using relatively small Stop Loss and Take Profit levels is not a limitation, but an inevitable result of its design philosophy.
With a high trading frequency, achieving a positive expected return does not require a large risk-to-reward ratio. It only requires a stable win rate above 50% – although, in practice, the win rate needs to be slightly higher than 50% to offset trading fees and spreads.
Attempting to extend the Take Profit target in a setup designed for short price movements will reduce the actual win rate. The farther price has to travel, the more opportunities there are for entropy to increase again – meaning the market returns to a more chaotic state – before the Take Profit level is reached.
Tip 1 – Set Stop Loss and Take Profit based on the Renko ratio
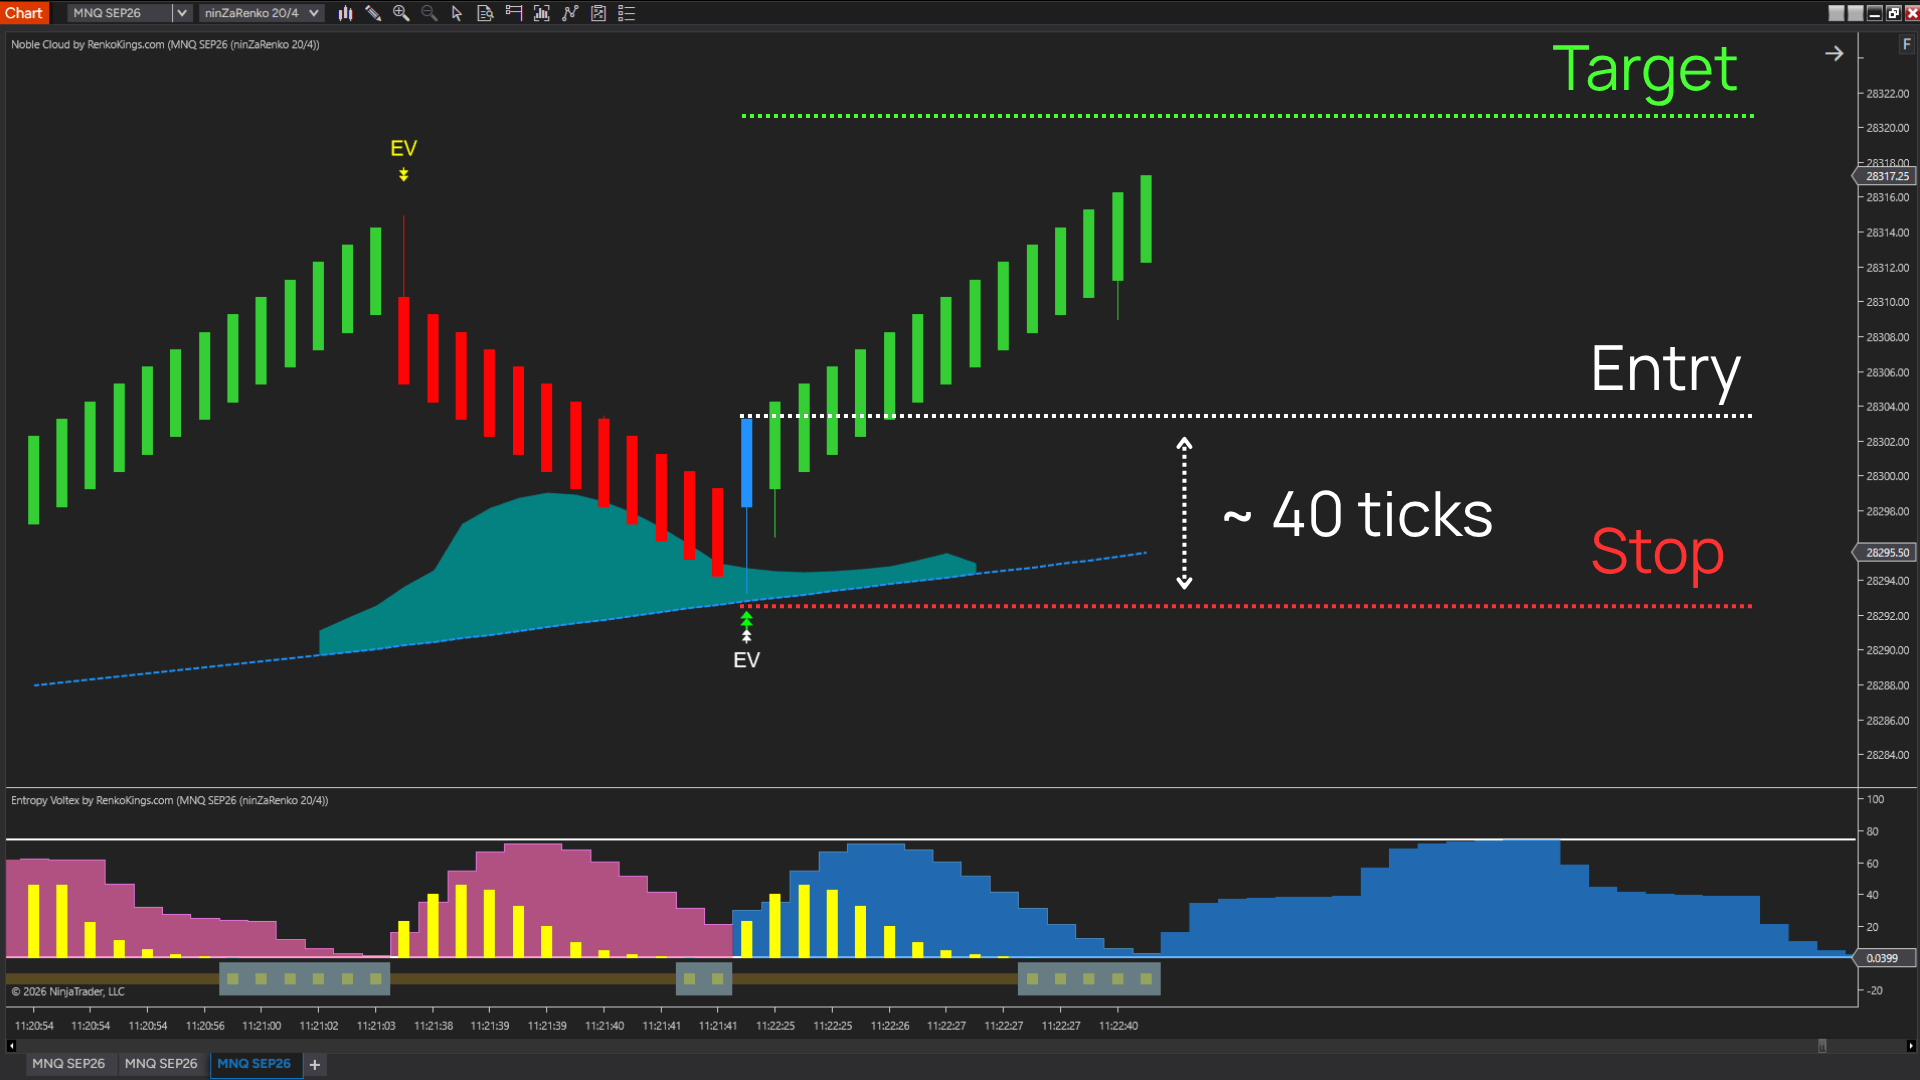
When using a 20/4 Renko configuration, set the Stop Loss at Brick Size × 2 (approximately 40 ticks), or within a range around that level. Set the Take Profit approximately ±5 ticks above or below the Stop Loss.
The reason for using brick size as the unit of measurement, rather than an arbitrarily fixed number of ticks, is that brick size already reflects the market’s recent average volatility. Therefore, setting the Stop Loss in proportion to the brick size allows it to automatically expand or contract according to the current volatility of that specific timeframe, instead of relying on a fixed value that may be too wide in a quiet market or too narrow in a highly volatile market.
Tip 2 – Place the Stop Loss at the signal candle
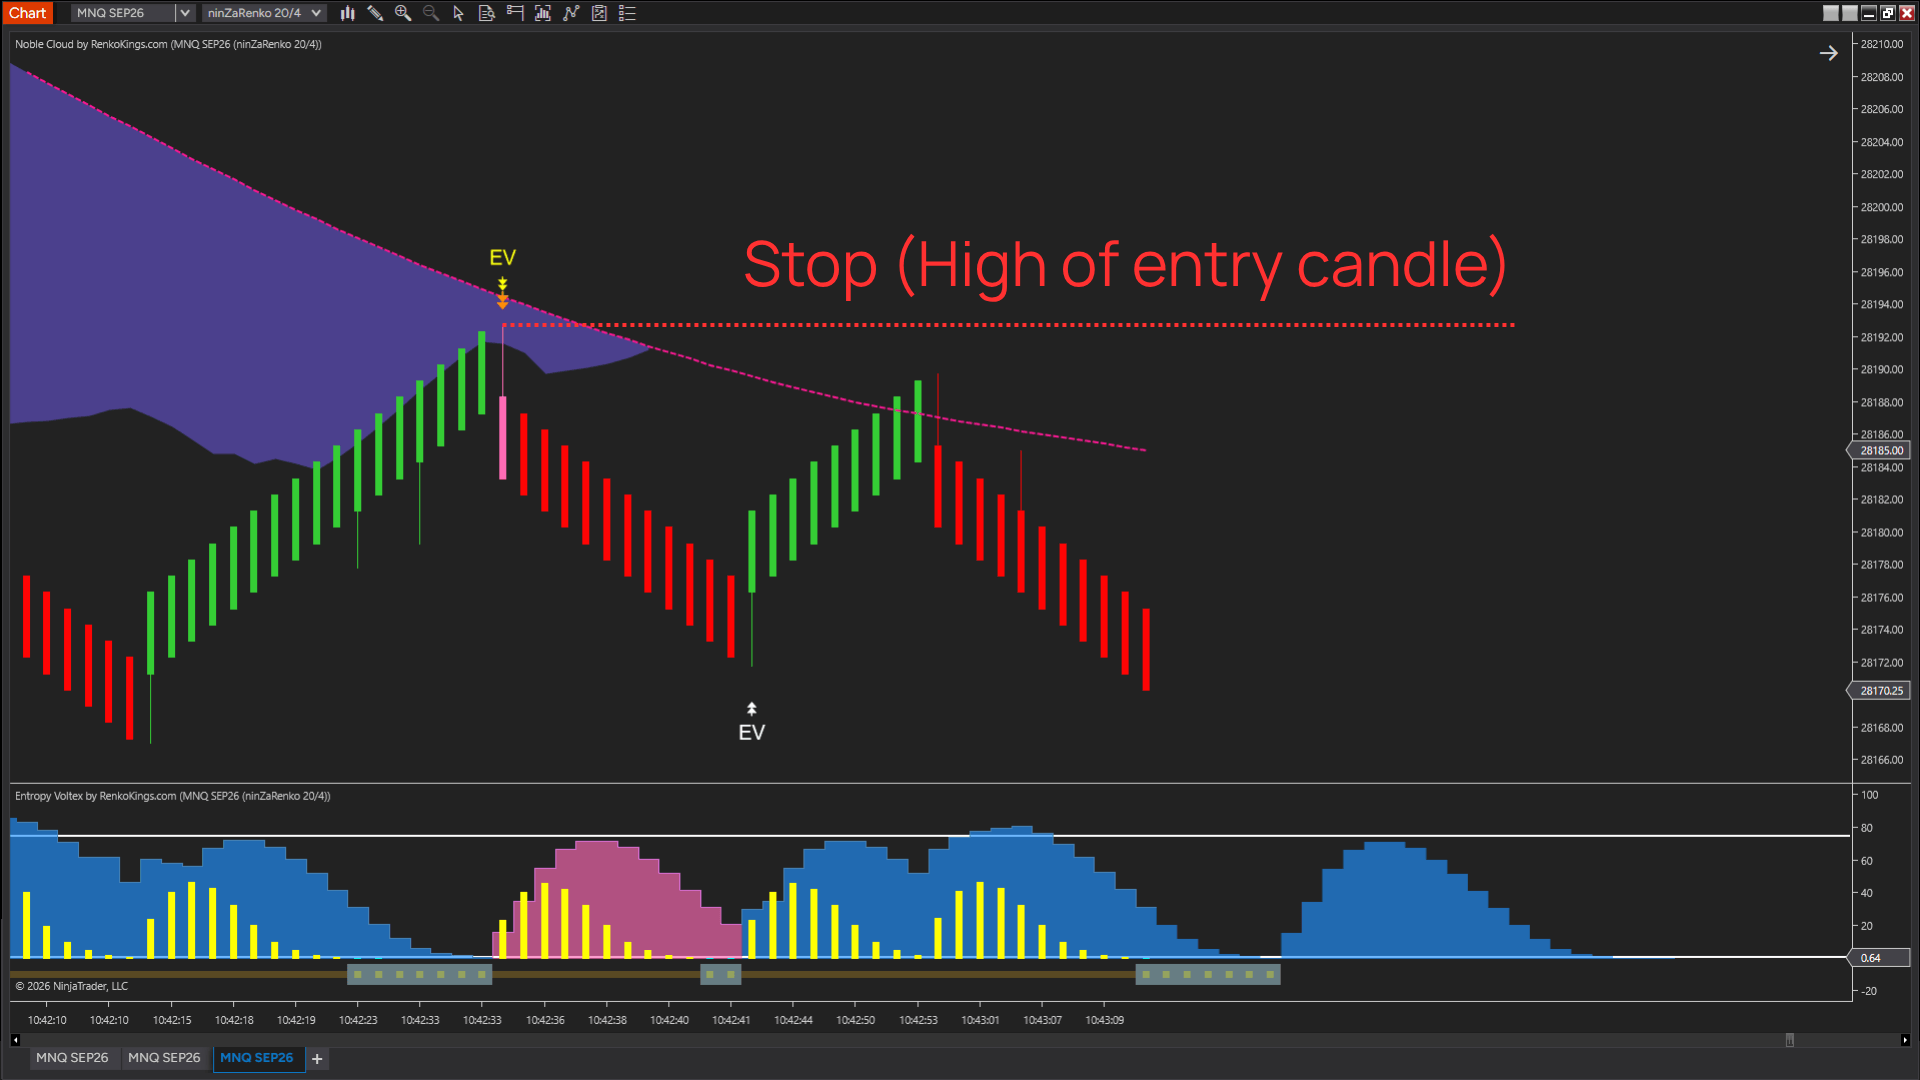
The signal candle is the most reliable reference point for the entry decision, as it appears only after a series of strict conditions have been satisfied. However, the market always has its own logic, and no probability is absolute.
Once the signal candle is breached, it means that the setup structure has been completely invalidated and the initial assessment was incorrect. At that point, stubbornly holding on to a losing position will only lead to uncontrollable risk. The correct decision is to immediately accept the situation, cut the loss to protect your capital, and then calmly wait for the next opportunity.
Tip 3 – Gradually reduce the Reward Target / Position size for consecutive trades within the same session
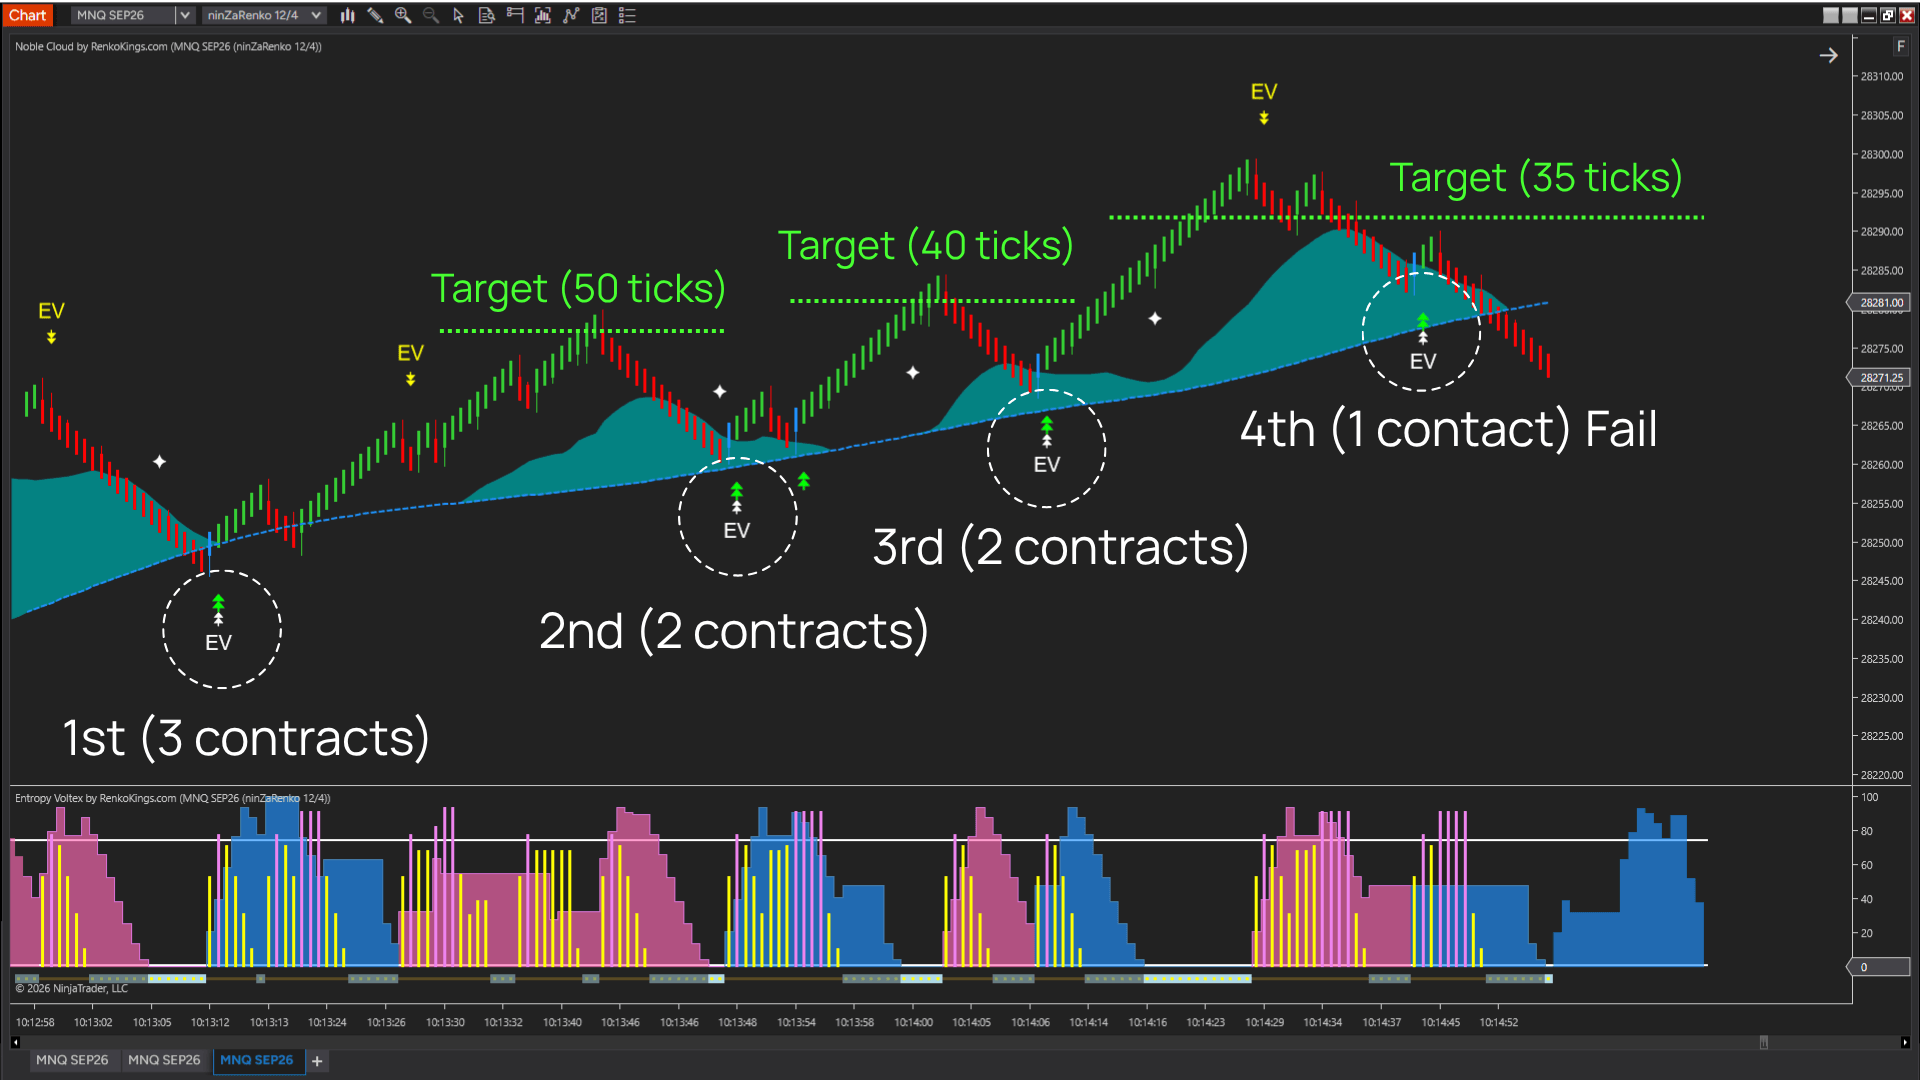
Because Setup 1 generates multiple signals within the same trend leg, signals that appear later in that move tend to become progressively less reliable. Each time entropy decreases and then rises again (a phase-transition cycle), it consumes part of the trend’s “energy”, just as a trend cannot undergo an unlimited number of phase transitions without weakening.
Gradually reducing the position size for the second and third trades, or progressively lowering the profit target, is a risk-management approach that reflects this decline in reliability over time.
Tip 4 – Move the Stop Loss to breakeven early once price has covered 60–70% of the distance to the Take Profit
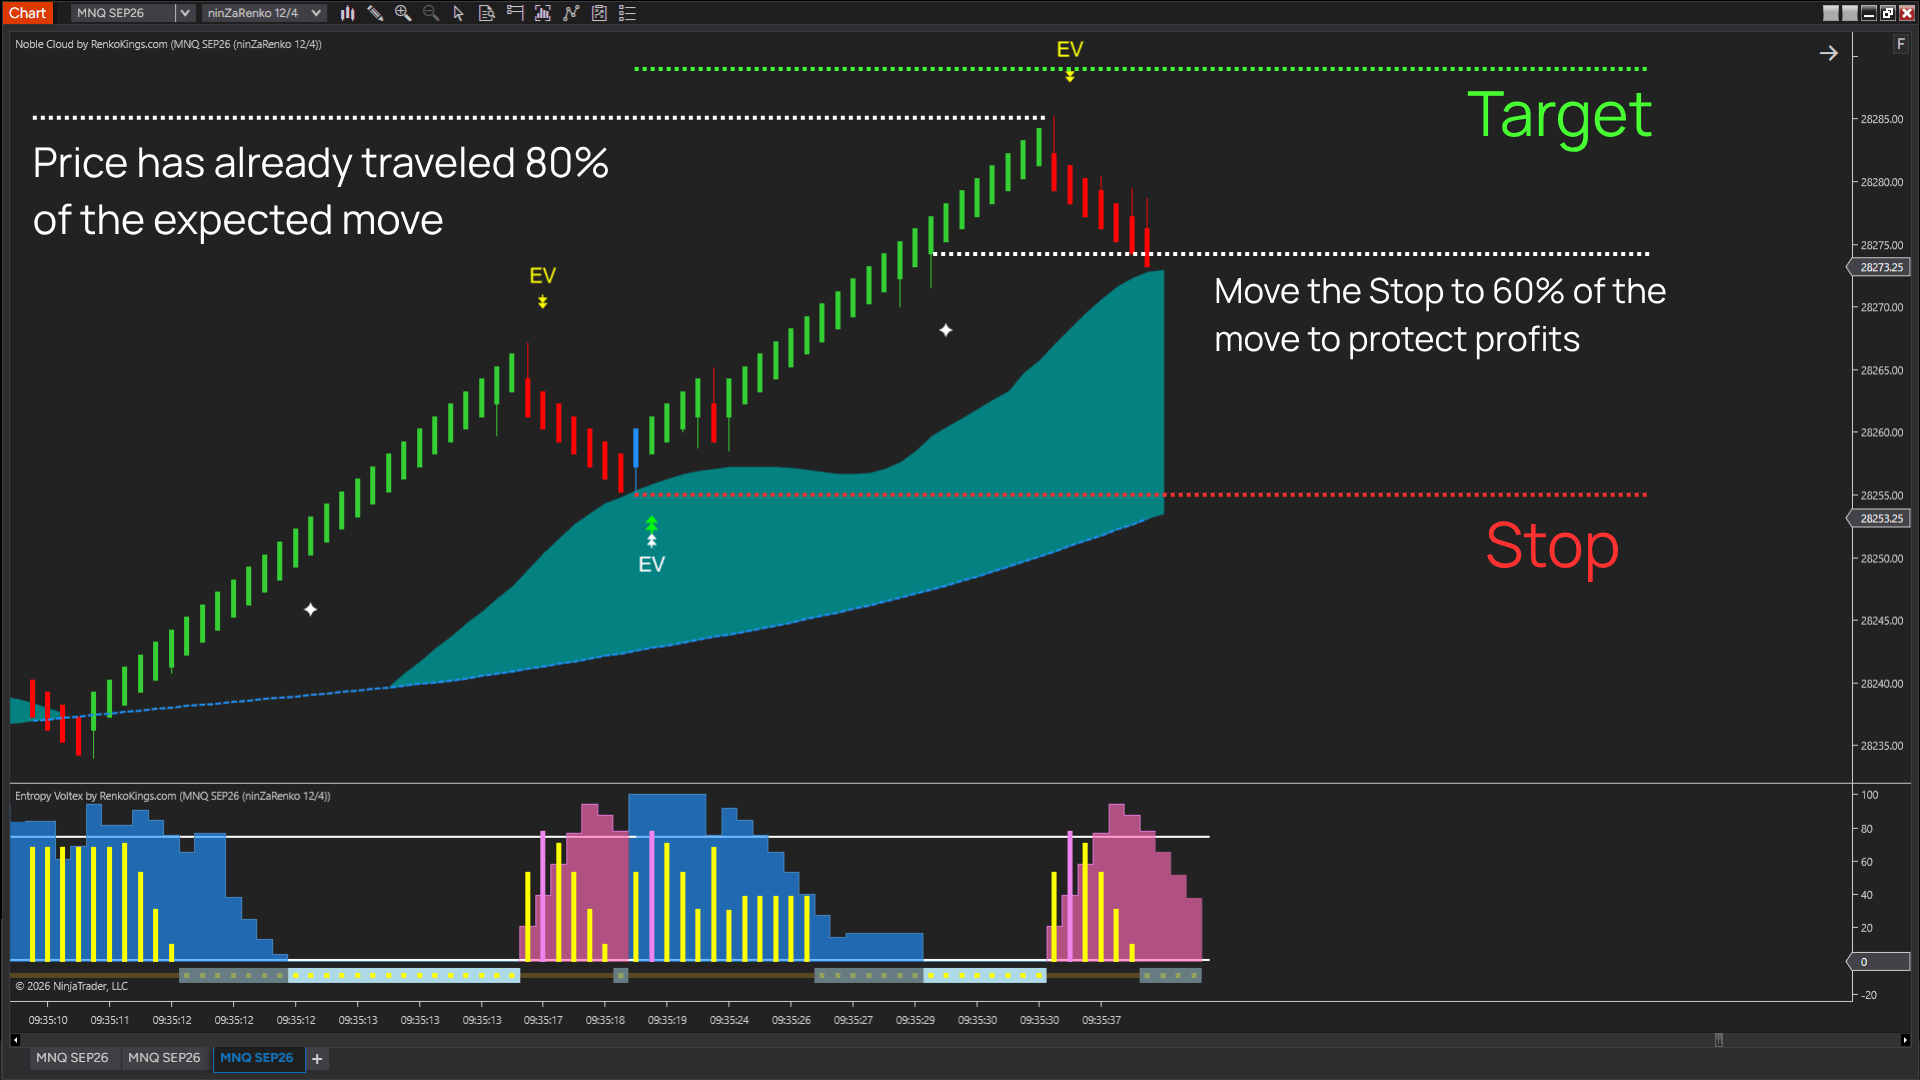
Because the Take Profit target is already relatively small, moving the Stop Loss to the entry price early – or moving it further in the trade’s favor once price has covered most of the distance – does not significantly reduce the expected profit, as only 40–50% of the Take Profit range remains. However, it protects capital if price unexpectedly reverses during the final stage. This creates a favorable asymmetric trade-off: the reduction in risk is greater than the potential reward being sacrificed.
2. Stop Loss / Take Profit for setup 2
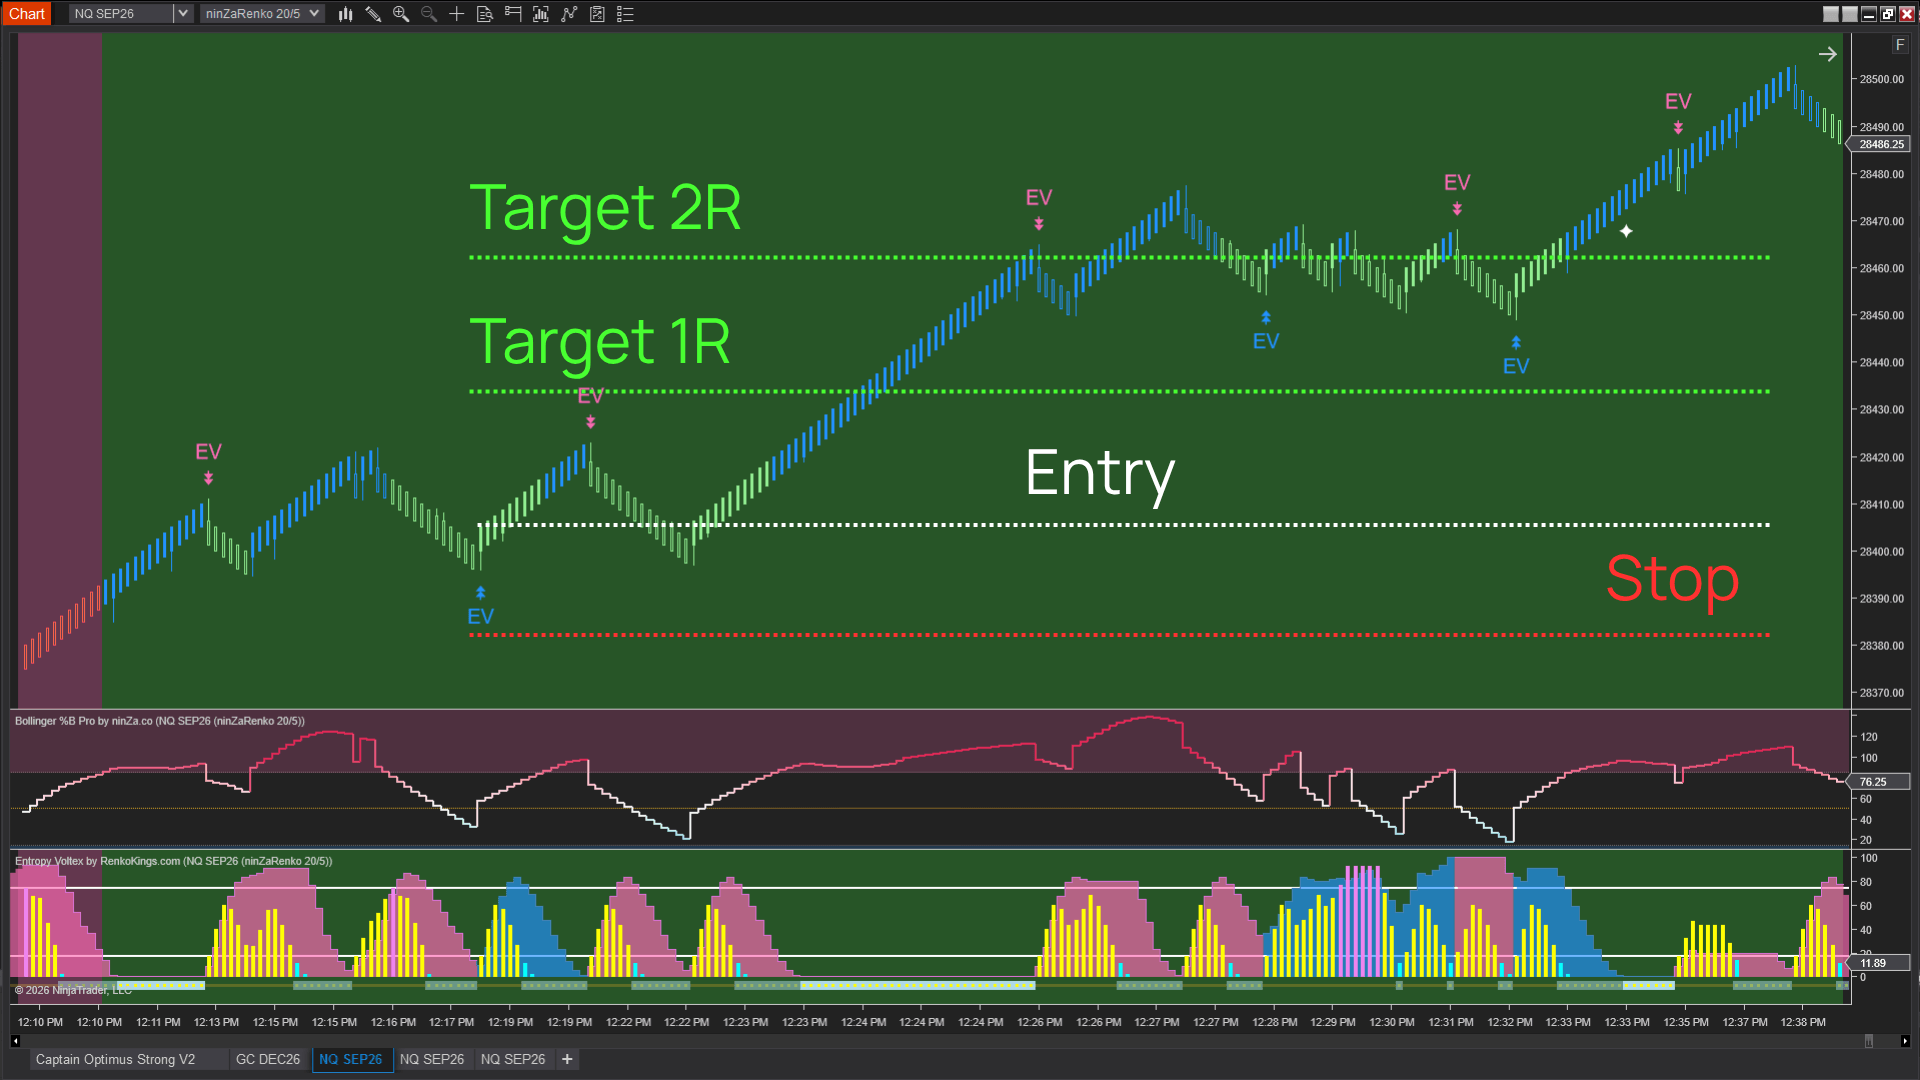
Rationale for a higher R:R ratio (2:1 or 3:1): This setup enters a trade only when both momentum layers are aligned simultaneously, meaning that it requires stronger momentum conditions. As a result, it generates fewer signals, but each signal represents a larger price move because the strength of the momentum has been confirmed by %B Pro. Therefore, the win rate may be lower than that of Setup 1, while the setup can still maintain a positive expectancy due to the greater reward potential of each trade.
Tip 1 – Move the Stop Loss to the long-wick candle area
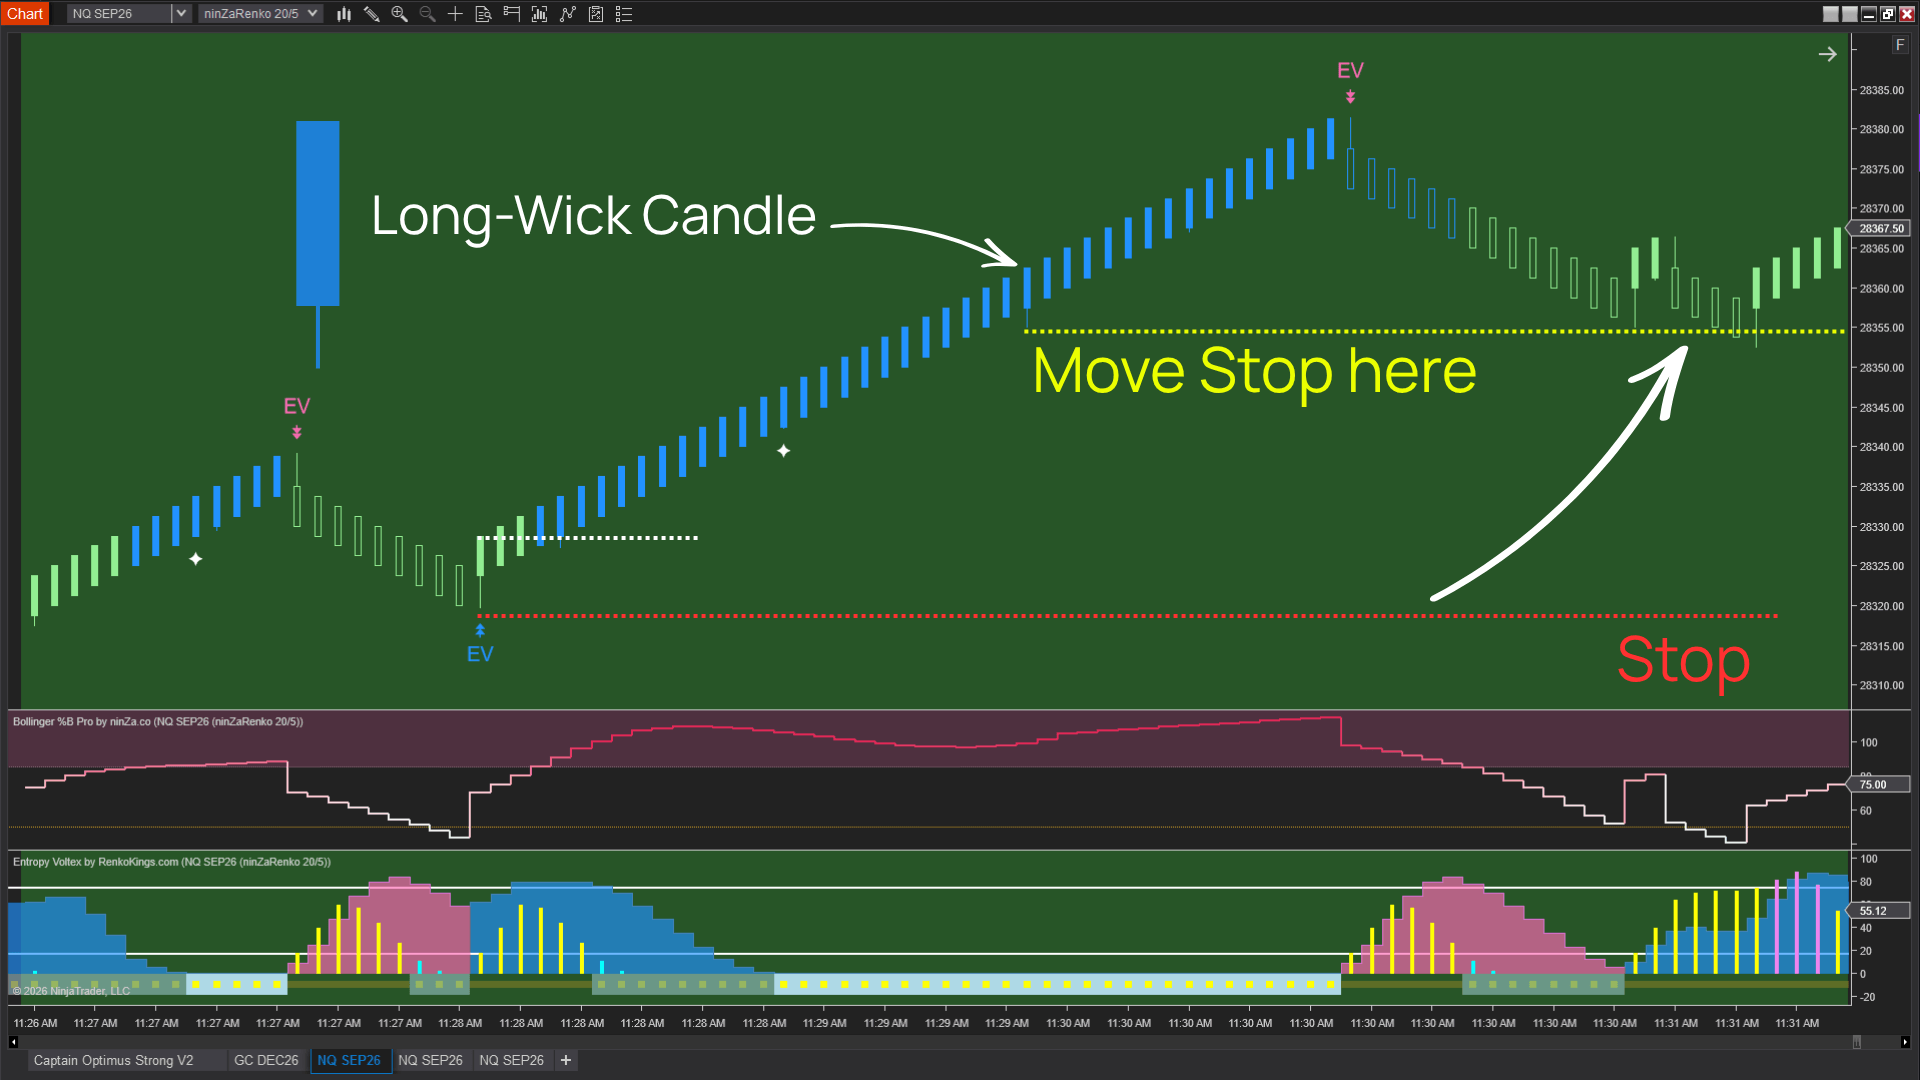
Continue using brick size as the base unit, although the Stop Loss may be set slightly wider. For example, with the same 20/4 Renko configuration, the Stop Loss can be set at Brick Size × 3, or approximately 60 ticks. However, the Stop Loss should be adjusted when long-wick candles appear.
A long-wick candle indicates that price was pushed to a certain level and then strongly rejected. This suggests that, within that price area, one side of the market was strong enough to temporarily reverse the movement.
Placing the Stop Loss beyond this area, rather than at an arbitrary fixed number of ticks, helps prevent the trade from being stopped out during a retest of the rejection zone. Such retests are common price behavior after a strong move and may occur before price continues in the primary direction.
Tip 2 – Take Profit based on an opposing Entropy Voltex signal
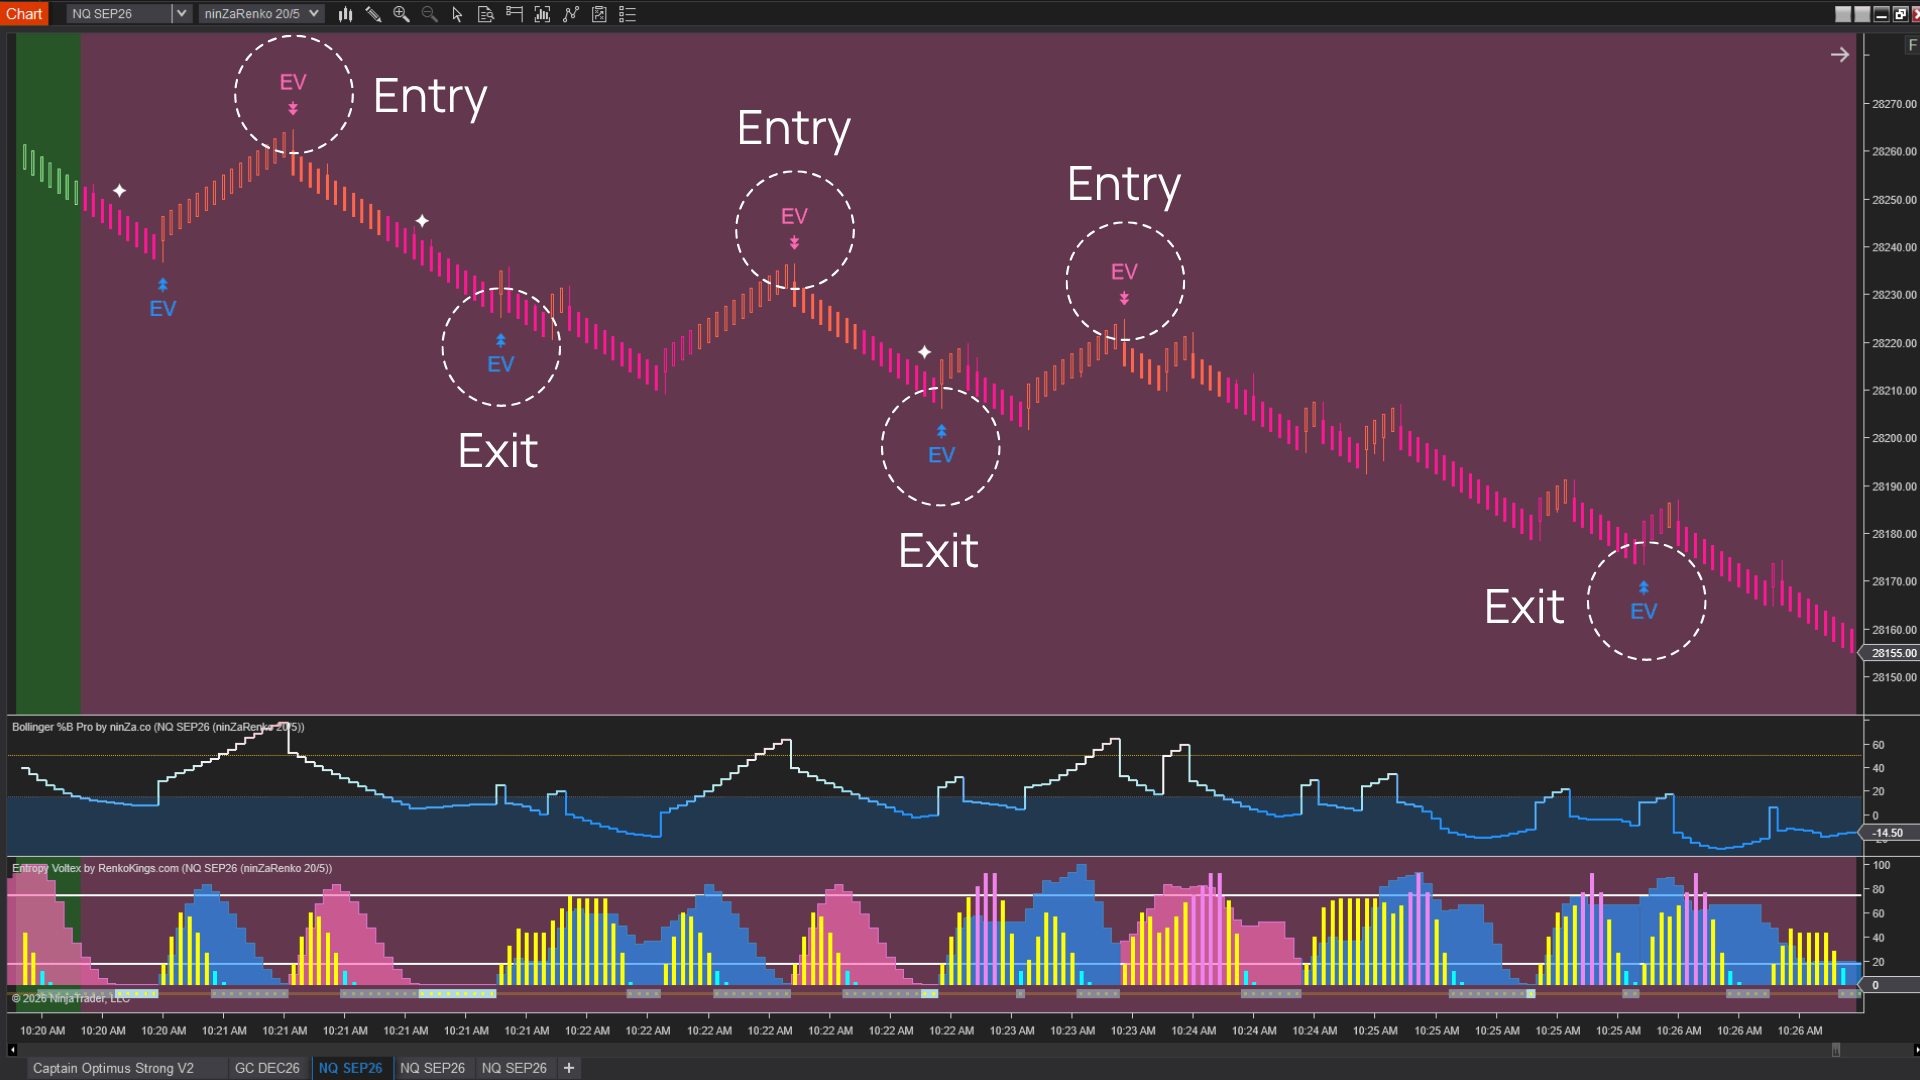
When Entropy Voltex begins to signal a transition from order back to chaos, this provides an early indication that momentum is starting to weaken.
Logically, tightening the Stop Loss or partially closing the position at this point is preferable to waiting for the fixed Take Profit target. Once entropy has begun to rise again, the probability of price continuing in the same direction at the same speed has decreased significantly compared with the time of entry.
Tip 3 – Do not extend the Take Profit target mid-trade out of greed
REFERENCE BASIS – Trading costs and impulsive changes to the plan
Research on investor behavior shows that excessive trading can reduce net performance after costs. In scalping, the spread, commissions, and slippage account for a larger proportion of each small profit move. Therefore, any discretionary change to the Take Profit or Stop Loss should be treated as a new strategy variation and tested separately.
Sources: Barber & Odean (2000); CFTC risk education materials.
A position should only be held beyond the original Take Profit target if Bollinger %B Pro continues to confirm that momentum remains strong and shows no sign of returning toward the neutral zone.
Extending the Take Profit target based on the feeling that “price is moving well,” without renewed confirmation from the indicator, is equivalent to abandoning the entire system at the most critical moment. The decision to continue holding a position requires the same standard of evidence as the decision to enter it.
These observations have been accumulated through practical trading experience and help refine both setups in situations where the basic checklist does not provide enough detail to support a decision.
3. Advanced trading tips for setup 1
Tip 1 – Do not take more than 2 trades within the same cloud
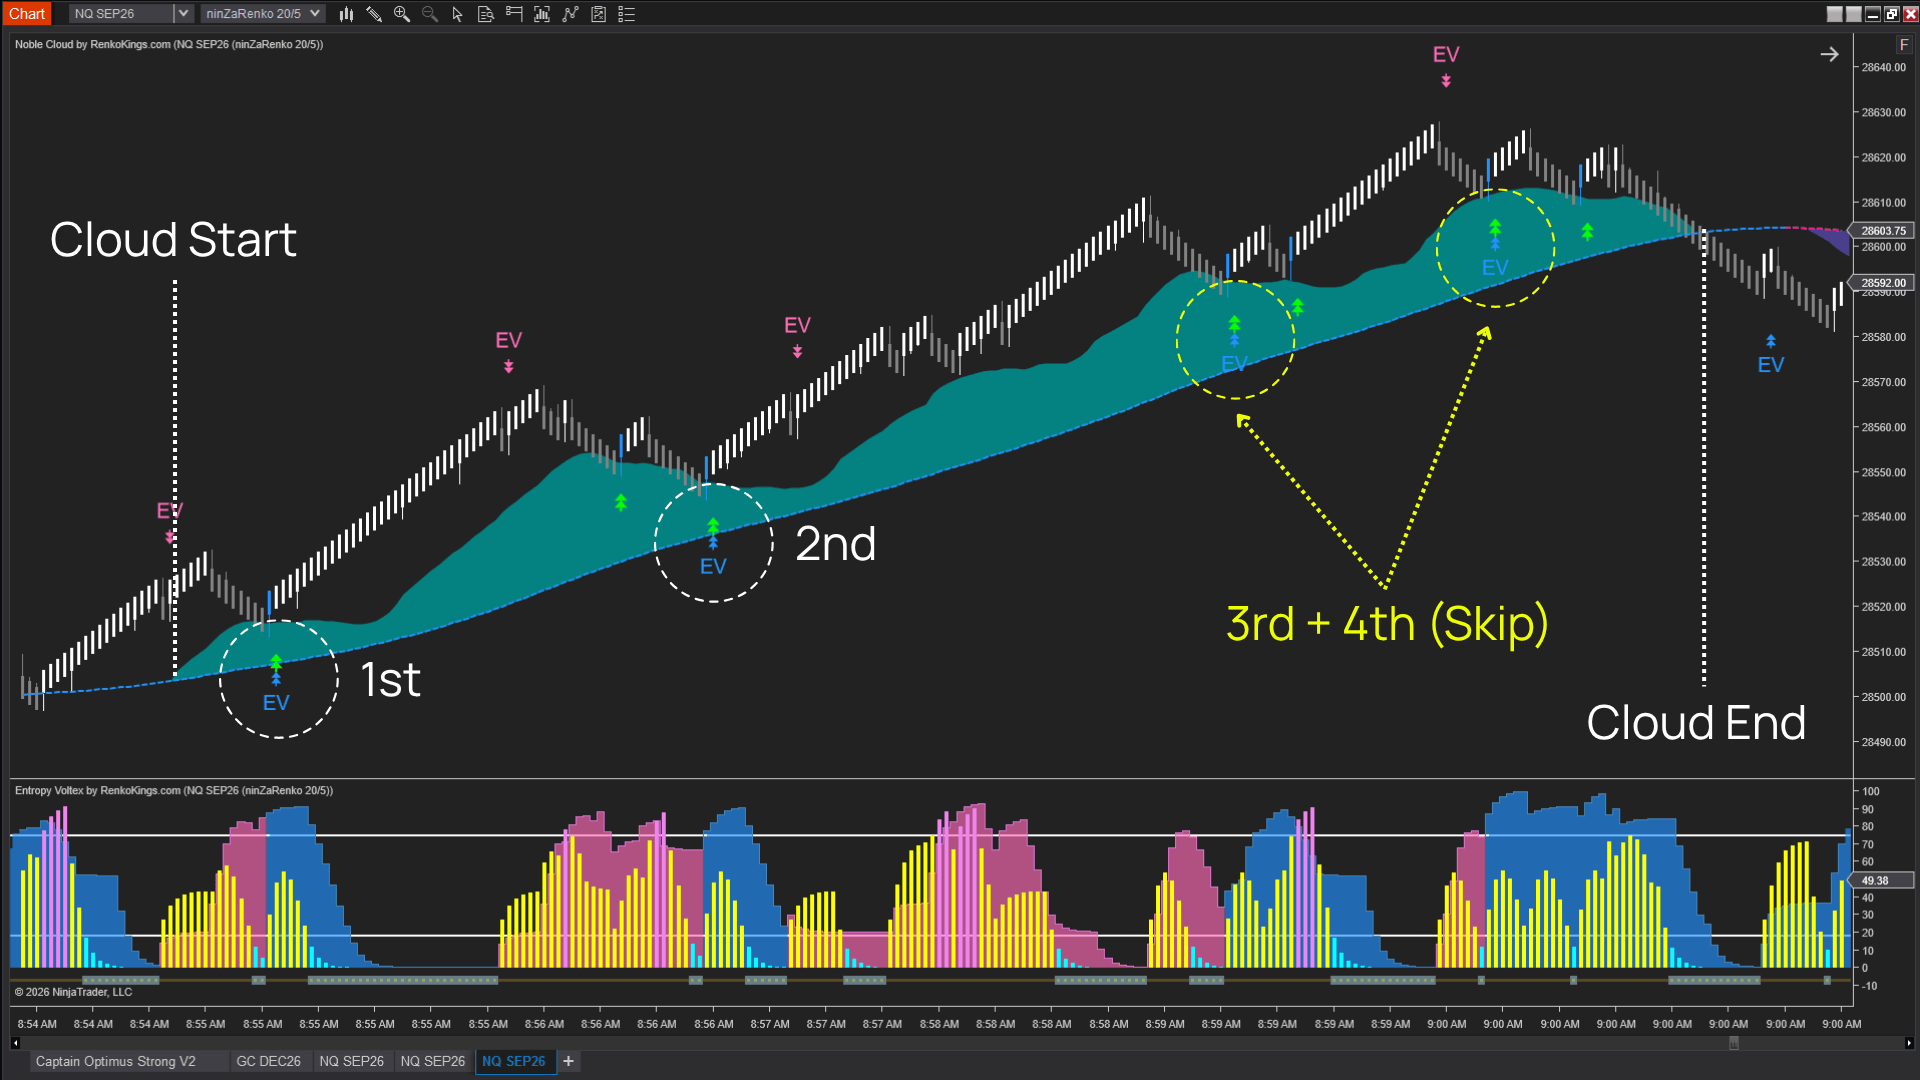
The cloud acts as a support/resistance zone. From a market-behavior perspective, the more frequently a support or resistance zone is tested within a short period, the more likely it is to gradually lose its ability to hold.
Each time price touches a support or resistance zone without breaking through it, part of the liquidity at that level is “consumed,” making the next test more likely to result in a breakout than the previous one.
If you still choose to take another trade after the first two, the Stop Loss and Take Profit should be set smaller than those of the previous trade to properly reflect this declining probability.
Tip 2 – Overlap signals close to both the cloud and the trend plot are more reliable
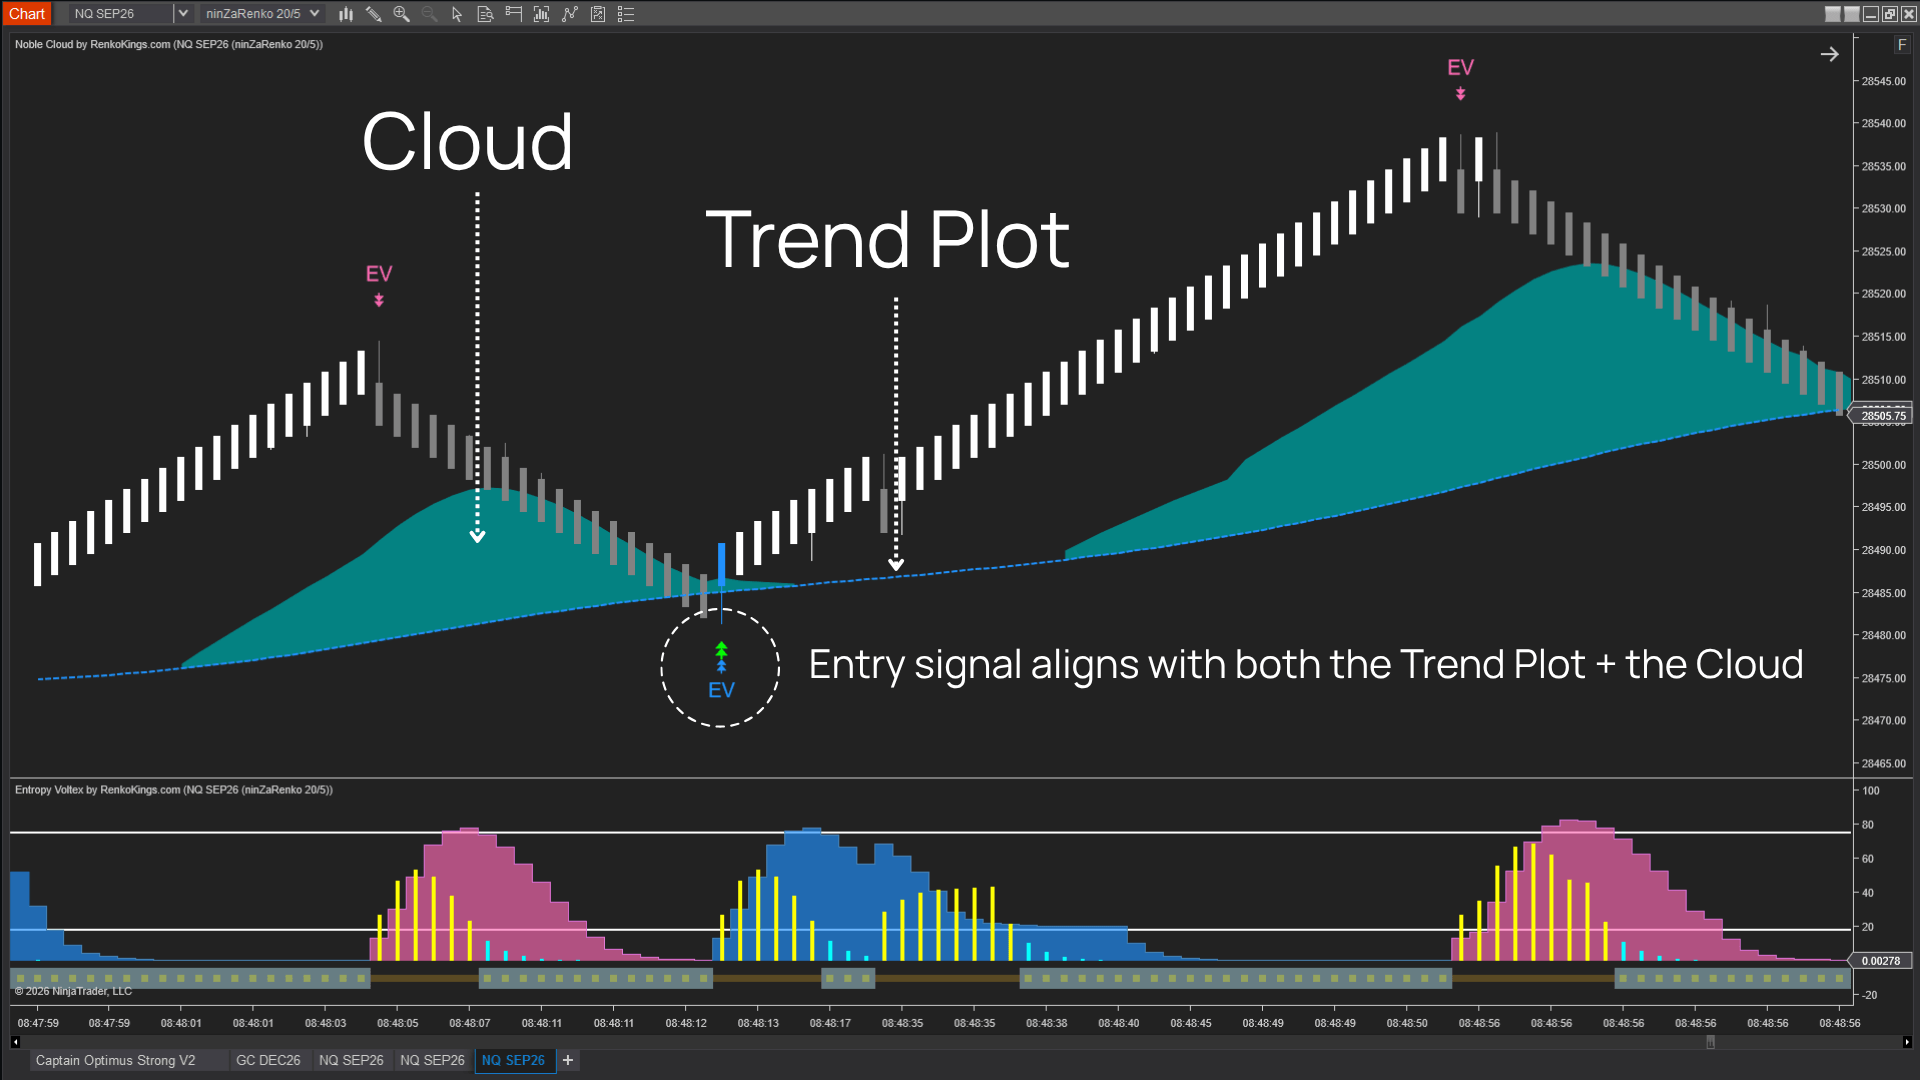
The cloud acts as a static support/resistance zone based on historical price structure, while the trend plot acts as dynamic support/resistance that moves in real time.
When these 2 fundamentally different types of support/resistance converge at the same point, they provide confirmation from 2 independent sources of information. Similar to the confluence principle discussed in Chapter 2, independent convergence is always more reliable than a standalone signal.
Tip 3 – Signals that appear very late after a cloud has been established for a long time are often more prone to noise
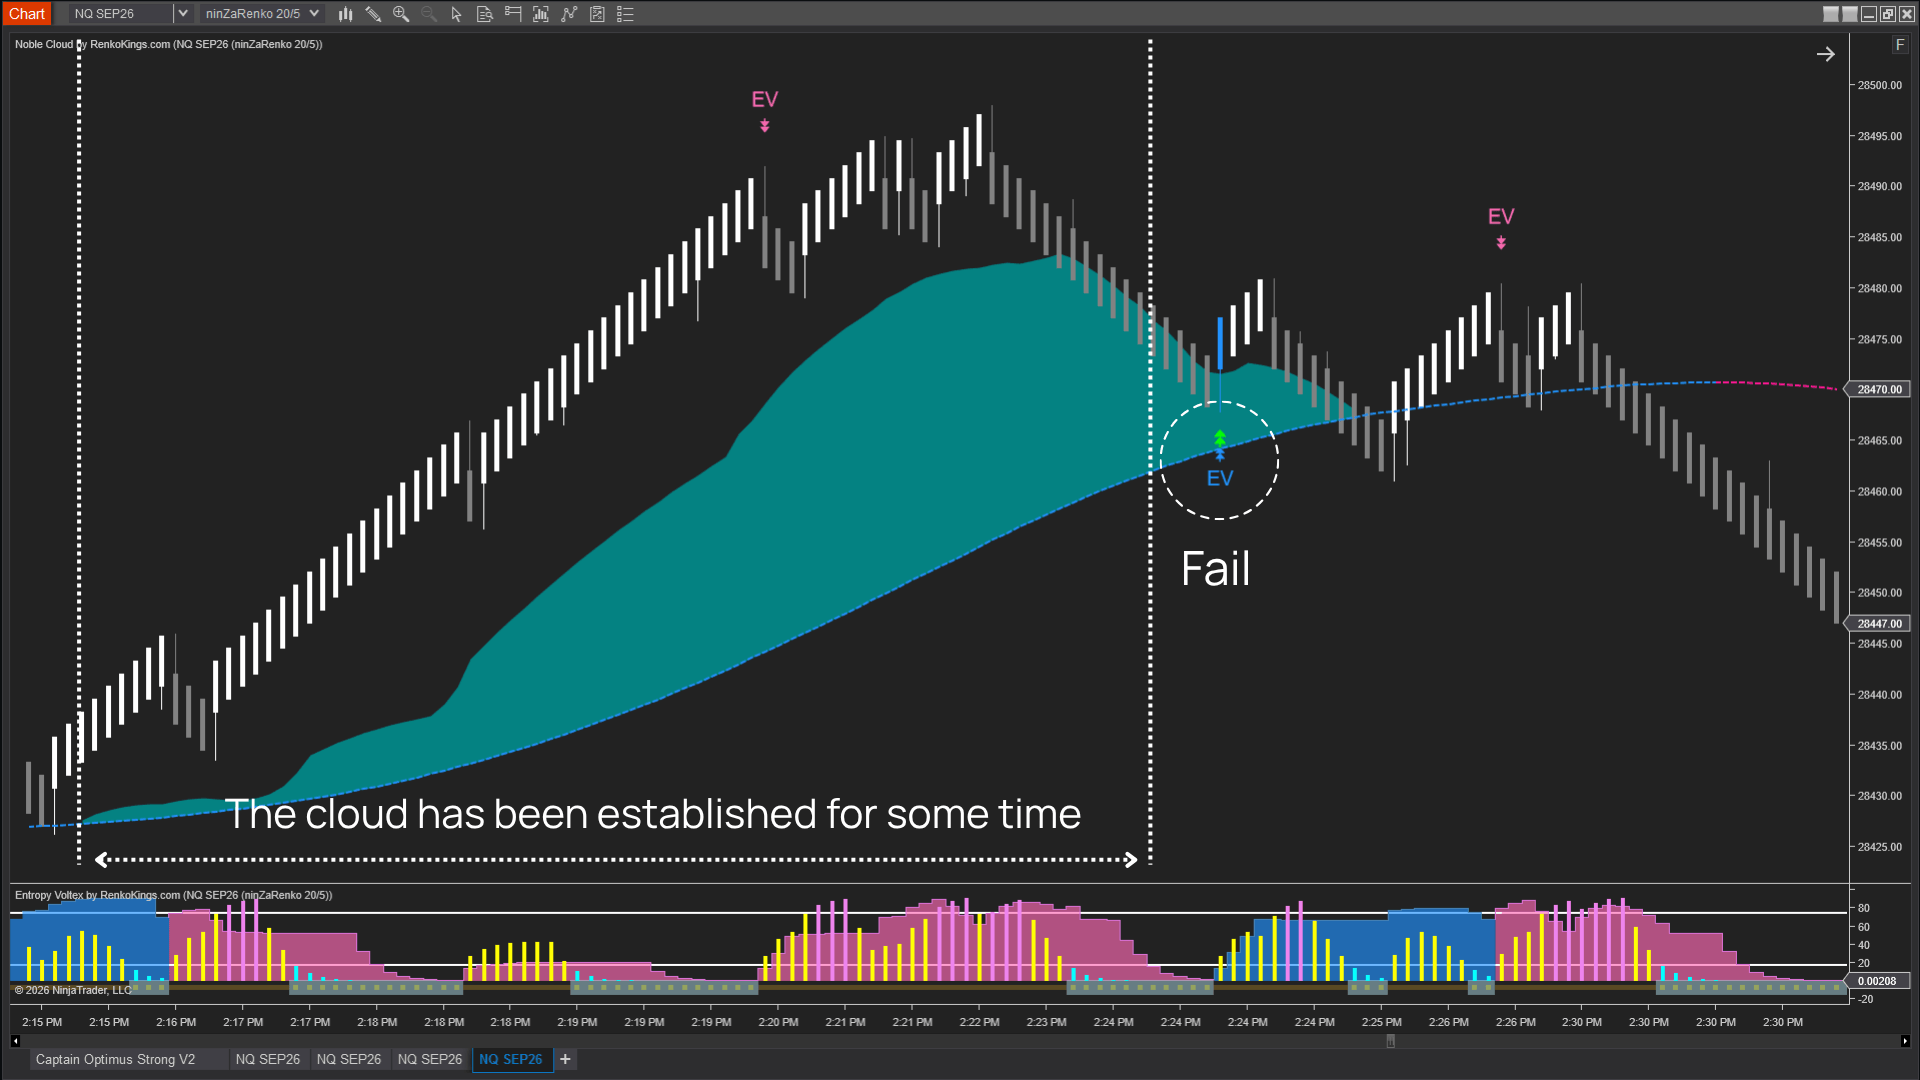
When a support/resistance price zone has existed for an extended period without any retest to evaluate the underlying supply and demand, it indicates that the market is building significant compressed pressure.
Once the breakout occurs, price often moves sharply and decisively, bypassing the usual technical pullbacks. Because the move is so fast and steep, signals that appear later no longer represent a sustainable trend. Instead, they are more likely to indicate exhaustion.
At this stage, large market participants may have already achieved their objectives and be preparing to withdraw. This makes the price area highly vulnerable to a sudden reversal, creating a substantial risk of loss for traders who enter late under the influence of crowd psychology.
Tip 4 – Do not enter immediately when the cloud has just formed and is still too small
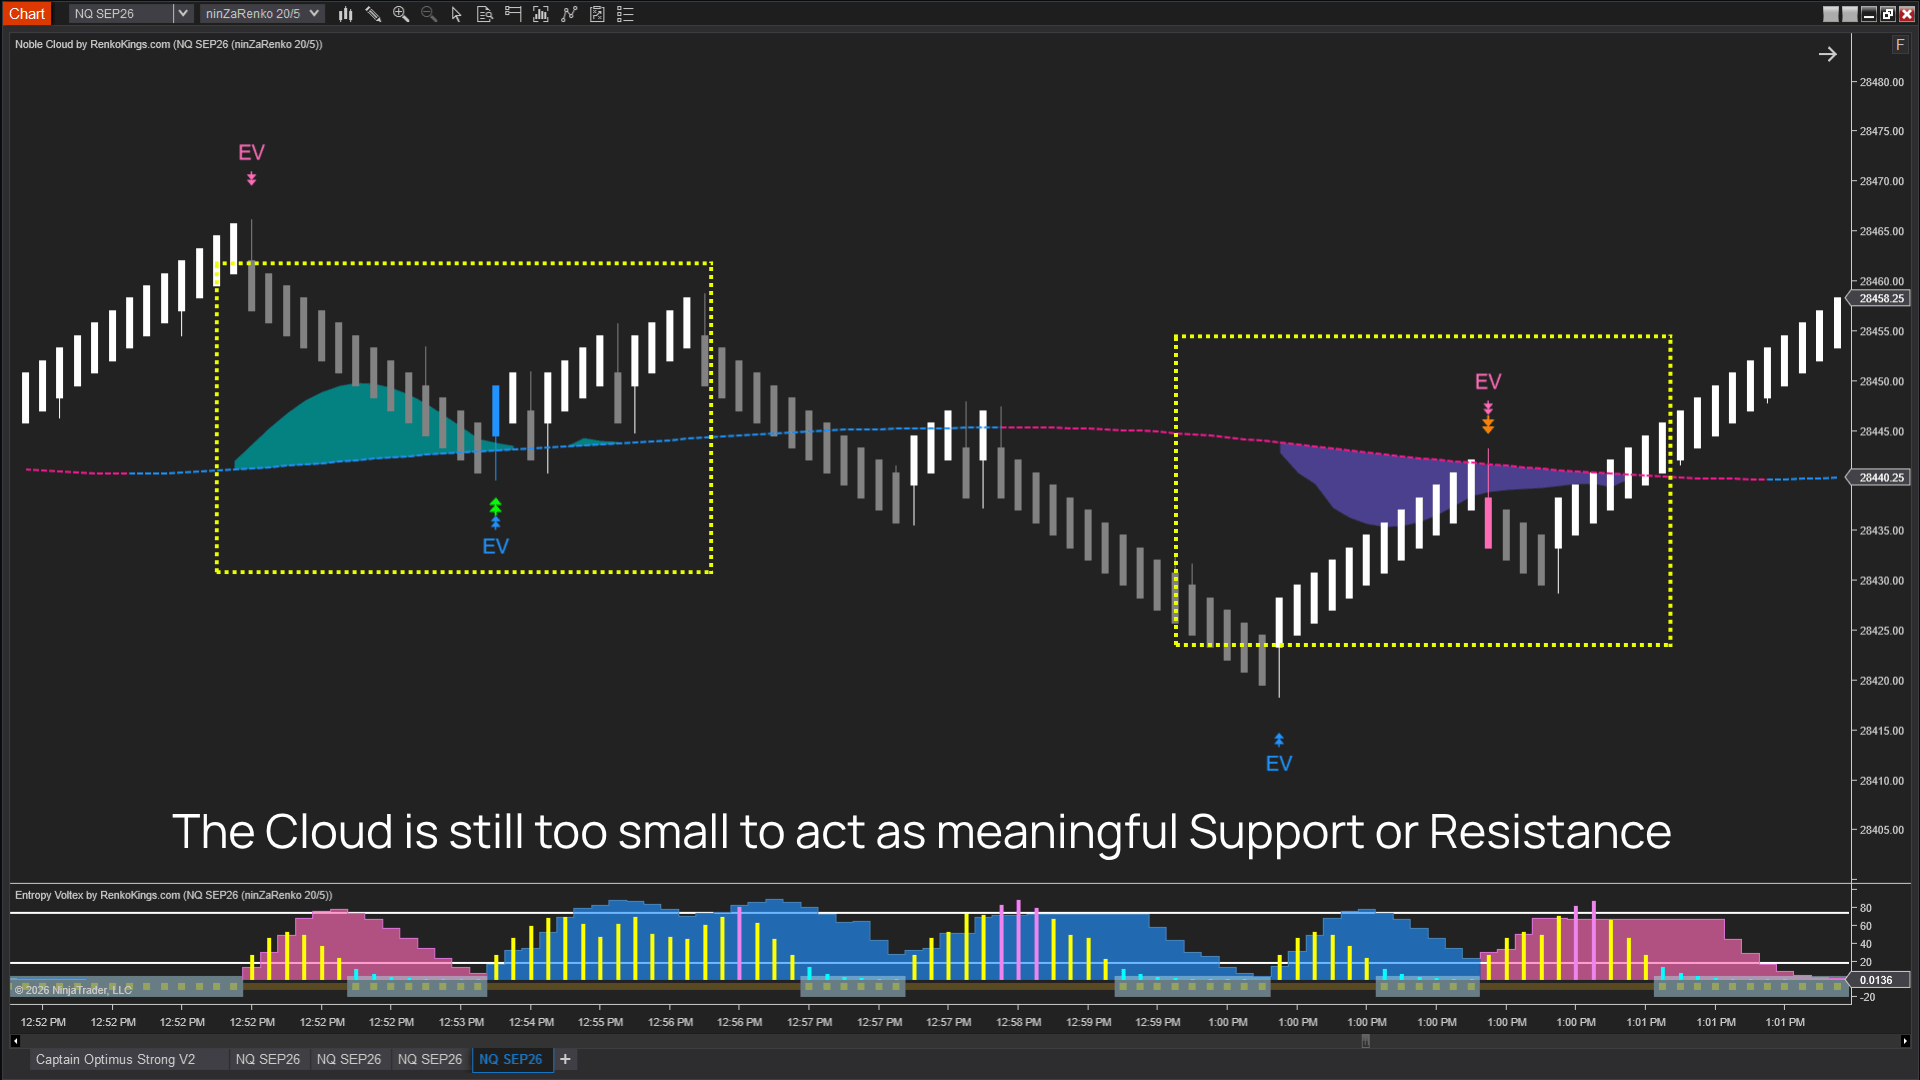
The thickness of the cloud corresponds to the amount of “price memory” accumulated within that area, as discussed in Section 2.2. A thin cloud means that there is not yet enough price data to form a reliable reaction zone. Therefore, it is more likely to be breached in a fakeout than a zone that has been reinforced over time.
4. Advanced refinements for setup 2
Tip 1 – Monitor how many times price enters the Overbought/Oversold zone within the same trend
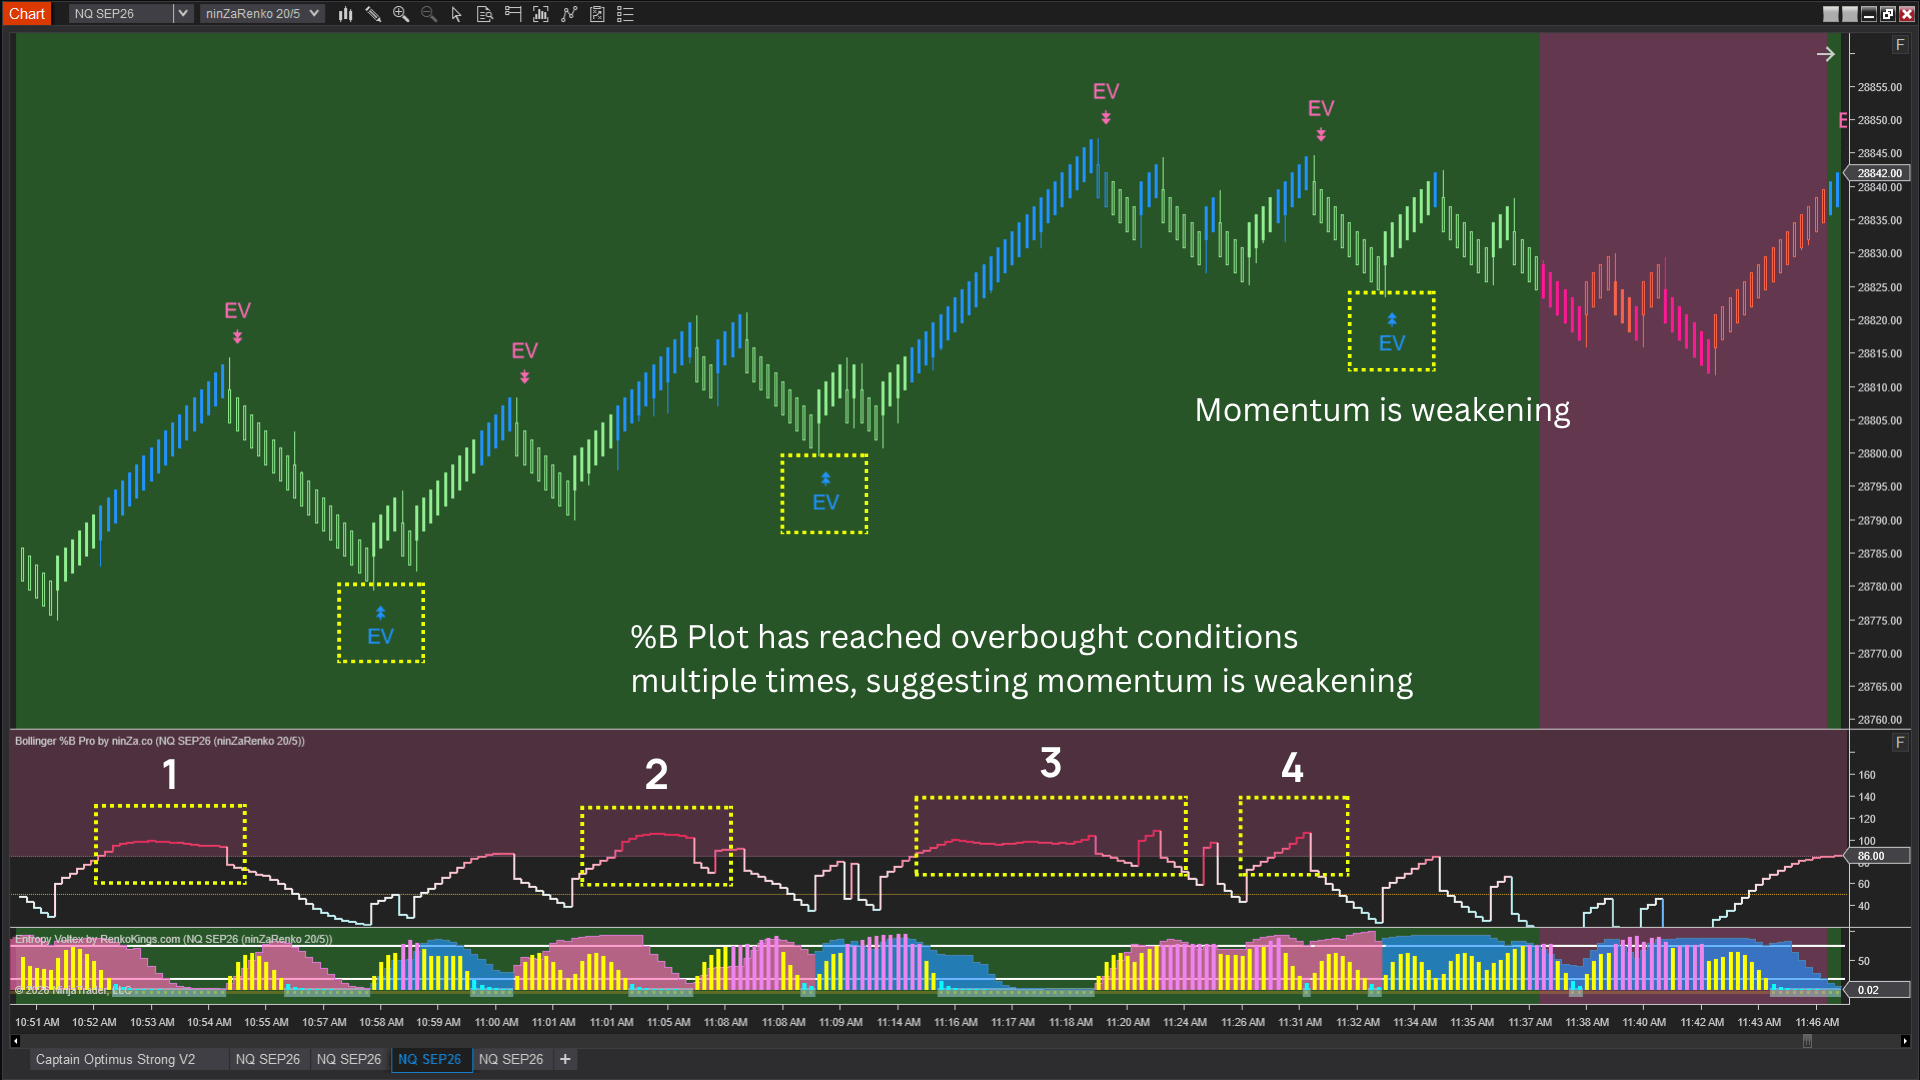
Each time price enters the overbought or oversold zone and then exits while the trend continues, part of that move’s “available price range” is consumed.
Momentum decay across repeated occurrences is a common observation in price behavior. The third or fourth entry into the overbought/oversold zone within the same move is generally less likely to produce a subsequent move as strong as the first, because most market participants trading in that direction have already entered during the earlier occurrences.
Tip 2 – Monitor how long %B remains in the OB/OS zone
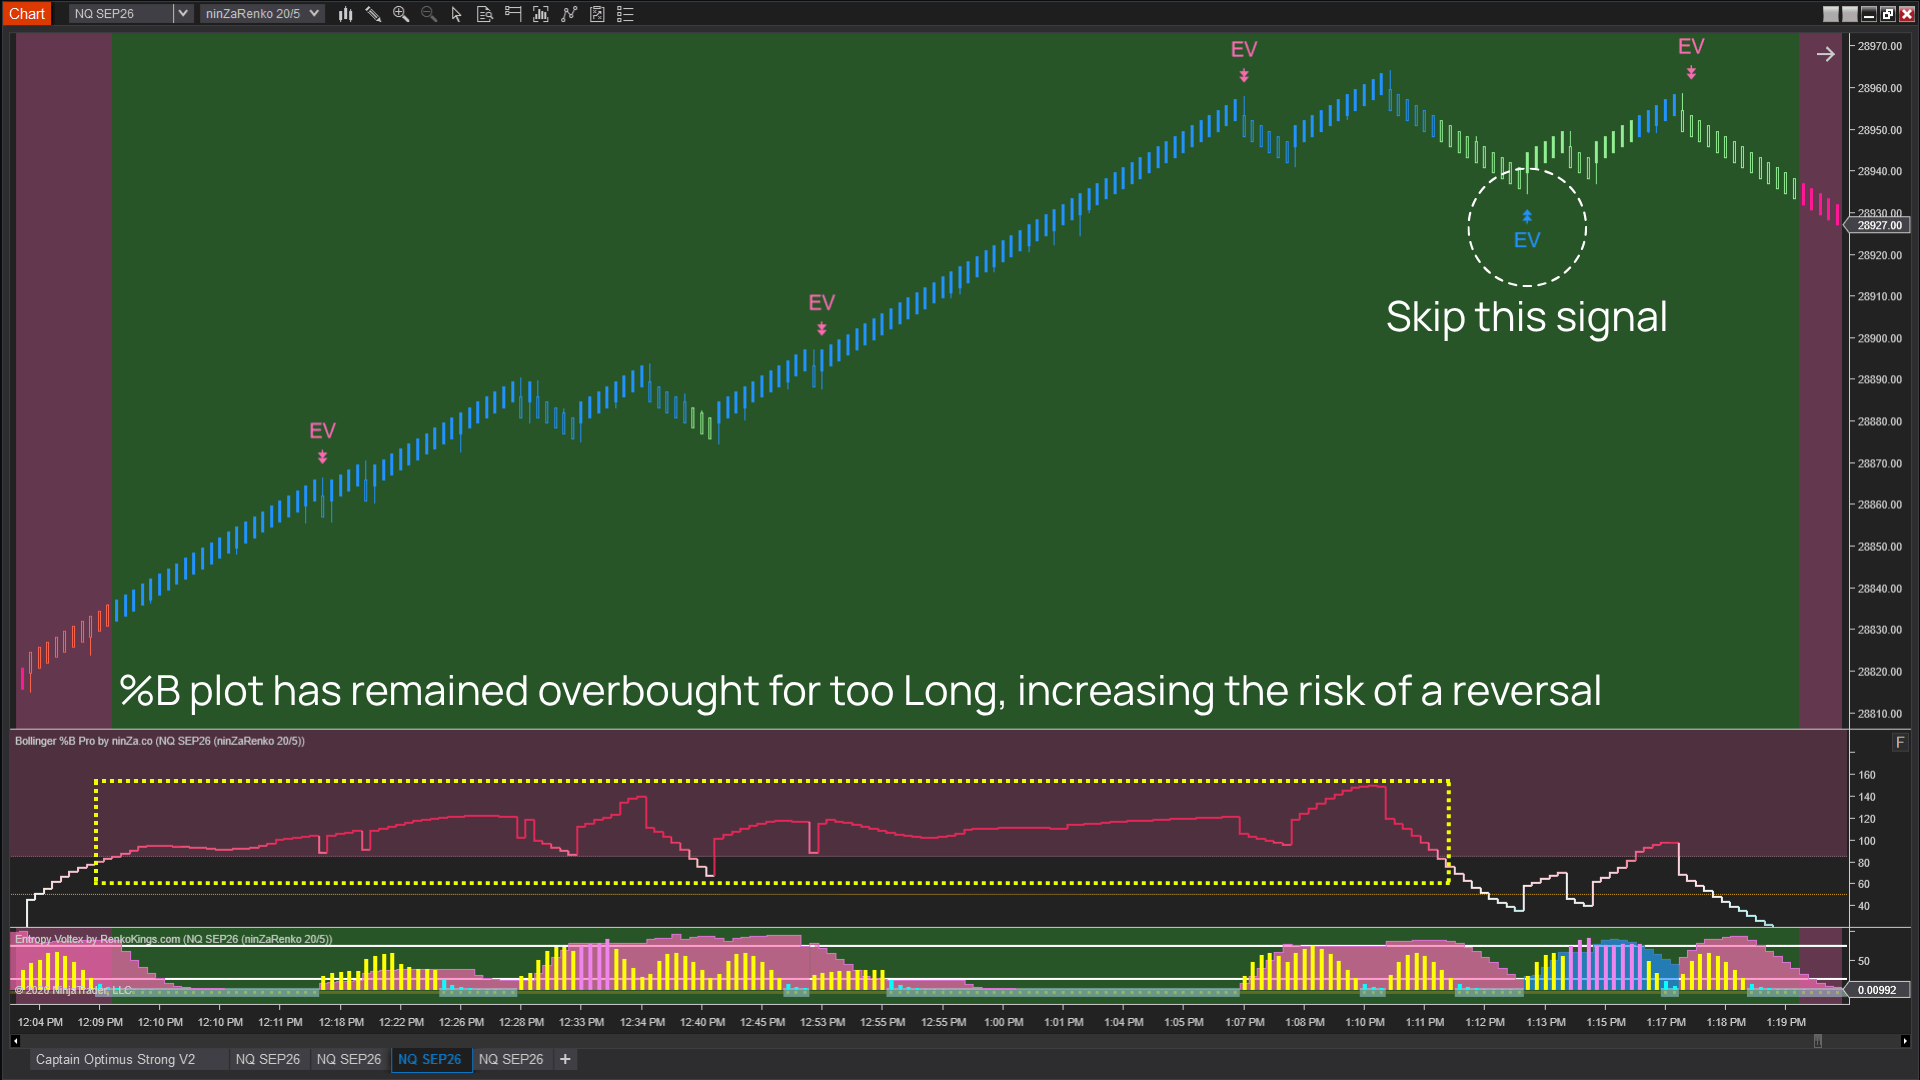
If %B remains in the extreme zone for too long without exiting, this indicates that price has moved far beyond its recent normal range of fluctuation, based on the statistical definition of Bollinger Bands using standard deviation.
The probability of a corrective move back toward the mean increases the longer price remains in an extreme state. Therefore, this is not an ideal time to add another position in the direction of the trend.
Continue reading →
Chapter 5: Configuring the Setups in Captain Optimus Strong v2 & Infinity Algo Engine$